Site by Bennett Web & Design Co.
Journal of the North Atlantic
T.D. Price and J. Arneborg
2018 Special Volume 7
164
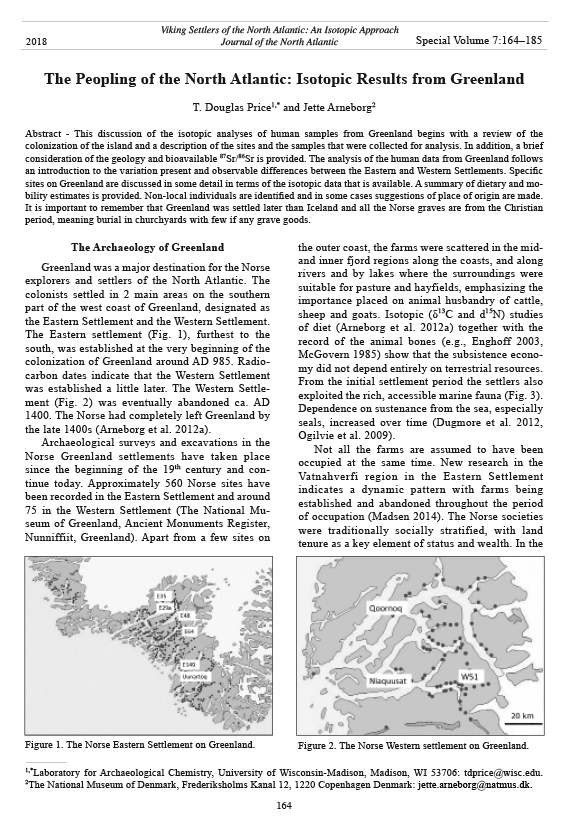
The Archaeology of Greenland
Greenland was a major destination for the Norse
explorers and settlers of the North Atlantic. The
colonists settled in 2 main areas on the southern
part of the west coast of Greenland, designated as
the Eastern Settlement and the Western Settlement.
The Eastern settlement (Fig. 1), furthest to the
south, was established at the very beginning of the
colonization of Greenland around AD 985. Radiocarbon
dates indicate that the Western Settlement
was established a little later. The Western Settlement
(Fig. 2) was eventually abandoned ca. AD
1400. The Norse had completely left Greenland by
the late 1400s (Arneborg et al. 2012a).
Archaeological surveys and excavations in the
Norse Greenland settlements have taken place
since the beginning of the 19th century and continue
today. Approximately 560 Norse sites have
been recorded in the Eastern Settlement and around
75 in the Western Settlement (The National Museum
of Greenland, Ancient Monuments Register,
Nunniffiit, Greenland). Apart from a few sites on
the outer coast, the farms were scattered in the midand
inner fjord regions along the coasts, and along
rivers and by lakes where the surroundings were
suitable for pasture and hayfields, emphasizing the
importance placed on animal husbandry of cattle,
sheep and goats. Isotopic (δ13C and d15N) studies
of diet (Arneborg et al. 2012a) together with the
record of the animal bones (e.g., Enghoff 2003,
McGovern 1985) show that the subsistence economy
did not depend entirely on terrestrial resources.
From the initial settlement period the settlers also
exploited the rich, accessible marine fauna (Fig. 3).
Dependence on sustenance from the sea, especially
seals, increased over time (Dugmore et al. 2012,
Ogilvie et al. 2009).
Not all the farms are assumed to have been
occupied at the same time. New research in the
Vatnahverfi region in the Eastern Settlement
indicates a dynamic pattern with farms being
established and abandoned throughout the period
of occupation (Madsen 2014). The Norse societies
were traditionally socially stratified, with land
tenure as a key element of status and wealth. In the
The Peopling of the North Atlantic: Isotopic Results from Greenland
T. Douglas Price1,* and Jette Arneborg2
Abstract - This discussion of the isotopic analyses of human samples from Greenland begins with a review of the
colonization of the island and a description of the sites and the samples that were collected for analysis. In addition, a brief
consideration of the geology and bioavailable 87Sr/86Sr is provided. The analysis of the human data from Greenland follows
an introduction to the variation present and observable differences between the Eastern and Western Settlements. Specific
sites on Greenland are discussed in some detail in terms of the isotopic data that is available. A summary of dietary and mobility
estimates is provided. Non-local individuals are identified and in some cases suggestions of place of origin are made.
It is important to remember that Greenland was settled later than Iceland and all the Norse graves are from the Christian
period, meaning burial in churchyards with few if any grave goods.
Viking Settlers of the North Atlantic: An Isotopic Approach
Journal of the North Atlantic
1,*Laboratory for Archaeological Chemistry, University of Wisconsin-Madison, Madison, WI 53706: tdprice@wisc.edu.
2The National Museum of Denmark, Frederiksholms Kanal 12, 1220 Copenhagen Denmark: jette.arneborg@natmus.dk.
2018 Special Volume 7:164–185
Figure 1. The Norse Eastern Settlement on Greenland. Figure 2. The Norse Western settlement on Greenland.
Journal of the North Atlantic
T.D. Price and J. Arneborg
2018 Special Volume 7
165
late settlement period, a few magnate farms may
have controlled most of the land.
Farms with churches and, in some cases, also
banqueting halls and warehouses (cf. Arneborg
2006) have been recognized as manor farms and
the social and economic centers of their regions.
In the Eastern Settlement, 16 farms have been
recorded with associated churches. Of those, at
least 5 churches were established at the time of
initial settlement and closed down during the 13th
century, indicating a progressive centralization of
power in society (Arneborg 2012). Simultaneously,
the churches changed scale and role as they shifted
from small congregations of local family groups
and their servants to serving a larger public,
including the inhabitants of the surrounding farms.
In the Western Settlement, 3 farms have been recorded
with an associated church.
The goal of this study is the isotopic investigation
of human tooth enamel from individuals buried on
Greenland from the period of initial settlement.
Our purpose is to learn more about the origins and
movement of the individuals who lived on this
large, cold island continent. In previous articles
in this volume, the methods we used are explained
and the general isotopic background for this region
is outlined. In this study, we provide the results of
the isotopic proveniencing of the human remains
from Greenland and document differences between
the Eastern and Western settlements. It is clear that
many of the first settlers came from Iceland along
with their domesticated animals. It is also clear
that individuals moved a good bit between the 2
major settlement areas on Greenland as well as
returning to Iceland and in at least one case even to
Norway. In the following pages, we summarize the
baseline isotopic context on Greenland and present
the human enamel isotope data. These data are
analyzed and discussed on the scale of Greenland,
the Eastern and Western Settlements, the sites with
burials, and the individual level.
Baseline Geology and Bioavailable Isotopes
In general terms, the geology of much of
Greenland is exceedingly old, some of the most
ancient terrain preserved on earth. 87Sr/86Sr values
are normally very high in this context. Hoppe et
al. (2003) have estimated that Greenland 87Sr/86Sr
geological values fall between 0.725 and 0.755. The
2 major settlement areas are located on different
geological terrains, with important consequences for
the 87Sr/86Sr values at each. The areas of the Eastern
and Western Norse settlements on Greenland are
dominated by Precambrian rocks constituting the
Proterozoic and the Archaean craton (Kalsbeek
1997, Moorbath and Pankhurst 1976). The Western
Settlement, near modern-day Nuuk, lies in the
Archaean section of the craton. The Eastern settlement
is located on Proterozoic rocks, part of the Gardar
province in southernmost Greenland, composed
of Paleoproterozoic metamorphic intrusive and
metamorphic rock sequences.
As Price et al. (2015 [this volume]) discussed,
48 samples of archaeological fauna from the Western
and Eastern Settlements have been measured for
bioavailable 87Sr/86Sr (Fig. 4). Various species have
been sampled including cattle, caribou, arctic fox,
and ptarmigan (Price et al. 2015 [this volume]:table
5). Hare and the caribou from the Western Settlement
show a dramatic degree of variation from
~0.712 to values >0.760, consistent with the known
age of the rocks in the region. The majority of the
hare values lie between 0.750 and 0.760. The lower
values are very likely from animals living near
the coast and consuming vegetation impacted by
marine rainfall and sea spray (e.g., Chadwick et al.
1999, Vitousek et al. 1999, Whipkey et al. 2000).
The Arctic fox, ptarmigan, and cattle do not
show the extreme values seen in hare and caribou
and probably reflect the best bioavailable 87Sr/86Sr
estimate for the Eastern Settlement. Values for the
most part range between 0.711 to 0.716. A total of
34 faunal samples from the Eastern Settlement had
a mean value of 0.7133 ± 0.0025, with a minimum
value of 0.7065 and a maximum value of 0.7212.
Clearly, higher strontium isotope values can be
expected for local human tooth enamel in the
Western Settlement.
Figure 3. δ13C values (‰) in human samples. Time progression
is left to right (Blue is AMS date, red is archaeologically
dated). The midpoint value for those obtaining
half their protein from their domestic animals and half
from the marine mammals would be δ13C = -16.3‰,
whereas those consuming 25% and 75% marine protein
would have δ13C = -17.8‰ and -14.9‰, respectively (Arneborg
et al. 2012a).
Journal of the North Atlantic
T.D. Price and J. Arneborg
2018 Special Volume 7
166
Oxygen isotope ratios in carbonate should also
vary between the Eastern and Western Settlements.
Fricke et al. (1995) report large-scale variation in
oxygen isotope ratios in modern precipitation on
Greenland and across the North Atlantic. Values
vary significantly with latitude along the west
coast of Greenland. δ18Oen PDB values in non-Inuit
human bone carbonate from the Eastern and Western
Settlements vary from approximately -8.0‰ to
-4.0‰. Average δ18Oen PDB values are approximately
-7.5‰ and -5.5‰ in the Western and Eastern Settlements
respectively.
Greenland Human Isotope Data
Our samples for isotopic proveniencing come
from both the Eastern and Western Settlements.
No pagan graves have been found in the Greenland
settlements to this day, and all our human samples
are from burials in Christian graveyards. From the
Eastern Settlement we have samples of human remains
from 5 locations, designated as ruin groups
on Greenland (Fig. 1): 1. Tjodhildes church in Qassiarsuk,
Brattahlid, in Tunulliarfik fjord (ruin group
E29a); 2. Qorlortup Itinnera, ruin group E35 just
Figure 4. 87Sr/86Sr values for archaeological fauna from Greenland, ranked by species. Blue = Eastern Settlement, red =
Western Settlement.
Journal of the North Atlantic
T.D. Price and J. Arneborg
2018 Special Volume 7
167
north of Qassiarsuk; 3. a church close to Igaliku
and the Norse Bishop see Gardar in Igaliku fjord
(ruin group E48); 4. the church at Innoqqussaq
in Igaliku Kujalleq (ruin group E64); and 5. the
church at Narsarsuaq in Uunartoq fjord (ruin group
E149), presumed to be a nunnery. From the Western
Settlement we have Norse human samples from
the church at Kilaarsarfik (ruin group W51), also
known as Sandnes (Fig. 2). In addition to the Norse
burials, 3 Inuit burials have been included in our
study for comparison. Samples of faunal remains
for the determination of bioavailable isotope ratios
were collected from several of the settlements and
are discussed below. The sites are also described to
provide the context for the human enamel samples
used in the isotopic analysis.
The isotope data for human tooth enamel
from Greenland is presented in Table 1. We
have measured strontium isotopes in human
tooth enamel from 50 individuals. The average
87Sr/86Sr value for all samples is 0.7125 ± 0.005.
These values are highly variable and generally
low, varying from 0.7069 to 0.7314, compared
to expectations from the faunal remains. These
data are graphed by site in Figure 5, with 87Sr/86Sr
values shown in ranked order.
Human values for local Greenland Norse with
a terrestrial diet might be expected to resemble
the bioavailable values from the fauna. Several
factors have caused these values to be lower than
expected. Some of these individuals may be
colonists from Iceland or from Norse homelands in
the British Isles, Ireland, or Scandinavia, in which
case they would not exhibit the high 87Sr/86Sr
values observed for Greenland. A diet of marine
foods or terrestrial foods from coastal areas with
sea spray, heavy rainfall, or seaweed fertilizers
would also lower expected human enamel values
toward the known value for seawater of 0.7092. It
could also be the case that there are unknown areas
in the Eastern or Western Settlement with sources
for lower 87Sr/86Sr, although this seems unlikely.
The unexpectedly low values among the measured
individuals will be addressed in more detail below.
There are also significant differences among the
sites investigated in this study and with the Inuit
values that will also be discussed in more detail in
the following pages.
The mean value for carbonate δ18O for 50 human
enamel samples from Greenland is -7.2‰ ± 1.8 with
a minimum and maximum of between -11.3‰ and
-3.4‰. A kernel density plot of the distribution of
values is shown in Figure 6. The primary mode is at
around -6.7‰. The secondary mode on the left side
of the plot at approximately -9.0‰ suggests a smaller
subset that may represent the differences between
the Western and Eastern Settlements. The tertiary
mode to the right of the plot peaks around -3.5‰.
The mean δ18O value for 3 Eastern Settlements is
-6.71‰ ± 1.7 and the mean for the Western Settlement
at Sandnes is -9.15‰ ± 1.20. This difference is
expected given the fact that δ18O values decrease to
the north.
There are interesting differences in the
Greenland human enamel data in terms of sex.
Table 2 presents n, mean, standard deviation,
minimum, and maximum for males and females
in our sample. There are twice as many females in
Figure 5. Ranked 87Sr/86Sr values for Norse tooth enamel from archaeological sites in Greenland. The three gray values are
from Inuit burials. E = Eastern Settlement, W = Western Settlement.
Journal of the North Atlantic
T.D. Price and J. Arneborg
2018 Special Volume 7
168
Table 1. Human enamel from Greenland, sample information and isotope data. DKNM = Danish National Museum. KNK = Greenland National Museum. KAL:= Department of Forensic Medicine,
“Antropologisk Laboratorium.” [Table continued on following page.]
Lab # Locality/ruin group Tooth DKNM_Id/NKA_Id KAL_Id Sex Age 87Sr/86Sr δ13C‰ δ18O‰ 14C Cal age (1 sigma) 14C Lab_Id
F6463 Sandnes (W51) 7- Skeleton XII KAL 930 ? ? 0.7101 -11.9 -9.6
F5652 Sandnes (W51) PM Skeleton X KAL 928 F 20–25 0.7140 -12.3 -8.9
F5653 Sandnes (V51) PM Skeleton XV KAL 932 F 20–25 0.7211 -11.9 -9.7
F5654 Sandnes (W51) Tooth Skeleton XVIIc KAL 936 F 25–30 0.7122 -13.1 -6.6
F5656 Sandnes (W51) PM Skeleton XXII KAL 947 F 30–35 0.7258 -12.0 -9.0 1045 (1030–1116) AAR-5258
F5657 Sandnes (W51) Tooth Skeleton XXXI KAL 959 F 40–45 0.7158 -13.4 -6.5 1301 (1284–1320) AAR-1147
F5658 Sandnes (W51) Tooth Skeleton XXX KAL 960 F 40–45 0.7194 -12.0 -10.1 1301 (1282–1322) AAR-1145
F5659 Sandnes (W51) Tooth Skeleton XXXV KAL 0964 F 25–30 0.7314 -12.5 -9.2 1307 (1290–1328) AAR-1148
F5660 Sandnes (W51) PM Skeleton XI KAL 929 M 35–40 0.7120 -12.6 -8.4 1297 (1271–1317) AAR-1143
F5661 Sandnes (W51) PM Skeleton K1 KAL 986 M 20–25 0.7176 -10.7 -10.5
F3880 Sandnes (W51) Enamel Skeleton X KAL-928 ? 20–25 0.7110 -13.1 -8.8 1408 (1390–1428) AAR-1144
F3881 Sandnes (W51) Enamel Skeleton XVII c KAL-936 ? 25–30 0.7096 -13.6 -5.8
F5662 Narsarsuaq (E149) PM Skelton 4(I) KAL 997 ? ? 0.7124 -11.2 -7.4 1290 (1280–1305) AAR-6147
F5663 Narsarsuaq (E149) PM Skeleton 6(I) KAL 0999 ? 15–20 0.7163 -11.4 -7.0 1290 (1270–1305) AAR-6149
F5664 Narsarsuaq (E149) Incisor Skeleton 3(I) KAL 996 ? 18/20–35 0.7124 -11.4 -6.2 1340–1390 (1320–1405) AAR-6146
F5665 Narsarsuaq (E149) PM Skeleton 7(I) KAL 1000 M 25–30 0.7185 -11.7 -11.3
F5666 Narsarsuaq (E149) LPM Skeleton 10(I) KAL 1001 M 18/20–35 0.7116 -12.8 -6.5 1389 (1312–1414) AAR-1264
F5667 Narsarsuaq (E149) Enamel Skeleton 4(II) KAL 1004 F 18/20–35 0.7116 -12.3 -7.2
F5668 Narsarsuaq (E149) Enamel Skeleton 9(II) KAL 1009 F >35 0.7114 -13.4 -6.6
F5669 Narsarsuaq (E149) LPM Skeleton 11(II) KAL 1011 F 20–25 0.7147 -13.2 -6.6
F5670 Narsarsuaq (E149) Enamel Skeleton b KAL 1134 ? Adult 0.7135 -12.1 -6.5
F5671 Narsarsuaq (E149) Enamel Skeleton 5(II) KAL 1005 F 18/20–35 0.7224 -11.4 -9.9
F3882 Narsarsuaq (E149) Tooth Skeleton 3(I) KAL 996 ? 18/20 –35 0.7134 -13.5 -4.4
F3883 Narsarsuaq (E149) Tooth Skeleton 6(I) KAL 999 ? 15-20 0.7132 -13.7 -6.2
F5672 Tjodhildes Church (E29a) UPM Skeleton 120 KAL 1084 ? ? 0.7092 -13.1 -4.9
F6463 Sandnes (W51) 7- Skeleton XII KAL 930 ? ? 0.7101 -11.9 -9.6
F5652 Sandnes (W51) PM Skeleton X KAL 928 F 20–25 0.7140 -12.3 -8.9
F5653 Sandnes (V51) PM Skeleton XV KAL 932 F 20–25 0.7211 -11.9 -9.7
F5654 Sandnes (W51) Tooth Skeleton XVIIc KAL 936 F 25–30 0.7122 -13.1 -6.6
F5656 Sandnes (W51) PM Skeleton XXII KAL 947 F 30–35 0.7258 -12.0 -9.0 1045 (1030–1116) AAR-5258
F5657 Sandnes (W51) Tooth Skeleton XXXI KAL 959 F 40–45 0.7158 -13.4 -6.5 1301 (1284–1320) AAR-1147
F5658 Sandnes (W51) Tooth Skeleton XXX KAL 960 F 40–45 0.7194 -12.0 -10.1 1301 (1282–1322) AAR-1145
F5659 Sandnes (W51) Tooth Skeleton XXXV KAL 0964 F 25–30 0.7314 -12.5 -9.2 1307 (1290–1328) AAR-1148
F5660 Sandnes (W51) PM Skeleton XI KAL 929 M 35–40 0.7120 -12.6 -8.4 1297 (1271–1317) AAR-1143
F5661 Sandnes (W51) PM Skeleton K1 KAL 986 M 20–25 0.7176 -10.7 -10.5
F3880 Sandnes (W51) Enamel Skeleton X KAL-928 ? 20–25 0.7110 -13.1 -8.8 1408 (1390–1428) AAR-1144
F3881 Sandnes (W51) Enamel Skeleton XVII c KAL-936 ? 25–30 0.7096 -13.6 -5.8
F5662 Narsarsuaq (E149) PM Skelton 4(I) KAL 997 ? ? 0.7124 -11.2 -7.4 1290 (1280–1305) AAR-6147
Journal of the North Atlantic
T.D. Price and J. Arneborg
2018 Special Volume 7
169
Table 1, continued.
Lab # Locality/ruin group Tooth DKNM_Id/NKA_Id KAL_Id Sex Age 87Sr/86Sr δ13C‰ δ18O‰ 14C Cal age (1 sigma) 14C Lab_Id
F5663 Narsarsuaq (E149) PM Skeleton 6(I) KAL 0999 ? 15–20 0.7163 -11.4 -7.0 1290 (1270–1305) AAR-6149
F5664 Narsarsuaq (E149) Incisor Skeleton 3(I) KAL 996 ? 18/20–35 0.7124 -11.4 -6.2 1340–1390 (1320–1405) AAR-6146
F5665 Narsarsuaq (E149) PM Skeleton 7(I) KAL 1000 M 25–30 0.7185 -11.7 -11.3
F5666 Narsarsuaq (E149) LPM Skeleton 10(I) KAL 1001 M 18/20–35 0.7116 -12.8 -6.5 1389 (1312–1414) AAR-1264
F5667 Narsarsuaq (E149) Enamel Skeleton 4(II) KAL 1004 F 18/20–35 0.7116 -12.3 -7.2
F5668 Narsarsuaq (E149) Enamel Skeleton 9(II) KAL 1009 F >35 0.7114 -13.4 -6.6
F5669 Narsarsuaq (E149) LPM Skeleton 11(II) KAL 1011 F 20–25 0.7147 -13.2 -6.6
F5670 Narsarsuaq (E149) Enamel Skeleton b KAL 1134 ? Adult 0.7135 -12.1 -6.5
F5671 Narsarsuaq (E149) Enamel Skeleton 5(II) KAL 1005 F 18/20–35 0.7224 -11.4 -9.9
F3882 Narsarsuaq (E149) Tooth Skeleton 3(I) KAL 996 ? 18/20 –35 0.7134 -13.5 -4.4
F3883 Narsarsuaq (E149) Tooth Skeleton 6(I) KAL 999 ? 15-20 0.7132 -13.7 -6.2
F5672 Tjodhildes Church (E29a) UPM Skeleton 120 KAL 1084 ? ? 0.7092 -13.1 -4.9
F5673 Tjodhildes Church (E29a) PM Skeleton F3 KAL 1091 ? 15-20 0.7089 -13.6 -5.8
F5674 Tjodhildes Church (E29a) PM Skeleton 2 KAL 1029 ? 18/20–35 0.7075 -14.3 -8.3
F5675 Tjodhildes Church (E29a) UI Skeleton 41 KAL 1043 M 35–40 0.7090 -13.8 -7.6 1175 (1061–1226) AAR-1569
F5676 Tjodhildes Church (E29a) Molar Skeleton 41 KAL 1043 M 18/20–35 0.7084
F5677 Tjodhildes Church (E29a) UPM Skeleton 66 KAL 1054 F 18/20–35 0.7087 -14.2 -7.7 985 (909–1017) AAR-1571
F5678 Tjodhildes Church (E29a) Enamel Skeleton 86 KAL 1070 F >35 0.7117 -11.4 -9.5
F5679 Tjodhildes Church (E29a) UPM Skeleton 124 KAL 1654 F 20-25 0.7093 -10.8 -3.4
F5680 Tjodhildes Church (E29a) PM Skeleton 125 KAL 1655 ? Adult 0.7074 -14.3 -7.2
F3884 Tjodhildes Church (E29a) Tooth Skeleton 62 KAL 1052 F 18/20–35 0.7107 -14.6 -3.5
F3885 Tjodhildes Church (E29a) Tooth Skeleton 80 KAL 1064 ? ? 0.7089 -13.7 -3.7
F3886 Tjodhildes Church (E29a) Tooth Skeleton 118 KAL 1083 ? ? 0.7111 -11.8 -8.0
F5221 Innoqquasaq (E64) Molar KNK2655#71 M? Ca. 50 0.7088 -14.8 -5.6
F5222 Innoqquasaq (E64) Molar KNK2655#72 F 18–20 år 0.7118 -14.5 -7.0 1051-1152 AAR-12967
F5223 Innoqquasaq (E64) Molar KNK2655#73 m 55+ 0.7089 -15.2 -6.4 967-1067 AAR-12968
F5224 Innoqquasaq (E64) Molar KNK2655#52 F 30 0.7083 -14.4 -6.7
F5225 Innoqquasaq (E64) Molar KNK2655#70 F 18 - 20 0.7079 -15.9 -6.4
F5226 Innoqquasaq (E64) Molar KNK2655#78 M Ca. 40 år 0.7081 -15.0 -7.0 973-1052 AAR-12969
F5227 Innoqquasaq (E64) Molar KNK2655#68 ? 6-7 0.7191 -13.9 -7.9
F5228 Innoqquasaq (E64) Molar KNK2655#69 F 30–36 0.7090 -15.3 -6.2
F3887 Qoornoq- Nuup Kangerlua Tooth House 3/ske. 16 KAL 1441 ? ? 0.7106 -9.7 -8.0
64V1-I-009
F3888 Uunartoq- Uunartoq Fjord Tooth Grave 8 A KAL 1460 ? ? 0.7100 -11.2 -6.9
60V2-IV-001
F3889 Niaqussat 64V2-III-022 Tooth Skeleton 4 KAL 4031 ? ? 0.7106 -10.4 -6.7
F1852 Igaliku E48) Enamel KNK221x11 ? ? 0.7122
F1854 Qorlortoq (E35) Enamel KNK223x14 ? ? 0.7069
F1855 Qorlortoq (E35) Enamel KNK223x15 ? ? 0.7095
Journal of the North Atlantic
T.D. Price and J. Arneborg
2018 Special Volume 7
170
our sample and they exhibit a much higher average
87Sr/86Sr than the males as well as a higher standard
deviation. A bar graph of ranked 87Sr/86Sr values
provides a visual look at these differences (Fig.
7). The highest values generally come from female
burials at Sandnes in the Western Settlement, suggesting
these are local Greenland women. Values
below 0.7092 are likely individuals who arrived
from Iceland and include both males and females.
That boundary incorporates half the males and less
than one-third of the females, suggesting that males
were more likely to be immigrants to Greenland
and often from Iceland. The women may have come
in smaller numbers.
A plot of all the Greenland human tooth enamel
isotope ratios for strontium vs. oxygen shows 2
groups of individuals (Fig. 8). There is a large
and varied group between of -10.0‰ and -3.0‰,
and 87Sr/86Sr values of 0.706 and ~0.715. A second
group is rather linear with δ18O values around
-10.0‰ and 87Sr/86Sr values > 0.715. In this graph,
the values from the Western Settlement (i.e., the
site of Sandnes) are shown in yellow. Five of the 7
values in the second group are individuals from the
Western Settlement, and their δ18O is more negative
as would be expected. The strontium isotope values
also fit with the higher ratios seen in the region of the
Western Settlement.
Also of interest in this plot are the Sandnes samples
not in the second cluster and the Eastern Settlement
samples that are. These samples include 2
burials from Narsarsuaq (E149) (skeletons 5(II) and
7(I)) with ratios that fit with the Western Settlement
and 7 burials from Sandnes (W51) (skeletons X, XI,
XII, XVIIc, XVIIIc and XXXI) with ratios that fit
with the Eastern Settlement. In all likelihood these
samples represent individuals born in one settlement
and buried in the other. The strontium isotope ratios
are too high for these individuals to have originated
in Iceland. It is possible that some of these individuals
were born in Norway or the northern British
Isles, but only rarely are human values above 0.718
observed in Viking Age Norway or Britain. It may
also be the case for the Western Settlement samples
with lower strontium isotope ratios that diets with
a predominance of marine foods may have lowered
expected enamel values toward the ratio for seawater.
The role of marine foods in the diet can be
estimated from δ13C values in collagen and enamel
carbonate, and both of these data will be considered
in due course.
Carbon isotope ratios for 50 enamel carbonate
samples from Greenland average -13.01‰ ± 1.46,
Figure 6. Kernel Density Plot of δ18O values for 50 human
enamel samples from Greenland. Values span from -3.07
to -9.85.
Figure 7. Bar graph of ranked 87Sr/86Sr values in tooth
enamel for males (left) and females from Greenland.
Figure 8. Scatterplot of 87Sr/86Sr and δ18O values for all
human samples from Greenland.
Table 2. Strontium isotope ratios in males and females on
Greenland
.
Sex n 87Sr/86Sr sd min max
M 12 0.7109 0.0035 0.7081 0.7185
F 25 0.7133 0.0062 0.7075 0.7314
-90%
-92%
-94%
-96%
-98%
-100%
Journal of the North Atlantic
T.D. Price and J. Arneborg
2018 Special Volume 7
171
In general, δ13C values for the individuals from the
Western Settlement fall in the more positive half of
the graph and indicate a more marine diet. Similar
differences as those seen in the graph of 87Sr/86Sr and
δ18O values also appear in this graph (Figs. 8, 10),
with some individuals buried in the Eastern Settlement
exhibiting the high strontium isotope ratios
and δ13C values comparable with the samples from
the Western Settlement, corroborating the likelihood
that these individuals were born in the Western Settlement
and moved to the Eastern. These individuals
include both males and females.
Additional information of importance in the
consideration of past diet and mobility comes
from carbon and nitrogen isotope ratios in bone
collagen in the human remains from these sites
(Arneborg et al. 2012a, Nelson et al. 2012a). This
information provides an indication of the role of
marine foods in adult diets and evidence of dietary
differences among individuals. Data from 3 of
the sites we have investigated on Greenland are
summarized in Table 3 (Arneborg et al. 2012c).
Several points are to be noted. Individuals from
Sandnes in the Western Settlement have relatively
positive carbon isotope ratios and higher nitrogen
isotope ratios compared to most of the other sites.
Narsarsuaq (E149) has a much more positive carbon
and a very high nitrogen isotope ratio compared
to E29a, Tjodhildes Church, and is more
similar to W51 Sandnes. The high nitrogen and
more positive carbon isotope values suggest that
marine foods were probably predominant at both
Sandnes and Narsarsuaq, while terrestrial foods,
with a a minimum and maximum of from -10.8‰
to -14.6‰, respectively. A kernel density plot of the
distribution of values is shown in Figure 9 and reveals
little other than the rather regular distribution
of the data with a slight right skew. The single broad
mode levels off around -13.0‰ and declines quickly
after 14.6‰.
A scatter plot of 87Sr/86Sr and δ13C values for
all human enamel samples from Greenland is also
informative (Fig. 10). Two clusters are identifiable
in this plot, a vertical cluster with most of the
samples around 87Sr/86Sr value of 0.710 on the yaxis
and δ13C ranging between -10‰ and -16‰. A
second linear cluster runs horizontally from 87Sr/86Sr
Sr values of 0.715 to 0.731 around the -10 to -12
δ13C values. Again, the higher values, above 0.715,
are largely from the Western Settlement (red dots).
Figure 9. Kernel density plot of δ13C values for all human
samples from Greenland. Values span from -10.78‰ to
-14.62‰.
Figure 10. Scatterplot of 87Sr/86Sr and δ13C values for all
human enamel samples from Greenland.
Table 3. Carbon and nitrogen isotope ratios in bone collagen from
4 sites in Greenland (Nelson et al. 2012a).
Site δ13C‰ δ15N‰
E29a, Tjodhildes Church mean -18.13 5.30
stdev 0.68 6.30
min -18.9 0
max -16.8 12.78
count 9 9
E149, Narsarsuaq mean -15.70 16.41
stdev 0.74 0.97
min -17.25 13.86
max -14.21 18.64
count 24 24
W51, Sandnes mean -16.31 15.08
stdev 0.68 1.21
min -17.6 12.12
max -14.85 17.09
count 34 34
E64, Innoqquasaq mean -18.71 na
stdev 10.59
min -26.00
max -16.42
count 5
-96%
-97%
-98%
-99%
-100%
Journal of the North Atlantic
T.D. Price and J. Arneborg
2018 Special Volume 7
172
and she had a small church built for prayers at Brattahlid
(Magnusson and Pálsson 1965) (Fig. 11). That
is why the church was named Tjodhildes church by
the archaeologists when first discovered (Meldgaard
1982).
All our samples come from the remarkable,
small Tjodhildes church. Ten radiocarbon dates from
burials in the churchyard indicate the cemetery was
used between AD 900 and 1225 (Arneborg et al.
2012b:13, Lynnerup 1998). Today, only the remains
of turf wall are preserved; originally, they may have
been protective walls surrounding a wooden building.
On the inside, the building was ~3.5 m long and
~2 meter wide. There are no traces of an enclosing
wall or ditch, but the position of the burials indicates
that the churchyard was circular or oval (Fig. 12).
The remains of 155 humans were exhumed from
the churchyard, all lying on their backs facing east;
their arms were placed along the body in an arm
position, which dominated from ca. A.D. 1000 to
ca.1250 (Kieffer-Olsen 1993:78). The layout of
the church and the churchyard supports the early
dating. Reused graves support the argument that the
graveyard was used for a relatively long period, and
we may expect that both new immigrants and later
generations of Greenland-born individuals were
buried here.
The samples from E29a were a mix of male
and female and were young adults in age (Table
1). Two of the sampled skeletons have been raespecially
plants, were more commonly eaten at
Tjodhildes Church.
Archaeological Sites and Isotopic Results
In this section, the isotopic data from each
archaeological site that was sampled is discussed
and then compared with one another in the following
section.
E29a, Tjodhildes Church/Brattahlid/Qassiarsuk
The ruins at Qassiarsuk have been identified
as Eric the Red’s farm known as Brattahlid in the
Sagas (Arneborg 2010, Edwards et al. 2010). The
farm is situated on the broad Qassiarsuk plain
close to the head of Tunulliarfik fjord. Erik’s farm
developed into one of the largest in Norse Greenland,
and the Qassiarsuk plain is one of the more
settled locales. More than 60 ruins—including
dwellings, byres, stables, barns, storehouses,
workshops, and enclosures—are scattered over the
plain (Arneborg 2006).
The site holds 2 churches. A large stone church
dated after AD 1250–1300 and built on top of an
11–12th-century church. The other Tjodhildes church
lies a short distance from the 2 later churches and
is thought to be the first church on the site, built
contemporary with the initial settlement. According
to Erik’s Saga, Erik the Red’s wife Tjodhild accepted
Christianity shortly after arrival on Greenland
Figure 11. A reconstruction of the small structure known as Tojdhildes church on Greenland.
Journal of the North Atlantic
T.D. Price and J. Arneborg
2018 Special Volume 7
173
Figure 12. The church, churchyard, and burials at Tojdhildes church, Greenland.
Journal of the North Atlantic
T.D. Price and J. Arneborg
2018 Special Volume 7
174
which should provide a sense of the range of local
bioavailable strontium isotope ratios. At the same
time, human consumption of marine foods, and terrestrial
food and fodder affected by sea spray and
rainfall, would reduce the 87Sr/86Sr value in tooth
enamel toward 0.7092.
Comparison with the site of E149, Narsarsuaq,
also in the Eastern Settlement, may be useful.
The samples from this site date from the 13th
to the 15th century and do not appear to include
any individuals from Iceland (Arneborg et al
2012b:23). The 87Sr/86Sr values for human tooth
enamel at Narsarsuaq vary from 0.7114 to 0.7224.
All but 1 of the individuals from Tjodhildes
Church have strontium ratio values below 0.7114.
It is also the case that marine foods in the diet increased
over time in Greenland so that we might
expect more dampening of high 87Sr/86Sr values
at Narsarsuaq, compared to those at Tjodhildes
Church. That is indeed the case as indicated by
the collagen carbon and nitrogen isotope ratios
from these sites (Table 2). Given this information,
it is tempting to suggest that the several higher
87Sr/86Sr values at Tjodhildes Church may belong
to individuals from Norway or the northern parts
of Britain or Ireland.
We can examine this hypothesis in terms of the
results from oxygen and carbon isotopes in enamel.
The mean value δ13C it was -13.24‰ ± 1.32 with
with a min–max = -14.62‰ to -10.78‰. Comparison
of the enamel carbon isotope ratios from Tjodhildes
Church with the rest of Greenland is informative.
The mean value for the individuals from Tjodhildes
Church is very close to the mean for Greenland and
toward the more terrestrial end of the dietary range
from marine to terrestrial. Thus, it seems unlikely
that marine foods would have a substantial dampening
effect on the 87Sr/86Sr values for these persons.
Oxygen isotope ratios are also informative with
regard to the origins of the individuals found in the
churchyard at Tjodhildes Church. δ18O values for
all of the individuals from the Eastern Settlement
average -6.71‰ ±1.7, as noted earlier. The oxygen
isotope ratios for Tjodhildes Church show a wide
variation from -9.48‰ to -3.41‰ with a mean of
-6.32‰ ± 2.16. For comparison, oxygen isotopes
from human tooth enamel for 84 Iceland burials
that appear to be local (i.e., 87Sr/86Sr < 0.7092)
average -4.94‰ ± 0.87, with a range between
-2.23‰ and -6.94‰ (Price and Gestsdóttir 2018
[this volume]).
A scatter plot of oxygen vs. strontium isotope
ratios from the Tjodhildes churchyard is useful (Fig.
14). Both the low (Burial 125) and high (Burial 118)
diocarbon dated. Both samples are of females,
one 25–30 years old dated A.D. 909–1017 (±1 sd)
(AAR-1571), and the other one was 35–40 years
old and dated 1061–1226 (±1 sd) (AAR-1569) (Arneborg
et al. 2012b:13) A total of 12 samples were
measured for strontium isotopes and 11 for apatite
carbon and oxygen. The mean 87Sr/86Sr value for
the samples was 0.7092 ± 0.0013 with a min–max
= 0.7073 to 0.7117. These values, however, mean
little without context and comparison. A bar graph
(Fig. 13) of the 87Sr/86Sr values shows an interesting
distribution with 2 similarly low values, 7 midlevel
values, and 3 high values. The 2 low values
fit well with the known range of 87Sr/86Sr from
Iceland (Price and Gestsdóttir 2018 [this volume]).
The next five values are also likely from Iceland as
they fall within the range of baseline values there
and below the expected lower limit of 0.7092 for
Greenland. Iceland as the homeland for these individuals
fits well with the early date for the site from
the time of the initial settlement. These individuals
could be among the first colonists. There are also
2 samples of cattle from E29, the Brattahlid farm,
with values of 0.7064 and 0.7074 that also suggest
a place of origin in Iceland.
It is important to remember the 87Sr/86Sr value
of 0.7092, which is the highest possible value
for individuals born and raised in Iceland and
approximately the lowest value for those raised
on Greenland (shown as a dotted line on Fig. 13).
The last 5 individuals from Tjodhildes Church have
87Sr/86Sr values above this limit and were not raised
on Iceland.
It is important to determine the range of human
values on Greenland for locals and nonlocals.
Cattle raised in the Eastern Settlement on
Greenland have values varyin from 0.7115–0.7160,
Figure 13. Bar graph of ranked 87Sr/86Sr values from the
burials at E29a, Tjodhildes Church. Red = female, blue =
male, gray = unknown. The dashed line marks the value
of seawater, 0.7092.
Journal of the North Atlantic
T.D. Price and J. Arneborg
2018 Special Volume 7
175
Nevertheless, burials beneath the walls indicate
that the church had one or more predecessors
of unknown age (Vebæk 1991:25). Radiocarbon
dates of excavated skeletons from the churchyard
fall within the time period from the middle of the
1200’s to the first decades of the 1400’s (Arneborg
et al. 2012b:23).
Twelve samples of skeletons from the
churchyard at E149 are included in this study. Six
samples are from what the excavator C.L. Vebæk
(1991) called “Grave field I” Here 2 layers of
burials were excavated and the skeletons have
later been radiocarbon dated to the 14th century
(Arneborg et al. 2012b:23, Lynnerup 1998). Three
samples are from “grave field 2” where only the
upper layer of burials was excavated, and most
probably they are from the same period as the burials
in “grave field 1” (Table 1).
The 12 samples were measured for strontium,
carbon, and oxygen isotope ratios. The mean value
for 87Sr/86Sr was 0.7143 ± 0.0033 with a min–max
= 0.7114–0.7224. All of the samples have values
above 0.7092 and cannot have originated
in Iceland. A bar graph of the distribution of
rank-ordered values is shown in Figure 15 and
documents the substantial variation in 87Sr/86Sr
values in these samples.
δ18O values average -7.2‰ ± 1.8 and exhibit an
extremely wide variation from -4.4‰ to -11.3‰.
The wide range of values suggests that some of the
individuals buried at this site were non-local. A plot
of 87Sr/86Sr vs. δ18O values (Fig. 16) confirms this
impression. Two individuals stand out distinctly
with the highest 87Sr/86Sr and the most negative
δ18O values. It seems very likely that these 2 individuals
are originally from the Western Settlement.
The third highest 87Sr/86Sr value has an oxygen isotope
ratio that fits well with the rest of the samples
from Narsarsuaq and probably indicates inclusion
among the locals. Oxygen isotope values average
strontium isotope ratios have very negative δ18O
values. These more negative values should come from
more northerly areas of origin and may suggest, for
example, that the 2 highest strontium isotope ratios
from this churchyard (Burials 86 and 118) were individuals
from the Western Settlement. The lower 2
strontium isotope values with more negative oxygen
are puzzling, however, and do not fit with baselines in
known areas. The strontium isotope ratio points to an
Icelandic origin, but the oxygen isotope ratio does not
fit. Iceland oxygen isotope ratios measured in human
tooth enamel have a mean value of -4.7‰ ± 1.1 and
both of these values are more negative than -8.0‰.
Interpretation of these 2 low strontium, more negative
oxygen ratios is difficult.
E149, Narsarsuaq
Ruin group E149 at Narsarsuaq in Uunartoq fjord
has been identified as the convent Nonne Kloster
mentioned by Ívar Bárðarson in his Greenland
Description from the later part of the 1300’s (Jónsson
1930:23, Vebæk 1991). The identification is entirely
based on the interpretation of the written sources.
From an archaeological point of view, the farm at
Narsarsuaq does not differ significantly from other
farms in the region. This ruin group was one of the
larger farms in the Eastern Settlement, with more
than 20 structures including the single-room church,
residence, byre, stable, barns, and other outhouses.
The farm is situated in the southern part of the
Eastern Settlement, and the potential for pastoral
farming is not the best compared to the central area
around Qassiarsuk/Brattahlid and Igaliku/Gardar.
A possible pilgrimage route to the warm springs on
the nearby island of Uunartoq may have provided an
economic basis for the farm.
Single-room churches in Greenland are dated
to post ca. AD 1250–1300 (Roussell 1941).
Figure 15. Bar graph of ranked 87Sr/86Sr values from the
burials at E149, Narsarsuaq. Red = female, blue = male,
gray = unknown.
Figure 14. Scatterplot of Tjodhildes Church strontium and
oxygen isotope ratios. Red = female, blue = male, gray =
unknown.
Journal of the North Atlantic
T.D. Price and J. Arneborg
2018 Special Volume 7
176
-6.7‰ ± 1.7 for 35 samples of human enamel from
the Eastern Settlement. There is 1 individual with
a less negative δ18O value that might be non-local,
although the strontium isotope ratio fits well in the
local group. The less negative oxygen value points
to a southerly origin, but at the same time is not
completely out of the local range.
The δ13C values average -12.3‰ ± 0.9, with a
narrow degree of variation from -11.2‰ to -13.7‰.
This is a narrow span of values suggesting similar
diets for the individuals in the cemetery at Narsarsuaq.
A plot of 87Sr/86Sr vs. δ13C values (Fig. 17)
provides more information. The same individuals
with high strontium isotope ratios also have a
more positive carbon isotope ratio suggesting more
marine foods in the diet and reiterating the likelihood
that at least the two highest strontium values
are non-local. There are also 2 individuals with
87Sr/86Sr values that are more average and marine
carbon isotope ratios that are more positive. It is
tempting to propose that the 2 pairs of samples with
very similar 87Sr/86Sr vs. δ13C values in the graph
may well have belonged to the same households,
but we cannot prove such an assertion.
E64, Innoqquasaq/Vatnahverfi
For the study of the people of the Vatnahverfi
region in the Eastern Settlement, we measured
strontium, carbon, and oxygen isotopes in the tooth
enamel from 9 burials from the site of Innoqquasaq
in Igaliku Fjord. The church at E64 is very similar
to the other small churches—E29a, E35 and E48—
in this study. It is built of stones and turf. The circular
churchyard surrounding the church measured
~20 m across.
Twelve ruins have been recorded on the site
including a dwelling, byre, stable, barn, and
other outhouses. Like the churches at Igaliku E48,
Qassiarsuk Tjodhildes Church E29a, and E35
in Itinnera, the landnam farm at E64 lost its
church rights and social position during the 1200s,
presumably to the nearby farm E66, in Igaliku
Kujalleq, that developed into one of the largest
manors in the Eastern Settlement. When the E64
farm was abandoned is unknown (Arneborg 2012).
Archaeological excavations in the churchyard
in 2008 and 2010 exposed in situ single graves,
several reburials, and a common grave containing
15 individuals (Fig. 18). Arm positions of
the dead and radiocarbon dates indicate that the
churchyard was established immediately after
settlement and was in use until about AD 1200.
Three samples are from the common grave. Two
samples are from immediately above the common
grave, and the remaining 4 are from individual
burials. Radiocarbon dates of skeletons in the
common grave and of the skeletons just above the
grave indicate a date from before AD 1000.
The results of the isotopic analyses of the 9
samples from E64, Innoqquasaq, are provided in
Table 1) along with other information about the
burials. The human samples from E64 have a mean
strontium isotope ratio of 0.7101 ± 0.0036, with
a minimum value of 0.7079 and a maximum of
0.7191. Comparison of the 9 human 87Sr/86Sr values
from E64 with the archaeological fauna from the
Eastern Settlement reveals a significant difference.
The mean value of the local bioavailable values
from the fauna is 0.7132 while the mean value for
Figure 17. Scatterplot of 87Sr/86Sr and δ13C values for human
enamel from E149, Narsarsuaq.
Figure 16. Scatterplot of 87Sr/86Sr and δ18O values for human
enamel from E149, Narsarsuaq.
Journal of the North Atlantic
T.D. Price and J. Arneborg
2018 Special Volume 7
177
the 9 human samples is 0. 7101. A bar graph of
these values in ranked order reveals 2 samples with
significantly higher values than the remaining 7
(Fig. 19).
It is important to remember that E64 is one
of the earliest sites on Greenland, established at
the time of initial settlement. The most obvious
interpretation of the 7 values below 0.709 is that
these individuals came originally from Iceland and
were among the first settlers of Greenland. Isotope
values below 0.709 are uncommon on Greenland,
in Norway, and the older terrains of the northern
UK and Ireland.
The 2 higher values are also of interest. Burial
68 is a 6–7-year-old child. Burial 72 is an ~14 yearold
female. Because of the very high 87Sr/86Sr value
(0.7191) observed in Burial 68, it can easily be argued
that this child was born on Greenland and the isotope
ratio reflects the bioavailable values of the Eastern
Settlement. This 87Sr/86Sr value is in fact one of the
two highest human values observed anywhere in the
Eastern Settlement. This child probably consumed a
significant proportion of seafood in its diet, a pattern
confirmed by the fact that this individual has the
least negative apatite carbon isotope ratio of the nine
individuals from E64 (Fig. 20).
Apatite carbon isotope ratios in the E64 human
sample have a mean of -14.9‰ ± 0.58, with a
minimum of -15.9‰ and a maximum of -13.9‰.
A plot of 87Sr/86Sr values vs. δ13C for human tooth
Figure 19. Bar graph of ranked 87Sr/86Sr values in human
tooth enamel from E64, Innoqquasaq. Red = female; blue
= male; gray = unknown.
Figure 18. The common grave in the churchyard at the site of E64, Innoqquasaq, Greenland.
Journal of the North Atlantic
T.D. Price and J. Arneborg
2018 Special Volume 7
178
from Iceland (-4.7‰) and Denmark (-4.3‰) are
from local individuals defined by strontium isotope
analysis. Human enamel from Norway has an
average δ18O value of -4.4‰, and the Faroe Islands
have an average of -3.4‰.
Carbonate oxygen isotope ratios in the E64
human sample have a mean δ18O of -6.6‰ ± 0.65
with a minimum value of -7.9‰ and a maximum
of -5.6‰. Strontium and oxygen isotope ratios are
plotted for the E64 individuals in Figure 21. Oxygen
isotopes also show a significantly more negative
value in Burial 68, again contrasting Greenland vs.
Iceland as place of origin. The δ18O value for Burial
72 is within the range for Iceland, but would also
fit well in western Norway. The combination of
strontium, carbon, and oxygen isotopes, however, in
this individual point toward Greenland as the place
of origin. The difference in 87Sr/86Sr values between
burials 68 and 72 is pronounced, but falls within
the range observed for local Greenlanders (Fig. 10).
The wide range of 87Sr/86Sr values is likely due to
dietary differences, particularly the proportion of
seafood in the diet. Arneborg et al. (1999, 2012a)
have demonstrated that the role of seafood in human
diets increases over time in Greenland. Diets with
more marine input would produce 87Sr/86Sr values
in bone and enamel that were lower than expected
from terrestrial baseline data and closer to 0.7092,
the value of seawater and marine foods.
E35, Qorlortup Itinnera
The site of E35 is situated inland in the Qorlortoq
valley north of Qassiarsuk and ~4 km from the
coast. The small site contains a small, stone and
turf church and churchyard in addition to 6 structures
including a dwelling, byre/stable, barn, and
workshops. The churchyard was circular and ~17 m
in diameter. The layout and design of the church and
churchyard, the positioning of the deceased in the
graves, and 4 radiocarbon dates of skeleton from the
enamel shows that the 2 individuals with higher
strontium isotope ratios are also outliers in terms
of carbon (Fig. 19). Burial 68 has the least negative
carbon isotope ratio of the group, reflecting a more
marine diet in early childhood. Burial 72 also has
a negative δ13C value, although it does fall within
the Iceland range of values. The 7 individuals from
Iceland have carbon isotope ratios in tooth enamel
from -14.4‰ to -15.89‰, reflecting slightly
varying proportions of marine foods in the diet of
these individuals.
In addition to the enamel apatite carbon isotope
ratios, there are 3 bone collagen carbon isotope
ratios obtained along with the radiocarbon dates
for these samples. Burial 78 had a δ13C value of
-19.7‰, Burial 74 was -18.3‰, and Burial 72
had the most positive of the 3 values at -18.1‰,
but again within the range of the Iceland values.
Thus, Burial 72 has an 87Sr/86Sr value that cannot
be from Iceland, and δ13C values that fit with both
Greenlanders and Icelanders.
In spite of the poorly understood variability in
oxygen isotopes, there is useful information that
may provide additional information on human
mobility in the past. We have measured δ18O in a
large number of samples from various places in
the North Atlantic. These data are summarized in
Table 4. There is a pronounced difference between
Greenland and the other countries to the south
and east. The average value for all human enamel
samples from Greenland is -7.7‰. Average values
Figur 21. Strontium vs. oxygen apatite isotope ratios for
human burials from Innoqquasaq.
Table 4. Means and 1 standard deviation for δ18O in samples of
human enamel from various areas in the North Atlantic.
Place Local n Average sd
Denmark <0.711 71 -4.3 0.7
Norway -- 15 -4.4 1.2
Faroe Islands -- 11 -3.4 0.7
Iceland <0.709 10 -4.7 1.1
Greenland >0.709 35 -7.7 1.9
Figure 20. Scatter plot of 87Sr/86Sr vs. δ13C for the nine
burials from E64, Innoqquasaq.
Journal of the North Atlantic
T.D. Price and J. Arneborg
2018 Special Volume 7
179
W51, Sandnes/Kilaarsarfik
To the north in the Western Settlement, the
church at W51 Kilaarsarfik, identified as the Norse
site of Sandnes, is the only Western Settlement
church included in this study. Radiocarbon dates
and artifact finds indicate that the site was settled
from the landnam ca. AD 1000 to depopulation ca.
1400 (Arneborg et al. 2012b). The farm is situated
on a lush plain at the head of the Ameralik/Ameralla
fjords. The settlement includes only 7 recorded ruins,
but several houses may have been lost to erosion
at the fjord’s edge. The high-status farm at Sandnes
was not large compared to Eastern Settlement farms.
The church has a Romanesque ground plan
indicating an 11th–12th century date. The building
was of stone and turf and, like the church at the Eastern
Settlement site of Narsarsuaq (E149), it lacked
a western end. No predecessors have been recorded,
though some rebuilding seems to have been done
(Roussell 1936). We may have Christian burial activities
on this spot from the beginning of settlement.
The churchyard at Sandnes was excavated by Aage
Roussell (1936) in the 1930s. Later radiocarbon dating
of selected skeletons from the excavations indicate
they are from the time period AD 1021–1428 (±1 sd)
(Arneborg et al. 2012b:30). Samples from 12 skeletons
are included in this study; of those, 6 have been radiocarbon
dated to 1275–1428 (±1 sd) (Table 1).
A total of 11 teeth were sampled for strontium,
oxygen, and carbon isotopes. The average 87Sr/86Sr
was 0.717 ± 0.066. A bar graph of these values in
ranked order is shown in Figure 22. Although there
is a wide range of values in the distribution with a
min–max = 0.7101–0.7314, it is unlikely that any
of the individuals buried at Sandnes came from
Iceland. Four radiocarbon-dated skeletons from the
individuals we have sampled date from the later part
of the 13th and the 14th centuries AD, suggesting that
these persons are a number of generations removed
from the first settlers.
In addition to the human samples there are 6
samples of fauna from the site that can contribute to
our understanding of bioavailable strontium isotope
baselines in this area (Table 6). A caribou and 1 hare
have the highest ratios we have recorded on Greenland
and presumably came from inland or sheltered
parts of the region. The remaining animals have values
between 0.7111 and 0.7197 that fit well with the
majority of the human samples from Sandnes. Three
hare have the lowest values for all the hare measured
from the Western Settlement (Fig. 5) and presumably
came from the coastal zone where sea spray
and rainfall added substantial amounts of marine
strontium to the vegetation.
graves date the church and churchyard to the early
settlement period. The farm likely lost its church
rights during the 1200s, supposedly to the church at
nearby Brattahlid. The date of abandonment for the
farm is unknown.
Three samples (2 humans KNK 223x14 and KNK
223x15 and 1 cow KNK 223x1) were measured for
strontium isotopes and 2 for carbon and oxygen (Table
5). The low strontium isotope ratios of 3 of the
individuals point to Iceland as their place of origin,
while the third individual has strontium and oxygen
isotopes that are more similar to what we expect for
the Eastern Settlement of Greenland. There is also 1
cow sample (KNK 223x1) with an 87Sr/86Sr value of
0.7065, indicating that the animal probably came to
Greenland from Iceland, like 2 of the humans.
E48, Igaliku
Moving from Tunulliarfik fjord to Igaliku fjord,
at the head of the fjord we find another small inland
church, situated at a small farm (ruin group E48), a
15-minute walk from the small community of Igaliku,
where formerly the Greenland bishops lived.
Igaliku was then the Norse farm known as Gardar
(ruin group E47).
Typologically, the church is slightly more recent
than Tjodhildes church. It is of turf and stone and measures
~6 m x 4.5 m on the outside. Besides the church,
the E48 farm includes 11 structures among which are a
dwelling, a byre/barn complex, and other outhouses. It
is not know when the farm was abandoned.
The surrounding churchyard is 4-sided with
rounded corners and measures ~19 x 17.5 m on
the outside. A small test trench excavated in the
churchyard in 2001 revealed a few graves close to
the church. Positioning of the dead and radiocarbon
dates indicate the cemetery dates to the early 12th
century. Only 1 sample from this site was measured
for strontium, oxygen, and carbon isotopes. The
sample is from grave 3 that cuts older grave number
4. Charcoal of local wood from grave 3 has been radiocarbon
dated to AD 1036–1209 (± 1 sd); however,
we cannot for certain rule out the possibility that
the charcoal is from grave 4. The skeleton in grave 4
is dated 1042-1169 (± 1 sd), with an 87Sr/86Sr value
of 0.7122, δ18O of -7.64‰, and δ13C of -14.11‰.
These values are typical for individuals born in the
Eastern Settlement of Greenland.
Table 5. Isotope ratios from human tooth enamel from E35,
Qorlortup Itinnera.
87Sr/86Sr δ13C δ18O
0.7069 -13.7 -4.9
0.7095 -14.8 -7.8
0.7067
Journal of the North Atlantic
T.D. Price and J. Arneborg
2018 Special Volume 7
180
the burials at Sandnes and suggests that these individuals
may have been from different parts of the
Western Settlement, or at least consumed foods
from isotopically different areas.
Inuit Samples
Three samples from Inuit burials have been
included in our investigations, 1 from the Eastern
Settlement and 2 from the Western Settlement area.
These burials come from Inuit sites, and all date after
the Norse abandonment of Greenland and before recolonization
in 1721. The 18th-Century Inuit settlement
of Niaquusat (Gulløv 1997) is in the Ameralla
fjord, in the Western Settlement area on the same
location as Norse farm, W48. Qoornoq in Nuuk fjord
is another Inuit settlement, also in the Western Settlement
area. The skeleton was found on the platform in
house 3. The site has been occupied in several periods
perhaps already from the 15th century. The youngest
ruins on the sites are from the 18th century. House 3
with its contents has not been dated; it is, however,
thought to belong to the older settlement period (15th–
16th centuries AD) (Gulløv 1997). The large Inuit settlement
in Uunartoq fjord in the Eastern Settlement is
The wide range of human values presumably
reflects dietary differences among the buried
inhabitants of Sandnes, with high 87Sr/86Sr terrestrial
diets dampened by the intake of marine foods among
the individuals with lower 87Sr/86Sr values. Several
of the burials were radiocarbon dated, and collagen
carbon and nitrogen isotope ratios were reported
along with the dates. These 6 samples averaged
-15.83‰ ± 0.65 and 15.4‰ ± 0.25, for carbon and
nitrogen, respectively, indicating a relatively high
proportion of marine foods in the diet. The 3 highest
87Sr/86Sr human values (Burials Sk. XXXV, Sk.
XXII, and Sk. XV) are puzzling because they don’t
appear to have been dampened as much by the intake
of marine isotope ratios, although their collagen
carbon isotope ratios are very similar to the other
samples in the group.
The apatite carbon isotope ratios from the tooth
enamel tend to confirm this interpretation. δ13C
values had a mean of -12.26‰ ± 0.85, with a min–
max = -10.71‰ to -13.35‰. Sandnes has the most
positive δ13Cen of the 4 large sites that were sampled
on Greenland, indicating more marine foods in the
diet. A scatterplot of δ13C vs. 87Sr/86Sr (Fig. 23)
shows the relationship between these 2 ratios.
Values for δ18O averaged -9.15 ‰ ± 1.2 with
with a min–max = -6.52‰ to -10.46‰. A scatter
plot of δ18O vs. 87Sr/86Sr (Fig. 24) emphasizes the
wide high degree of variation in both ratios among
Figure 23. Scatter plot of 87Sr/86Sr vs. δ13C for the 11 burials
from V51, Sandnes.
Figure 24. Scatter plot of 87Sr/86Sr vs. δ18O for the 11
samples from V51, Sandnes.
Table 6. 87Sr/86Sr values for fauna from V51, Sandnes.
Species 87Sr/86Sr value
Caribou 0.7611
Cow 0.7151
Hare 0.7175
Hare 0.7111
Hare 0.7197
Hare 0.7579
Figure 22. Bar graph of ranked 87Sr/86Sr values in human
tooth enamel from W51, Sandnes. Red = female; blue =
male; gray = unknown.
Journal of the North Atlantic
T.D. Price and J. Arneborg
2018 Special Volume 7
181
nent in the diet. The effects of this predominantly
marine diet can be seen in the 87Sr/86Sr values; all
are close to the value of seawater—Niaquusat
(0.7106), Qoornoq (0.7106), and Uunartoq (0.7010).
The δ18O values are highest at Qoornoq and lowest
at Niaquusat, both sites in the Western Settlement.
The value for Uunartoq in the Eastern Settlement is
closer to the value from Niaquusat; that finding is
unexpected and may reflect a different place of birth.
In sum, the Inuit data provides a baseline for largely
marine-based diets on Greenland.
Comparison of the Greenland Sites
For comparison, it is useful to look at the isotope
ratios from the 4 Greenland sites with large samples
(E64, Innoqquasaq, E29a, Tjodhildes church, E149,
Narsarsuaq, and W51, Sandnes; Table 8). The sites
with 1 or a few samples will be incorporated later in
this discussion.
The average values of some of the ratios vary
substantially among the 4 sites (Table 8). Strontium
isotope ratios are high at the Western Settlement
of Sandnes and at the later Eastern Settlement site
of Narsarsuaq, E149. These values are low at the
2 early sites in the Eastern Settlement, Tjodhildes
Church and Innoqquasaq. In general, 87Sr/86Sr values
are lower than expected based on bioavailable
values in archaeological fauna because of the role
very close to the Norse farm Narsarsuaq (E149), also
in our study. The sample is from a skeleton collected
in grave 8. Among other things, the grave contained a
German coin dated to 1705–1743 (Mathiassen 1936).
On the basis of the coin the sample should be dated to
the 18th century.
Traditional Inuit diets were heavily dependent
on marine foods, although a number of different
terrestrial and marine species were hunted, fished,
collected, and gathered (Nelson et al. 2012b, Pars et
al. 2001). The most important source of nutrition was
the seal, hunted year-round, but whales, seabirds and
their eggs, and fish, especially halibut, were also significant
components of the diet (Buchardt et al. 2007,
Searles 2002). Terrestrial animals included caribou,
musk ox in NE Greenland, ptarmigan, and hare. In
addition, a variety of plant foods were collected and
eaten including grasses, tubers, roots, berries, and
seaweed (Pars et al. 2001).
Carbon isotope ratios in tooth enamel are similar
and relatively high for the range of Norse values
from Greenland (Table 7). δ13C values from these
individuals clearly reflect a major seafood compo-
Table 7. Isotope ratios for Inuit burials from Greenland.
Site 87Sr/86Sr 13C 18O
Qoornoq 0.710581 -9.73 -8.01
Uunartoq 0.709988 -11.17 -6.90
Niaquusat 0.710567 -10.39 -6.67
Table 8. Means, 1 standard deviation, minimum and maximum isotope values and number of samples for human enamel
from four major sites on Greenland. En = enamel, col = collagen.
87Sr/86Sr 13Cen 18Oen 13Ccol 15Ncol
Sandnes (W51) mean 0.7174 -12.26 -9.15 -15.78 15.13
stdev 0.0066 0.85 1.20 0.65 0.25
min 0.7101 -13.35 -10.46 -16.42 14.85
max 0.7314 -10.71 -6.52 -14.8 15.4
count 11 11 11 6 5
Innoqquasaq (E64) mean 0.7101 -14.87 -6.61 -18.71
stdev 0.0036 0.58 0.65 10.59
min 0.7079 -15.89 -7.93 -16.42
max 0.7191 -13.88 -5.59 -6.00
count 9 9 9 5
Narsarsuaq (E149) mean 0.7143 -12.33 -7.15 -15.03 17.27
stdev 0.0033 0.93 1.80 0.31 0.43
min 0.7114 -13.67 -11.28 -15.27 16.63
max 0.7224 -11.24 -4.41 -14.61 17.54
count 12 12 12 5 4
Tjodhilde (E29a) mean 0.7092 -13.24 -6.32 -18.5
stdev 0.0013 1.32 2.16 na
min 0.7074 -14.62 -9.48 -18.9
max 0.7117 -10.78 -3.41 -18.0
count 12 11 11 2
Journal of the North Atlantic
T.D. Price and J. Arneborg
2018 Special Volume 7
182
of marine foods in the diet. In addition, the 2 sites
with lower 87Sr/86Sr values in the Eastern Settlement
have a number of non-local individuals from
Iceland and perhaps Norway or northern Britain
among the buried individuals who were sampled.
Two of the 3 samples (a cow and a human) from
E35, Qorlortup Itinnera, in the Eastern Settlement
also exhibited strontium isotope ratios consistent
with an Icelandic origin, while the third individual
appears to be Greenlandic. The single individual
from E48, Igaliku, has a very high 87Sr/86Sr in line
with origins in Greenland and a low intake of marine
foods.
There are also obvious differences in Greenland
between the Eastern and Western Settlements in the
δ18O data in Table 7. The site of Sandnes is the only
series of human burials we have analyzed from the
Western Settlement and has an average value of
-9.2‰. The average for 33 burials from sites in the
Eastern Settlement is -6.7‰. The average values
among the various sites in the Eastern Settlement
are generally similar and vary from -7.2‰ to
-6.3‰. It is important to keep in mind that both
Tjodhildes Church and Innoqquasaq E64 contain a
substantial number of non-local individuals, most
from Iceland. δ18O was measured for 2 of the burials
from E35, Qorlortup Itinnera, and values of -4.9‰
and -7.8‰ were obtained. The more negative value
came from the individual presumed to be from Iceland
and the less negative value from the sample
thought to be local, as would be expected. The 1
sample from E48, Igaliku, produced a value of
-7.6‰, consistent with the higher strontium isotope
ratio (0.7122) and suggestive of an origin in the
Eastern settlement. The isotope ratios for the Inuit
burials are generally similar with only slight differences
in the δ18O values, related related at least
in 1 case to to differences between the Eastern and
Western Settlements.
Carbon isotope ratios are available from both the
enamel carbonate and bone collagen and provide
complementary information. Both sets of values
show a rather narrow spread. δ13Cen values vary
from -15.9‰ to -10.7‰ for 43 Norse samples from
all sites, with most values clustered between -13‰
and 14‰, and a smaller group between -11‰ and
-12.5‰ (Fig. 25). Values for δ13Ccol for 23 Norse
bone samples had an average value of -16.9 ±
1.62‰, with a minimum of -19.7‰ and a maximum
of -14.6‰.
The ratios from enamel and collagen are not
directly comparable, but a plot of the values is revealing
(Kellner and Schoeninger 2007; Fig. 26).
The Kellner model uses regression lines to distinguish
diets dominated by C3 protein vs. those with
marine protein (and/or C4 plant species). Samples
fall on or between 2 two regression lines depending
on the proportion of C3 or marine foods in the
diet. For both protein types, the diets of primarily
marine carbohydrate and lipids fall at the upper
end of the line and those with C3 carbohydrate
and lipid fall at the lower end of the line. Two
clusters of samples are clearly shown in the plot: a
group of 5 with δ13Ccol values of -18‰ or less and
δ13Cen values of -14‰ or less. These values point
to a diet based largely on terrestrial foods without
significant marine intake. The second group of 11
samples has with δ13Ccol values of -17‰ or more
positive and δ13Cen values of -13.5‰ or more positive.
A plot of these values (Fig. 26) on a Kellner
diagram (Kellner et al. 2007) provides an indication
of the proportion of marine 0.7092 in the diet
as well as some reflection of place of origin. Four
of the 5 hollow circles in the diagram are samples
with 87Sr/86Sr values indicative of an origin in
Figure 25. Histogram of δ13Cen for 43 Norse samples from
Greenland.
Figure 26. Scatterplot of δ13Cen vs. δ13Ccol for 16 Norse
samples from Greenland on a Kellner diagram (Kellner
and Schoeninger 2007). The hollow circles mark samples
with 87Sr/86Sr values indicative of an origin in Iceland.
Journal of the North Atlantic
T.D. Price and J. Arneborg
2018 Special Volume 7
183
Iceland. The distinction of 2 diets in the graph is
intriguing and clearly marks the predominance
of terrestrial diets on Iceland and marine diets on
Greenland.
Conclusions
The isotopic analysis of human remains from
Greenland has revealed a substantial amount of
information about diet and mobility among the
inhabitants of the Eastern and Western Settlements.
This information is available on several levels, from
comparisons of the population of Greenland with the
rest of the North Atlantic, from comparison of the
Eastern and Western Settlements, and comparison
of the households or communities represented by
the various sites. In addition, the isotopic data also
provides information at the individual level and
makes it possible to discuss a person’s diet and
movement in the past in some detail.
Greenland, because of the very old bedrock
of which it is composed, has generally very high
87Sr/86Sr values. At the same time, the consumption of
marine foods by Norse and Inuit peoples has dampened
these high ratios below what would be expected
from the bioavailable values of terrestrial species.
Nevertheless, human enamel 87Sr/86Sr values for individuals
born in Greenland lie above 0.7092 and can
be much higher. Oxygen isotopes in Greenland are
also generally more negative than elsewhere in the
Norse Atlantic. Values from 49 samples on Greenland
average -7.23‰ ± 1.78‰ and vary from -11.28‰ to
-3.42‰ and are distinct from Iceland, Norway, and
the northern British Isles and Ireland. A plot of δ18O
vs. 87Sr/86Sr shows this pattern for Greenland, Iceland,
and Norway (Fig. 28). Comparable data from the British
Isles and Ireland are not yet available. Oxygen
isotope ratios are useful for distinguishing Greenland
from Iceland and Norway, although the latter 2 groups
overlap substantially.
In part, because of the specific sites that have
been excavated and sampled for this study of
Greenland, there is a high proportion of Icelanders in
the population, individuals who were among the first
settlers, especially at the sites of E29a, Tjodhildes
Church, and E64, Innoqquasaq. The newcomers
from Iceland included cows and probably other
domestic species as well.
There are also important useful isotopic
differences between the Eastern and Western
Settlements. The geology of the Western Settlement
is somewhat older than that of the Eastern Settlement,
which results in significantly higher 87Sr/86Sr values.
Human diet in the Western Settlement was more
marine oriented. The last humans from the Eastern
Settlement were as marine-based as the last from the
Western Settlement (Arneborg et al. 2012c). This
marine component does dampen 87Sr/86Sr values to
some extent, but recognizable differences remain.
Oxygen isotope ratios are also more negative at the
more northerly Western Settlement. Because of these
differences it is possible to discern individuals who
moved from the Eastern to the Western Settlement
and, in one or two cases, individuals who went the
other way.
Isotopic analysis at the individual level is of
particular interest. We can see for example at E64,
Innoqquasaq, that 2 young individuals were likely
born locally, while their parents and relatives in
the cemetery came to Greenland from Iceland at
this early settlement. There were also a substantial
proportion of Iceland natives at the early sites E29a,
Tjodhildes Church, and E35, Qorlortup Itinnera.
There was surprising variation in the strontium and
oxygen isotope ratios at W51 Sandnes in the Western
Settlement. The data suggest either varied diets
among the inhabitants or multiple places of origin
within the Western Settlement, or both.
Figure 27. Scatterplot of δ13Ccol vs. δ15Ncol for 16 Norse
samples from Greenland.
Figure 28. Scatterplot of δ18O vs. 87Sr/86Sr for human and
faunal samples from Greenland, Iceland, and Norway.
The diagonal line is an approximation of the separation of
these samples.
Journal of the North Atlantic
T.D. Price and J. Arneborg
2018 Special Volume 7
184
The 3 Inuit individuals analyzed as part of this
project confirm a heavily marine diet, as is reported
ethnographically, and the significant dampening
of terrestrial bioavailable 87Sr/86Sr to values very
close to 0.7092. These data reaffirm the picture of
these people as successful marine foragers, known
to have expanded in numbers and territory as the
Norse abandoned Greenland in the face of climatic
hardship.
Literature Cited
Arneborg, J. 2006. Saga Trails. Vintervår, Linde Tryk,
Denmark.
Arneborg, J. 2010. Brattahlids beliggenhed. Grønland
4:320–328.
Arneborg, J. 2012. Churches, Christianity and Magnate
Farmers in the Norse Eastern Settlement. Pp. 167–170,
In H.C. Gulløv, P.A. Toft, C.P. Hansgaard (Eds.),
Northern Worlds: Challenges and Solutions. Report
from workshop 2 at the Nationalmuseum, 1 November
2011. Copenhagen, Denmark. 373 pp.
Arneborg, J., J. Heinemeier, N. Lynnerup, H.L. Nielsen,
N. Rud, and A.E. Sveinbjörnsdottir. 1999. Change of
diet of the Greenland Vikings determined from stable
carbon isotope analysis and 14C dating of their bones.
Radiocarbon 41:157–168.
Arneborg, J., J. Heinemeier and N. Lynnerup. (Eds.).
2012a. Greenland Isotope Project: Diet in Norse
Greenland AD 1000–AD 1450. Journal of the North
Atlantic. Special Volume 3.
Arneborg, J., N. Lynnerup, J. Heinemeier, J. Møhl, N.
Rud and A., Sveinbjörnsdóttir. 2012b. Norse Dietary
Economy ca. A.D. 980–ca. A.D. 1450: Introduction.
Pp. 1–39, In J. Arneborg, J. Heinemeier, and Niels
Lynnerup (Eds.). Journal of the North Atlantic. Special
Volume 3:1–39.
Arneborg, J., N. Lynnerup and J. Heinemeier 2012c.
Human Diet and Subsistence Patterns in Norse
Greenland AD c.980–AD c.1450: Archaeological
Interpretations. Pp. 119–133, In J. Arneborg, J.
Heinemeier, and N. Lynnerup (Eds). Journal of the
North Atlantic. Special Volume 3:119–133.
Chadwick, R.A., D.I. Jackson, R.P. Barnes, G.S. Kimbell,
H. Johnson, R.C. Chiverrell, G.S.P. Thomas, N.S.
Jones, N.J. Riley, E.A. Pickett, B. Young, D.W.
Holliday, D.F. Ball, S.G. Molyneux, D. Long, G.M.
Power, and D.H. Roberts. 2001. Geology of the Isle of
Man and its offshore area. British Geological Survey,
Nottingham.
Dugmore, A.J., T.H. McGovern, O. Vésteinsson, J.
Arneborg, R. Streeter, and C. Keller. 2012. Cultural
adaptation, compounding vulnerabilities and
conjunctures in Norse Greenland. Proceedings of the
National Academy of Science 109:3658–3663
Edwards, K.J., J.E. Schofield, and J. Arneborg. 2010.
Was Erik the Red’s Brattahlið Located at Qinngua?
A Dissenting View. Viking and Medieval Scandinavia
6:83–99. 10.1484/J.VMS.1.102137.
Enghoff, I.B. 2003. Hunting, fishing and animal husbandry
at The Farm Beneath The Sand, Western Settlement.
Meddelelser om Grønland, Man & Society 28.
Copenhagen, Denmark. 104 pp.
Fricke, H. C., J.R. O’Neil, and N. Lynnerup. 1995.
Oxygen isotope composition of human tooth enamel
from medieval Greenland: Linking climate and
society. Geology 23:869–872.
Froehle, A.W., C.M. Kellner, and M.J. Schoeninger.
2012. Multivariate carbon and nitrogen stable isotope
model for the reconstruction of prehistoric human
diet. American Journal of Physical Anthropology
147:352–69.
Gulløv, H.C. 1997. From Middle Ages to Colonial Times.
Archaeological and ethnohistorical studies of the
Thule Culture in South West Greenland 1300–1800
AD. Meddelelser om Grønland, Man & Society 23.
Copenhagen, Denmark. 501 pp.
Hoppe, K.A., P.L.Koch, and T.T. Furutani. 2003. Assessing
the Preservation of Biogenic Strontium in Fossil
Bones and Tooth Enamel. International Journal of
Osteoarchaeology 13:20–28.
Johansen, O.S., S. Gulliksen, and R. Nydal. 1986. 13C
and diet: Analysis of Norwegian human skeletons.
Radiocarbon 28:754–761.
Jónsson, F. 1930. Det Gamle Grønlands Beskrivelse af Ívar
Bárðarson. Glydendal, Copenhagen, Denmark 75 pp.
Kalsbeek, F. 1997. Age determinations of Precambrian
rocks from Greenland: Past and present. Geology of
Greenland Survey Bulletin 176:55–59.
Kellner, C.M., and M.A. Schoeninger. 2007. A
simple carbon-isotope model for reconstructing
prehistoric human diet. American Journal of Physical
Anthropology 133:1112–1127.
Kieffer-Olsen, J. 1993. Grav og gravskik i det middelalderlige
Danmark. Aarhus Universitet,
Middelalderarkæologisk Nyhedsbrev. Århus, Denmark.
212 pp.
Lynnerup, N. 1998. The Greenland Norse: A Biologicalanthropological
Study. Meddelelser om Grønland,
Man & Society 24. Copenhagen, Denmark.
Madsen, C.K. 2014. Pastoral Settlement, Farming, and
Hierarchy in Norse Vatnahverfi, South Greenland.
Ph.D. dissertation, University of. Copenhagen, Denmark.
Magnusson, M., and H. Pálsson. 1965. The Vinland Sagas.
Penguin Books, New York City, USA.
Mathiassen, T. 1936. The Eskimo Archaeology of
Julianehaab District. Meddelelser om Grønland
118(1).
McGovern, T.H. 1985. Contributions to the paleoeconomy
of Norse Greenland. Acta Archaeologica 54-1983:73–
122.
Meldgaard, J. 1982. Tjodhildes Kirke: Den første
fundberetning. Grønland 5-6-7:151–162.
Moorbath, S., and R.J. Pankhurst. 1976. Further rubidium-
strontium age and isotope evidence for the nature
of the late Archaean plutonic event in West Greenland.
Nature 262:124–126.
Journal of the North Atlantic
T.D. Price and J. Arneborg
2018 Special Volume 7
185
Nelson, E., J. Heinemeier, N. Lynnerup, J. Arneborg, and
Á.E. Sveinbjörnsdóttir. 2012a. An isotopic analysis of
the diet of the Greenland Norse. Journal of the North
Atlantic Special Volume 3:93–118.
Nelson, D.E., N. Lynnerup and J. Arneborg 2012b. A
First Isotopic Dietary Study of the Greenlandic Thule
Culture. Pp. 51–64, In Arneborg, J., J. Heinemeier, and
N. Lynnerup (Eds.). Greenland Isotope Project: Diet in
Norse Greenland AD 1000–1450. Journal of the North
Atlantic. Special Volume 3:51–64.
Ogilvie, A.E.J., J.M. Woollett, K. Smiarowski, J.
Arneborg, S. Troelstra, A. Kuijpers, A. Pálsdóttir,
and T.H. McGovern. 2009. Seals and sea ice in
Medieval Greenland. Journal of the North Atlantic.
Volume 2:60–80.
Pars, T., M. Osler, and P. Bjerregaard. 2001. Contemporary
use of traditional and imported food among Greenland
Inuit. Arctic 54:22–31.
Price, T.D., K.M. Frei, and E. Naumann. 2015. Isotopic
Baselines in the North Atlantic Region. Journal of the
North Atlantic Special Volume 7:103–136.
Price, T.D., and H. Gestsdóttir. 2018. The peopling of the
North Atlantic: Isotopic results from Iceland. Journal
of the North Atlantic Special Volume 7:146–163.
Rousssell, A. 1936. Sandnes and the Neighbouring Farms.
Meddelelser om Grønland 88 (2)
Roussell, A. 1941. Farms and Churches in the Mediaeval
Norse Settlements of Greenland. Meddelelser om
Grønland 89(1). Kommissionen for Videnskabelige
Undersøgelser i Grønland. Copenhagen, Denmark.
Searles, E. 2002. Food and the Making of Modern Inuit
Identities. Food and Foodways: History and Culture
of Human Nourishment 10:55–78.
Vebæk, C.L. 1991. The Church Topography of the
Eastern Settlement and the Excavation of the
Benedictine Convent at Narsarsuaq in the Uunartoq
Fjord. Meddelelser om Grønland, Man & Society 14.
Copenhagen, Denmark.
Vitousek, P.M., M.J. Kennedy, L.A. Derry, and O.A.
Chadwick. 1999. Weathering versus atmospheric
sources of strontium in ecosystems of young volcanic
soils. Oecologia 121:255–259.
Whipkey, C.E., R.C. Capo, O.A. Chadwick, and B.W.
Stewart. 2000. The importance of sea spray to the
cation budget of a coastal Hawaiian soil: A strontium
isotope approach. Chemical Geology 168:37–48.