[an error occurred while processing this directive]
2012 D.E. Nelson, J. Heinemeier, J. Møhl, and J. Arneborg 77
Introduction
In the late first millennium AD, the Scandinavian
Norse introduced agriculture into the islands of the
North Atlantic, settling in the Faeroes, the Shetlands,
Iceland, and eventually Greenland, bringing
with them all they needed to establish a pastoral
economy in areas that are very marginal for agriculture.
This was especially the case in Greenland,
where the only suitable land is on the Southwest
coast, at the very edge of the largest glacier in the
Northern Hemisphere. As is described in detail in
Arneborg et al. 2012a [this volume], they brought
with them cattle, sheep, goats, and even pigs; horses
were included for transport and dogs for herding and
hunting. These domesticates formed the basis of an
agrarian economy which was to persist for almost
five centuries.
In Greenland, plant husbandry was not possible
other than on a very limited scale, and even animal
husbandry was insufficient to provide for the dietary
needs of the settlements. As a broad generalization,
the faunal remains from Norse sites include approximately
equal numbers of wild and domesticate
bones (cf. McGovern 1985). As by far the greater
numbers of the wild animals hunted were marine, we
have the possibility to use isotope analysis to follow
the domestic and wild protein through to the human
diet. This approach requires establishing the isotope
compositions for the animals consumed, so that the
human isotope compositions may be interpreted using
the animal values as a basis.
A preceding paper in this volume (Nelson et al.
2012a) examined the isotope ratios of the wild prey
species in Greenland. Here, we carry this analysis
on to the domesticates. While limited carbon isotope
information has been provided from past radiocarbon
dating of Norse domesticates, this work was
not done with dietary reconstruction as a goal, nor
with methods designed for the purpose. No previous
measurements of the stable nitrogen isotopes have
been made.
In this paper, we present and examine the isotopic
data obtained from analysis of a large number of
bones of the Norse Greenlandic domesticates. No
attempt is made here to integrate these results into
a broader context than that of direct interest to this
project. In particular, we wished to address several
inter-related technical and economic issues at varying
levels of detail. The technical issues are directly
concerned with the application of carbon and nitrogen
isotope analysis to reconstruct human diet in
Greenland. An introduction to the methodology is
given in Arneborg et al. 2012a [this volume]. Other
papers in this volume have attempted to characterize
the isotope composition of non-domesticated fauna
of Greenland (Nelson et al. 2012a [this volume]).
Here, by pursuing the following questions, we aim
to extend the focus to the domesticates that were
introduced to Greenland by the Norse:
- What are the isotope ratios of the animals
introduced by the Norse into Greenland? In
general, do these domestic herbivores have
ratios typical of herbivores in a C3 plant
environment, or are they different?
- How variable are these ratios?
- Are there differences between the domestic
species?
Isotopic Analyses of the Domestic Animals of Norse Greenland
D. Erle Nelson1, Jan Heinemeier2, Jeppe Møhl3, and Jette Arneborg4,5,*
Abstract - To provide a basis for the isotopic dietary study of the Greenland Norse, and as an interesting study in itself,
measures of the stable carbon (δ13C) and nitrogen (δ15N) isotope ratios were obtained for 118 samples of archaeological bone
from 6 species of the Norse domestic animals. These samples were obtained from museum faunal collections representing
archaeological excavations of 10 Norse sites, five in each of the two Norse settlements in Greenland. In general, the carbon
isotope values for the herbivores of dietary importance (cattle, sheep, and goats) were as expected for animals living
in a C3 environment. The nitrogen isotope data hint at differing field management practices between the two settlements.
There is no isotopic evidence for any unusual pastoral adaptation to conditions in Greenland, or for any change in animal
management over the lifetime of the settlements. A few pigs form an exception to this statement, but they are peripheral to
the Norse dietary economy. These data provide a solid first data set on which to base isotopic dietary analyses of the Norse
settlers themselves.
Special Volume 3:77–92
Greenland Isotope Project: Diet in Norse Greenland AD 1000–AD 1450
Journal of the North Atlantic
1FRSC Professor Emeritus, Simon Fraser University, Deptartment of Archaeology. Burnaby, BC Canada. 2AMS 14C Dating
Centre, Department of Physics and Astronomy, Aarhus University, Ny Munkegade 120, DK-8000 Aarhus C, Denmark.
3Zoological Museum, Natural History Museums of Denmark, University of Copenhagen, Copenhagen, Denmark. 4Danish
Middle Ages and Renaissance, Research and Exhibitions, The National Museum of Denmark Frederiksholms Kanal 12,
DK-1220 Copenhagen. Denmark. 5Institute of Geography, School of GeoSciences, University of Edinburgh, Scotland UK.
*Corresponding author - Jette.arneborg@natmus.dk.
2012
78 Journal of the North Atlantic Special Volume 3
- How do the isotope ratios of the domesticates
compare to those of the wild terrestrial
herbivores?
- Since the climatic zones of Greenland range
from the subarctic to the high arctic, and the
annual precipitation can vary by a factor of
ten between regions (e.g., Hansen 2001),
can we see evidence for natural regional
differences in the isotopes of Greenlandic
terrestrial herbivores?
The human economic issues center around the
Norse practice of animal husbandry under the conditions
present in this new land. Information on the
Norse domestic economy is critical both for its own
sake and for the technical background it provides.
We sought to answer the following questions:
- Is there evidence that Norse husbandry is refl
ected in the isotope ratios of their animals?
- Can we detect any differences between the
domestic animals in the two settlements
which reflect different management practices
in the subarctic Eastern Settlement and
the low arctic Western Settlement?
- Is there any evidence that the early Norse
colonists adjusted their animal husbandry to
suit Greenlandic conditions?
- Are there any long-term differences for the
domesticates in either of the two settlements
which might reflect changing practice or
changing climate?
Some of these questions may seem a little naive
to those familiar with dietary isotope studies, but
there is a potential unusual complication here. We
know that even until recent times, farmers in the
far north of Norway, on the North Atlantic islands,
and on the Northern British Islands routinely used
heather, bushes, horse manure, sea-weed, and even
fish remains to supplement the hay fed to their cattle
during the long winter (Amorosi et al. 1998:46-47
[with references], Balasse et al. 2009:12 [with references],
Mørkved 1996). This “Vårknipa” or hungerfeeding
practice has a long history (ibid), and there
is thus good reason to believe that it might have been
in use in Greenland. If so, it could certainly have had
an impact on the isotope ratios of the animals.
Answers to these various questions should allow
us to examine the basic question that underlies interpretations
of human isotopic data:
- To what extent can we define characteristic
carbon and nitrogen isotope ratios for the
terrestrial protein consumed by the Norse?
Knowledge of the average isotopic composition of
the protein consumed by humans allows prediction of
the human values, and so we attempt with this study
to shed additional light on the answer to that question.
The Sites and the Samples
For this first study, we addressed these questions
by selecting bone samples of each of the important
domestic species from archival faunal remains at
the Zoological Museum of the University of Copenhagen.
While these collections are extensive, there
were limitations. Most result from archaeological
excavations undertaken over the past century, and
there was often little or no information available on
context or stratigraphic placement. Further, many
bones were fragmentary. It was therefore not always
possible to be certain that each fragment was that of
a different individual, nor was it always possible to
estimate the age of the individual animal. For some
sites, it was necessary to choose samples that could
only be identified as either sheep or goat. These two
animals are very difficult to distinguish between by
bone morphology, and the samples available did not
always permit choice of those that were clearly one
or the other.
Table 1 gives a summary list of the sites from
which samples were obtained. For a detailed review
of these sites, the reader is referred to the introductory
paper (Arneborg et al. 2012a [this volume]).
Table 2 lists the numbers of specimens (n) of
each species taken for study. An attempt to determine
the number of individuals (N) represented was
Table 1. Norse sites from which faunal samples were obtained.
Norse place names are in italics.
Site codes
Danish National Greenland National
Site name Museum Museum and Archives
Western Settlement
GUS 64V2-III-555
Naajaat Kuuat V63 64V2-III-506
Niaquusat V48 64V2-III-507
Nipaatsoq V54 64V2-III-502
Kilaarsarfik / Sandnes V51 64V2-III-511
Eastern Settlement
Qassiarsuk / Brattahlid Ø29a 61V3-III-539
Igaliku / Gardar Ø47 60V2-0IV-621
Narsaq Ø17a 60V1-00I-518
VatnahverfiØ71 60V2-0IV-602
VatnahverfiØ167 60V2-0IV-603
Table 2. Number of specimens (n) and estimated number of individuals
(N) of each species studied.
Estimated
Number of # of
Common name Latin name specimens (n) individuals (N)
Cattle Bos taurus 52 40 to 52
Sheep Ovis aries 25 16 to 25
Goat Capra hircus 17 11 to 17
Sheep or goat - 10 3 to 10
Pig Sus scrofa 4 4
Horse Equus caballus 6 4 to 6
Dog Canis familiaris 4 3 or 4
2012 D.E. Nelson, J. Heinemeier, J. Møhl, and J. Arneborg 79
made by taking into account the bone element, any
information on animal biological age, find context,
and any radiocarbon or derived archaeological dating
information. We decided against attempting to
use differences in isotopic values to further differentiate
between individuals. Of the total of 118
samples, a minimum number of 88 individuals have
been identified. Details of the samples themselves
are given later in Tables 4–11. All samples are those
of adult animals if not otherwise noted.
The question of whether the Norse changed their
husbandry practices to adapt them to Greenlandic
circumstances and eventually to changing climate
requires chronological control for these samples.
While the overall chronology for Norse Greenland
is well established from both historical and archaeological
data, the details are not, as many of the Norse
sites were excavated before stratigraphic methods
were developed. To test for change over time, we
could thus not rely on excavated information to provide
adequate chronological detail. Nor was it practical
to consider radiocarbon dating every sample,
and so a combined approach was taken.
The purpose was not to provide detailed chronologies
for the Norse settlements, but simply to test
the isotopic data for evidence of change over time.
The time-span of Norse occupation of Greenland
was divided into three parts, defined as the Early
(I) ca. 980–ca. 1160 AD, Middle (II) ca. 1160–1300
AD and Late (III) ca. 1300–ca. 1450 AD periods
of settlement. For those sites for which there was
stratigraphic chronological information, the measured
samples were then sorted into these three
groups. A further 30 samples were radiocarbon dated
(Arneborg et al. 2011a [this volume]) and could then
be placed reliably into these same periods. Here, we
make use of the results of these determinations for
the cattle, the sheep, and the goats, as these are the
animals of particular interest in this context.
Measurement Procedures and Results
For both stable isotope analysis and radiocarbon
dating, the method used for collagen extraction is
the same as that used throughout this project, as
described in Takahashi and Nelson (2012 [this volume]).
The specimens were sampled at the Zoological
Museum using a slow speed drill to sample underlying
material after the surface had been removed
by milling. As with the other sampling, the size of
the holes drilled and the amount of material removed
decreased over the sampling period. Typically, 200–
300 mg of drillings were taken at the outset, decreasing
later to 50–80 mg. All samples were taken to the
Isotope Archaeology Laboratory at Simon Fraser
University for further processing. For the stable
isotope determinations, aliquots of about 50 mg of
bone were used and the extracted collagen sent to the
Earth and Ocean Sciences Department, University of
British Columbia, for direct measurement of the carbon
and nitrogen concentrations of the extract, the
C/N ratio, and both δ13C and δ15N values. As usual,
these latter are reported relative to the respective
standards VPDB and AIR. As discussed in Takahashi
and Nelson (2012 [this volume]), the uncertainties
in this measurement procedure are about ±0.1‰
for δ13C and ±0.2‰ for δ15N. These are sufficiently
small that measurement uncertainty does not impact
on our basic interpretations. Even so, another source
of measurement variability needs to be considered.
Bone re-modeling during the lifetime of the animal
could result in different isotopic compositions for
different parts of the bone if the animal’s diet is not
isotopically constant. To get an idea of the potential
magnitude of such an effect, we made two measurements
each on bones from three cattle, two adults
and a neonate. For each of the three bones, both
samples were taken from the cortex of the diaphysis
with a spacing of about 1–2 cm. For Adult 1, the
samples were from the proximal portion of the tibia;
for Adult 2, the central part of the metatarsus; and
for the Neonate, the proximal portion of the ulna.
One might thus expect to see the greatest differences
in Adult 1, less in Adult 2 and little or none in the
Neonate. Further, one would expect the effect to be
more strongly seen in the nitrogen isotope data than
in the carbon isotope data. The results obtained are
given in Table 3.
The observed isotopic differences between samples
from the same bone are not significant in view
of the basic measurement uncertainty, except for the
δ15N values of Adult 2 (1.0‰) and both the δ13C and
δ15N values for Adult 1 (0.3 and 2.0, respectively).
The large differences for both carbon isotope ratios
Table 3. Comparisons of bone sampling location versus δ13C and δ15N.
Sample ID Animal Bone element δ13C (‰ v PDB) δ15N (‰ v AIR) Individual
#53 Adult 1 Ttibia -20.5 10.2 Identical to sample #354
#354 Adult 1 Tibia -20.8 8.2 Identical to sample #53
#155 Adult 2 Metatarsus -21.2 11.5 Identical to sample #355
#355 Adult 2 Metatarsus -21.3 10.5 Identical to sample #155
#159 Neonate Uulna -20.8 12.2 Identical to sample #356
#356 Neonate Ulna -20.9 11.9 Identical to sample # 159
80 Journal of the North Atlantic Special Volume 3
and nitrogen isotope ratios in Adult 1 likely reflect
bone re-modeling. Since it was not possible to control
for this extra variable in our sampling, we thus
estimate that, at the level of the individual animal,
differences in δ13C values of ≤0.3‰ and δ15N differences
of ≤2‰ may not reflect significant mean
dietary differences between individuals. As will be
seen in the coming sections, differences of slightly
greater magnitude are seen when comparing different
populations. These observations will complicate
detailed statistical comparisons of the data. Fortunately,
such comparisons are not necessary for our
purposes.
For samples also destined for radiocarbon dating,
the aliquot size was increased to about 200 mg, but
the extraction procedure remained the same. The extracted
collagen was then sent to the Aarhus University
AMS 14C Dating Centre for age determination
(see, e.g., Arneborg et al. 1999 and Sveinbjörnsdottir
et al. 2010 concerning reservoir correction and
Andersen et al. 1989 for technical details). Three of
these extracted samples were also dated at the Lawrence
Livermore National Laboratory (CAMS).
In general, we found collagen preservation to
be excellent, as can be seen in the measured C and
N concentrations and the C/N ratios given for each
sample in Tables 4 to 11. The very few exceptions
to this were simply eliminated from further consideration.
The time period to which the sample has
been assigned (Arneborg et al. 2012a [this volume])
and the stable isotope data obtained is given in the
remaining columns of Tables 4 to 11.
Discussion
The species of primary interest here are those
that would have formed the basis of Norse dietary
economy: the cattle, sheep, and goats (e.g., Enghoff
2003, McGovern 1985). Of these, the cattle were
of great importance to the Norse, both in terms of
the prestige that they proffered to the owner and the
foodstuffs they could provide. They also required
the greatest amount of care, in comparison to the
more hardy sheep and the very hardy goats, and they
were likely given the best pasture lands in the summer
and the best fodder in the winter.
The cattle
The data obtained for the cattle from sites in
the subarctic Eastern Settlement are given in Table
4 and Figure 1. It is immediately apparent that the
δ13C values are remarkably constant, with a mean
and standard deviation for the entire suite of <δ13C>
= -20.2 ± 0.5‰. While it is tempting to examine this
data for evidence of internal patterning (e.g., removing
the young animals decreases the variability even
Table 4. The Eastern Settlement cattle. The estimated number of individuals is based on archaeological information, bone element, and
biological age of the animal. Dates are based on either radiocarbon dating (C14) or archaeological information (A).
Extract Extract Extract δ13C δ15N
Site Sample ID Bone element Period C% N% C/N (‰ v PDB) (‰ v AIR) Individual/context
Qassiarsuk/Brattahlid, Ø29a
#17 I (C14) 3.0 -20.2 4.2 Unique
Igaliku/Gardar, Ø47
#152 Phalange 43.7 15.1 2.9 -20.3 4.9 Without information
#153 Phalange 43.0 15.0 2.9 -20.6 5.1 Without information
#161 Metatarsus, juv. 43.3 14.7 2.9 -19.2 1.6 Unique
Vatnahverfi/Vatnahverfi, Ø71
#110 Scapula II (C14) 45.8 15.3 3.0 -20.1 4.9 Unique
#111 Metatarsus II (C14) 43.8 16.7 2.6 -20.2 2.8 Unique
#117 Metatarsus, juv. I (C14) 48.2 16.2 3.0 -19.5 4.4 Unique
Vatnahverfi/Vatnahverfi, Ø167
#87 Cranium, neonate? 43.5 15.8 2.8 -20.0 6.1 Unique
#91 Astragalus sin. 40.4 14.9 2.7 -20.5 3.5 House 1, room III
#92 Astragalus sin. 44.5 16.5 2.7 -20.6 3.8 House 1, room III
#93 Metacarpus sin, neonate 44.5 15.7 2.8 -19.1 4.2 House 1, room III
#94 Phalange 44.6 16.1 2.8 -20.8 2.5 House 1, room III
#108 Metacarpus, juv. I (C14) 46.6 15.9 2.9 -20.2 4.4 Unique
#109 Phalange I (C14) 46.2 16.0 2.9 -20.3 3.2 Unique
#112 Metatarsus 43.8 16.1 2.7 -20.1 3.3 Unique
#113 Metacarpus sin. II (C14) 44.7 16.6 2.7 -20.4 2.7 House 1, room V
#114 Calcarius III (C14) 43.8 16.6 2.6 -20.7 2.1 Unique
#115 Radius, neonate? 46.8 15.4 3.0 -19.5 4.7 Unique
#116 Metatarsus, neonate? 47.4 16.0 3.0 -20.1 3.5 Unique
#118 Phalange 47.9 16.6 2.9 -21.0 2.2 Unique
#119 Astragalus, juv. II (C14) 47.8 16.2 3.0 -19.9 3.7 House 1, room V
#120 Costa I C14) 47.9 15.8 3.0 -20.4 2.6 House 1, room III
n (number of specimens) = 22 Average -20.2 3.7
N (number of individuals) = 17 to 22 1 σ 0.5 1.1
2012 D.E. Nelson, J. Heinemeier, J. Møhl, and J. Arneborg 81
further to ±0.3‰), that is pushing the data farther
than warranted, as measurement uncertainty (as discussed
above) at such a level of statistical analysis
becomes an important consideration. Such detail
goes well beyond the needs of this study, and pursuing
it would require more consideration in sample
choice.
In contrast, the nitrogen isotopes are more variable,
with a mean and standard deviation of <δ15N>
= 3.7 ±1.1‰. Here, we expect some of this variation
to reflect age, as a newborn animal has the same δ15N
as its mother, but the youngster’s value rises about
3‰ (a trophic level) higher while it suckles and then
falls to the same value again after weaning if mother
and offspring are eating the same food (cf. Fogel et
al. 1989). There seems to be evidence of this in the
data here. One can go through the list of juvenile animals
and speculatively interpret their values in this
light, which could be a factor in the reconstruction
of Norse dietary habits.
There is no evidence for significant isotopic differences
between the animals at the different Eastern
Settlement sites, and this limited data set thus suggests
that the circumstances at each were similar.
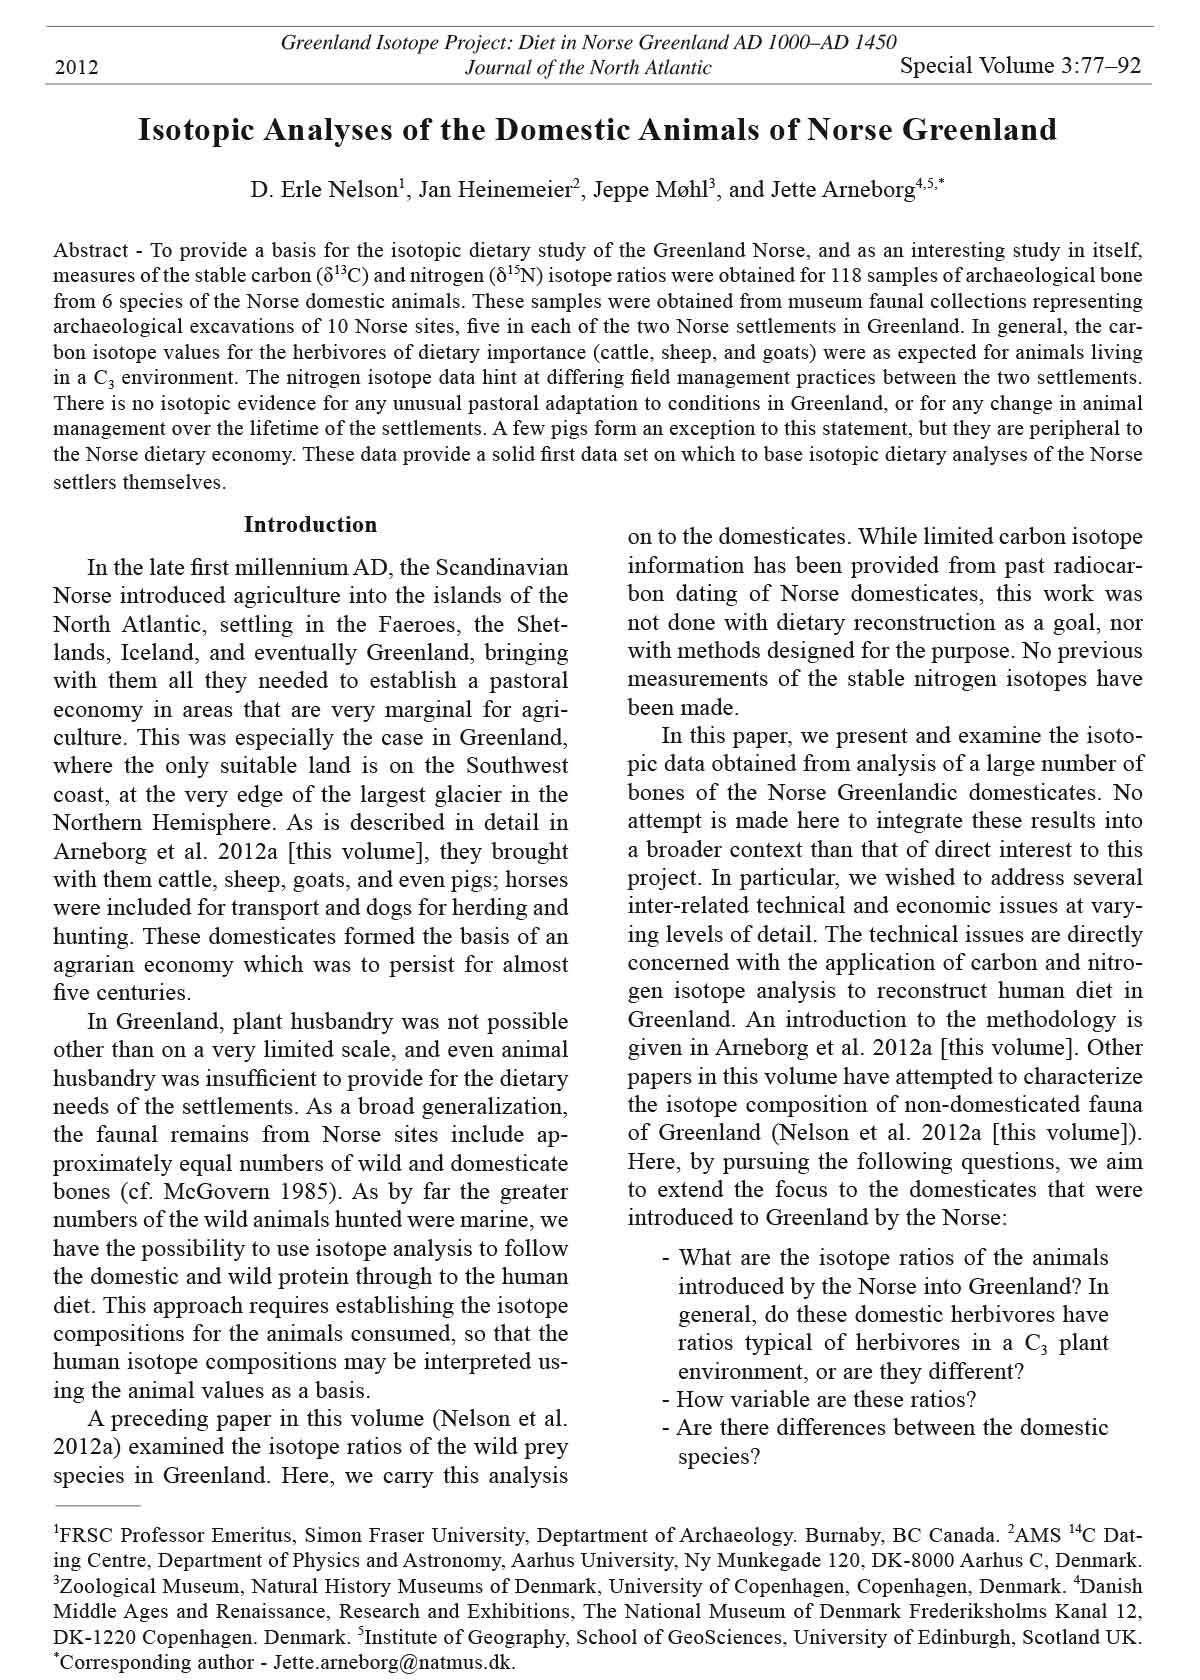
Farther north, the cattle from the low arctic
sites of the Western Settlement (Table 5 and Figure
1) have δ13C values very similar to those in the
south. Although the mean value <δ13C> = -20.5 ±
0.5‰ is probably different from that of the Eastern
Settlement (Students t: P = 0.02), the difference is
so small (0.3‰) that measurement uncertainty becomes
an issue, and for our present purposes, this
is not important. The same is not true for the nitrogen
isotope data. While the mean (<δ15N> = 6.1 ±
2.2‰) differs from that of the southern animals,
it is the range of values that is of greater interest.
Some have much higher values than those normally
expected for a terrestrial herbivore, and it is immediately
clear from Figure 1 that there is patterning
within the data set. Especially noteworthy in this
respect are the animals from Niaquusat, V48. This
anomaly mirrors that found in a study of modern
Greenlandic caribou and plants (E. Nelson and J.
Møhl, unpubl. data) in which a few specimens of
modern grasses also exhibited very high nitrogen
isotope ratios. The speculative explanation there
was that those anomalies were due to a fertilization—
deliberate or not—effect by local midden
accumulations on the plants growing on them.
Subsequent research actually indicates that high
δ15N values could be due to fertilization practices
applied to the infields (Commisso and Nelson 2010
and references therein).
Figure 1. δ15 N values versus δ13 C values for cattle. Data points for juvenile/neonate individuals are marked with J.
82 Journal of the North Atlantic Special Volume 3
although these exhibit almost twice as much variability
in their nitrogen values, as compared to the
other groups. We had only five goat samples from
the Eastern Settlement, all from the site Ø47. These
are slightly different, but 3 to 5 individuals comprise
too small a group from which to form statistically
valid conclusions, especially as several were young
animals. With this one small caveat, we can state that
for the population means, there are no differences
between these two species or locales that can be
detected with present methods.
Given these observations, it is not surprising that
those samples which could only be identified as either
sheep or goat also have these isotopic compositions.
All sheep and goats can then be lumped into a
single isotopic group with means of <δ13C> = -19.7
± 0.4‰ and <δ15N> = 4.1 ± 1.1‰. As these values
The sheep and goats
Distinguishing between the bones of these two
domestic species can be difficult, especially when
the material at hand is fragmentary. The samples
listed in Tables 6 and 7 are those for which identifi-
cation could be made with some certainty. In order to
increase sample size somewhat, a separate category
of either sheep or goat was established, as given in
Table 8. The data obtained for these two species at
both Eastern Settlement and Western Settlement
sites are so similar that we discuss them as a single
group (Fig. 2).
No statistical comparisons are necessary to note
that the mean isotopic compositions for sheep from
Eastern Settlement sites are identical to those from
the Western Settlement. This observation can be
extended to the goats from the Western Settlement,
Table 5. The Western Settlement cattle. The estimated number of individuals is based on archaeological information, bone element, and
biological age of the animal. Dates are based on either radiocarbon dating (C14) or archaeological information (A).
Extract Extract Extract δ13C δ15N
Site Sample ID Bone element Period C% N% C/N (‰ v PDB) (‰ v AIR) Individual/context
GUS #54.2 Metatarsus dex. III (A) 43.2 15.7 2.8 -20.4 6.6 X1487, Room I
#58 Carpal III (A) 45.4 16.7 2.7 -20.1 3.9 X1432, Room I
#60 Metacarpus sin. III (C14) 44.9 16.2 2.8 -20.0 4.8 X0678, Room I
#61 Humerus dex. 44.7 16.3 2.7 -20.9 8.6 X0577, Room I
#104 Phalange I (A) 45.6 16.6 2.7 -20.4 4.2 Unique
#265 Mandible dex., neonate 43.0 14.4 3.0 -19.6 3.4 Unique
Naajaat Kuuat, V63
#154 Phalange 42.9 14.9 2.9 -20.9 5.2 Unique
Niaquusat, V48
#32 Phalange I (C14) 44.2 16.0 2.8 -21.3 7.3 Can be same
individual as #53/354
#37 Metatarsus I (C14) 43.0 15.5 2.8 -20.5 4.5 Unique
#38 Metacarpus 43.4 15.8 2.7 -20.6 6.1 Unique
#53/354 Tibia sin. 44.2 15.6 2.8 -20.6 9.2 Can be same
individual as #32
#56 Radius sin. I (C14) 44.7 16.4 2.7 -20.8 5.6 Can be same
individual as #59
#59 Costa 44.0 16.0 2.8 -21.3 6.4 Can be same
individual as #56
#155/355 Metatarsus II (C14) 43.3 15.0 2.9 -21.3 11.0 Unique
#157 Metacarpus III (A) 43.2 14.7 2.9 -20.6 5.8 Unique
#159/356 Ulna, foetus/neonate III (A) 43.6 14.6 3.0 -20.8 12.1 Unique
Nipaatsoq, V54
#151 Phalange III (C14) 43.4 15.3 2.8 -20.4 7.7 Unique
#163 Radius, juv. III (C14) 43.7 14.3 3.1 -19.5 6.9 Unique
Kilaarsarfik / Sandnes, V51
#156 Pelvis II (A) 42.9 14.7 2.9 -20.5 6.0 Unique
#158 Metacarpus, neonate 43.4 14.6 3.0 -20.5 8.1 Unique
#160 Metacarpus, juv. 43.8 14.3 3.1 -21.1 7.9 Unique
#390 Metacarpus sin. II (A) 43.9 17.0 2.6 -20.4 5.5 Unique
#395 Metacarpus sin. II or III (A) 44.5 17.0 2.6 -19.9 4.4 Unique
#396 Femur sin. I (C14) 44.9 16.8 2.7 -20.2 3.3 Unique
#399 Humerus dex. I (A) 44.8 16.7 2.7 -20.6 5.3 Unique
#402 Phalange, juv. II (A) 45.2 17.1 2.6 -20.6 4.1 Unique
#404 Tibia frag. I (C14) 45.1 17.1 2.6 -20.1 4.8 Unique
#408 Cranial vault I (C14) 45.3 17.0 2.7 -20.4 3.1 Unique
#409 Phalange I (C14) 44.9 17.0 2.6 -20.4 4.9 Unique
#415 Metacarpus I (C14) 45.0 17.0 2.6 -20.0 7.4 Unique
n (number of specimens) = 30 Average -20.5 6.1
N (number of individuals) = 25 to 30 1 σ 0.5 2.2
2012 D.E. Nelson, J. Heinemeier, J. Møhl, and J. Arneborg 83
the Norse diet. The pigs were simply too few, and
both horses and dogs could not be eaten without offending
dietary taboos (Egardt 1981). Nevertheless,
we have measured a few samples of each for comparative
purposes. The four pigs from the Eastern
Settlement sites (Table 9) are clearly not exclusively
terrestrial feeding animals, as both their carbon and
nitrogen isotopes indicate that they consumed significant
quantities of marine protein. Pigs are notorious
omnivorous scavengers, and we can only speculate
what these ate; perhaps their menu included the seal
offal in the Norse middens. Investigations on pigs
from the Western Isles of Scotland (Mulville et al.
2009:55), Gotland, Sweden (Kosiba et al. 2007:405),
and Orkney (Richards et al. 2006:125) indicate that
pigs’ fodder include marine sources. Actually, the
pigs from Viking Age –Early Middle Ages coastal
incorporate 52 measurements on 32 to 52 individuals,
they provide a very good first estimate for these
two species.
Having made that observation, one can also attempt
to detect patterning even within these small
ranges of values. Only one stands out: two of the
three goats from V48 have nitrogen isotope compositions
higher than those of any of the other 49
samples (see Fig. 2). This observation complements
and extends that for the cattle from this site. As these
goats were fully-grown animals, this difference cannot
be due to the suckling effect, and we can again
postulate a fertilization effect for this farm.
The pigs, horses and dogs
Judging from the zooarchaeological records,
these animals did not form a significant portion of
Table 6. The sheep: the estimated number of individuals is based on archaeological information, bone element, and biological age of the
animal. Dates are based on either radiocarbon dating (C14) or archaeological information (A).
Extract Extract Extract δ13C δ15N
Site Sample ID Bone element Period C% N% C/N (‰ v PDB) (‰ v AIR) Individual/context
Eastern Settlement
Narsaq, Ø17a
#82 Metatarsus I (C14) 44.1 15.3 2.9 -20.4 3.8 Ruin 4, by water channel,
lower layer
#83 Metatarsus sin. I (A) 44.2 15.7 2.8 -20.3 4.2 Ruin 4, by water channel,
lower layer
#84 Metatarsus I (C14) 44.1 15.3 2.9 -20.1 3.6 Ruin 4, by water channel,
lower layer
Vatnahverfi, Vatnahverfi, Ø167
#95 Metacarpus 45.2 16.2 2.8 -20.2 2.5 Unique
Igaliku, Gardar, Ø47
#281 Metatarsus dex. 43.8 14.6 3.0 -18.7 4.5 Without information
#282 Metatarsus dex. 43.8 14.8 3.0 -19.5 3.9 Without information
#283 Metatarsus dex. 44.1 14.7 3.0 -19.5 2.8 Without information
#284 Metacarpus sin. 44.2 14.0 3.2 -20.0 5.1 Without information
#285 Metacarpus 44.1 14.9 3.0 -20.1 2.9 Without information
#286 Metacarpus sin. 44.3 14.9 3.0 -19.3 4.5 Without information
#287 Metacarpus sin. 44.8 14.4 3.1 -19.2 3.9 Without information
#288 Metacarpus 44.3 14.9 3.0 -19.9 2.9 Without information
n (number of specimens) = 12 Average -19.8 3.7
N (number of individuals) = 8 to 12 1 σ 0.5 0.8
Western Settlement
Nipaatsoq, V54
#41 Metatarsus III (C14) 44.6 16.1 2.8 -19.7 4.3 Unique
#43 Metacarpus sin. I (C14) 44.0 16.0 2.8 -19.2 4.6 Unique
GUS
#62 Cornus sin. III (A) 43.7 15.8 2.8 -19.6 4.2 Unique
#64 Metacarpus dex. II or III (A) 44.4 16.3 2.7 -19.5 3.6 Unique
#65 Metacarpus dex. II or III (A) 44.8 16.2 2.8 -19.7 5.1 Unique
#105 Astragalus, sin. I (A) 44.8 16.5 2.7 -20.4 5.0 Unique
#275 Cornus sin II (A) 44.0 14.8 3.0 -20.0 2.7 Unique
#276 Cornus sin II (C14) 44.0 14.6 3.0 -19.9 4.3 Unique
#277 Pelvis sin 44.0 14.5 3.0 -19.7 2.2 Unique
#278 Metacarpus dex 44.0 14.5 3.0 -19.9 4.7 Unique
#279 Metatarsus dex 44.8 14.8 3.0 -20.1 4.0 Unique
#280 Cornus dex 43.8 15.0 2.9 -19.6 3.7 Without information
Kilaarsarfik, Sandnes, V51
#397 Tibia dist. sin. I (A) 44.4 16.8 2.6 -20.1 4.5 Unique
n = 13 Average -19.8 4.1
N = 12 to 13 1 σ 0.3 0.8
84 Journal of the North Atlantic Special Volume 3
Table 7. The goats: the estimated number of individuals is based on archaeological information, bone element, and biological age of the
animal. Dates are based on either radiocarbon dating (C14) or archaeological information (A).
Extract Extract Extract δ13C δ15N
Site Sample ID Bone element Period C% N% C/N (‰ v PDB) (‰ v AIR) Individual/context
Eastern Settlement
Igaliku, Gardar, Ø47
#270 Metacarpus sin. 44.2 14.7 3.0 -18.8 4.4 Without information
#289 Metacarpus dex. juv. 43.2 15.8 2.7 -19.1 4.3 Without information
#290 Metacarpus dex. juv. 43.0 15.5 2.8 -19.2 3.5 Without information
#291 ??? juv. 43.2 15.7 2.8 -18.8 4.8 Without information
#292 Metacarpus dex. 44.0 15.6 2.8 -18.9 6.1 Without information
n (number of specimens) = 5 Average -19.0 4.6
N (number of individuals) = 2 to 5 1 σ 0.2 1.0
Western Settlement
Niaquusat, V48
#33 Cornus III (A) 44.0 16.0 2.8 -19.8 6.5 Unique
#39 Metatarsus II (A) 44.1 15.6 2.8 -19.9 5.3 Unique
#40 Metacarpus 45.0 15.2 3.0 -20.0 7.9 Unique
Nipaatsoq, V54
#44 Metatarsus sin. III (A) 45.0 16.5 2.7 -19.7 2.6 Unique
GUS
#63 Humerus sin. 40.5 14.8 2.7 -19.2 4.2 Without information
#66 Metacarpus sin. 44.4 15.9 2.8 -19.2 4.5 Without information
#268 Cornus sin. 44.1 14.5 3.0 -19.8 2.9 Without information
#269 Humerus dex. 44.7 14.1 3.2 -19.7 2.8 Without information
#271 Pelvis sin 44.1 14.4 3.1 -19.6 2.7 Without information
#272 Humerus sin. 44.6 14.3 3.1 -20.4 5.5 Unique
#273 Femur sin II or III (C14) 44.2 14.6 3.0 -19.5 3.5 Unique
Kilaarsarfik, Sandnes, V51
#414 Metacarpus dist. II (A) 45.2 17.1 2.6 -19.2 4.0 Unique
n (number of specimens) = 12 Average -19.7 4.4
N = 8 to 12 1 σ 0.3 1.7
Figure 2. δ15 N values versus δ13 C values for sheep and goats.
2012 D.E. Nelson, J. Heinemeier, J. Møhl, and J. Arneborg 85
domestic herbivores. While the δ15N values fit well
within the range of the ruminant cattle, sheep, and
goats, the δ13C values are all ≈1‰ lower. Is this due
to their diet, or is it a result of the difference between
Ridanäs on the Swedish island of Gotland very much
resemble the Norse Greenland pigs.
Even though only a few horses were measured
(Table 10), they are slightly different from the other
Table 8. Sheep or goat: the estimated number of individuals is based on archaeological information, bone element, and biological age of
the animal. Dates are based on either radiocarbon dating (C14) or archaeological information (A).
Extract Extract Extract δ13C δ15N
Site Sample ID Bone element Period C% N% C/N (‰ v PDB) (‰ v AIR) Individual/context
Eastern Settlement
Narsaq. Ø17a
#85 Tibia sin. I (A) 44.8 15.5 2.9 -20.2 4.5 Can be from same individual as #86
#86 Femur dex. I (A) 45.4 15.8 2.9 -20.1 4.8 Can be from same individual as #85
N (number of individuals) = 1 or 2
Western Settlement
Kilaarsarfik, Sandnes, V51
#391 Phalange II (A) 44.3 17.1 2.6 -20.1 4.5 Can be from same individual as #392
#392 Humerus sin. II (A) 44.7 17.1 2.6 -19.8 3.8 Can be from same individual as #391
#393 Phalange I (A) 44.7 16.6 2.7 -19.8 2.8 Can be from same individual as #394
#394 Humerus sin. I (A) 44.9 16.6 2.7 -19.8 3.9 Can be from same individual as #393
#400 Scalpula dex. I (A) 44.6 16.9 2.6 -19.7 5.9 Unique
#403 Metacarpus II (A) 44.7 16.7 2.7 -19.7 4.7 Unique
#407 Calcaneus dex. I (A) 44.7 17.0 2.6 -19.4 3.8 Unique
#410 Tibia dex. I A) 44.5 16.8 2.6 -19.5 4.4 Unique
n (number of specimens) = 8 Average -19.7 4.2
N = 7 to 8 1 σ 0.2 0.9
Table 9. The pigs: the estimated number of individuals is based on archaeological information, bone element, and biological age of the
animal.
Extract Extract Extract δ13C δ15N
Site Sample ID Bone element C% N% C/N (‰ v PDB) (‰ v AIR) Individual/context
Narsaq, Ø17a
#80 Mandibula 44.7 15.0 3.0 -17.2 11.7 Unique
Vatnahverfi. Vatnahverfi, Ø167
#81 Tibia, dex. 43.7 15.4 2.8 -17.7 9.2 Unique
Igaliku, Gardar, Ø47
#308 Long bone 42.7 15.1 2.8 -17.2 11.6 Without information
#309 Long bone 42.9 15.5 2.8 -16.2 12.3 Without information
n (number of specimens) = 4 Average -17.1 11.2
N (number of individuals) = 3 to 4 1 σ 0.7 1.4
Table 10. The horses: the estimated number of individuals is based on archaeological information, bone element, and biological age of the
animal. Dates are based on either radiocarbon dating (C14) or archaeological information (A).
Extract Extract Extract δ13C δ15N
Site Sample ID Bone element Period C% N% C/N (‰ v PDB) (‰ v AIR) Individual/context
Western Settlement
GUS
#57 Cranial vault III (A) 44.4 16.4 2.7 -21.2 5.6 Unique
#67 Mandibula, dex. III (C14) 44.2 15.9 2.8 -21.2 4.6 Unique
#266 Astragalus 44.1 14.7 3.0 -21.2 1.3 Unique
#267 Mandible, dex. III (C14) 44.2 14.5 3.1 -21.0 3.8 Unique
#307 Mandibula, sin 43.1 15.8 2.7 -21.2 2.3 Without information
Eastern Settlement
Igaliku, Gardar, Ø47
#149 Phalange, juv. 44.2 14.9 3.0 -21.1 4.5 Unique
n (number of specimens) = 6 Average -21.2 3.7
N (number of individuals) = 5 to 6 1 σ 0.1 1.6
86 Journal of the North Atlantic Special Volume 3
sample as a whole, e.g., a sample dated as “late II or
III” will be grouped with other Period III samples.
As will be seen below, these choices do not affect the
outcome.
There are no differences in the mean Eastern
Settlement cattle δ13C or δ15N values for Periods I
and II. The two Eastern Settlement cattle of Period
III are very slightly different, but this difference is
far too small to enable any conclusions to be drawn.
We do not have the data to compare the Eastern
Settlement sheep/goats over time.
Sufficient data are at hand to make more defi
nitive statements about the Western Settlement
animals. For both the cattle and the sheep/goats, the
differences between the δ13C means for the three Periods
are at most 0.1‰, and so there was no change
for either group. While it is intriguing that the mean
δ15N values for the Western Settlement cattle do apparently
increase over the three Periods, it is evident
from the high variabilities observed that these means
mask non-random differences within the data. A
review of the data in Table 5 shows that the largest
differences are correlated to locale; in particular, the
V48 cattle are unusual. (Two of the V48 goats also
have the highest observed δ15N values in the Western
Settlement). At all Western Settlement farms, there
are some cattle with high δ15N values in the 7–9‰
range. It is clear that a large part of the variability
seen in the nitrogen data for these cattle is linked to
locale and to circumstance. There is insufficient data
here to separate these factors from any change over
time. We can only re-state that the Western Settletheir
hindgut fermentation digestive system and the
foregut system of the ruminants? Again, this observation
is interesting but based on very limited data
and is beyond the scope of this study.
Like the pigs, the dogs (Table 11) had much marine
protein in their diet. For some, their isotope ratios
approach those of Greenlandic seals (Nelson et
al. 2012a [this volume]). One from V48 is the most
distinctive in this respect. Clearly, the protein from
the terrestrial animals was too precious to waste on
the dogs. Also, marine food sources, especially fish,
deteriorate rapidly and are therefore likely to be
have been thrown to the dogs in significant quantities.
It is a common observation that dogs in association
with humans with a marine diet exhibit similar
marine isotope composition (see, e.g., Fischer et al.
2007, Noe-Nygaard 1988).
Changes over time
Can we find evidence in the isotopic data for any
changes in husbandry practices? Of the domestic
animals of dietary importance, those most likely to
be affected are the cattle, which require more care
than do the free-ranging sheep and goats. Given the
narrow ranges already noted in the previous section
for all three species, it seems unlikely that any
detectable changes did take place. Table 12 gives
the mean values for the data available for the cattle
and sheep/goats (as a group) of the Early (I), Middle
(II), and Late (III) Periods at each settlement. Those
samples which span more than one Period are
grouped with the one that most closely reflects the
Table 11. The dogs: the estimated number of individuals is based on archaeological information, bone element, and biological age of the
animal.
Extract Extract Extract δ13C δ15N
Site Sample ID Bone element C% N% C/N (‰ v PDB) (‰ v AIR) Individual/context
Niaquusat, V48
#29 Metatarsal 45.1 16.5 2.7 -14.2 13.8 Unique
#30 Pelvis 43.7 15.8 2.8 -13.2 16.6 Unique
Igaliku, Gardar, Ø47
#305 Ulna 42.8 15.2 2.8 -15.8 12.7 Without information
#306 Humerus 42.9 15.5 2.8 -14.8 14.1 Without information
n (number of specimens) = 4 Average -14.5 14.3
N (number of individuals) = 3 to 4 1 σ 1.1 1.7
Table 12. Stable isotopic averages as a function of time.
Eastern Settlement Western Settlement
Period n <δ13C> ± 1σ <δ15Ν> ± 1σ n <δ13C> ± 1σ <δ15Ν> ± 1σ
Cattle
I 5 -20.1 ± 0.4 3.8 ± 0.8 10 -20.5 ± 0.4 5.0 ± 1.5
II 4 -20.2 ± 0.2 3.5 ± 1.0 5 -20.5 ± 0.5 6.2 ± 2.8
III 1 -20.7 2.1 7 -20.3 ± 0.4 6.8 ± 2.7
Sheep and goats
I 5 -20.2 ± 0.1 4.2 ± 0.5 8 -19.7 ± 0.4 4.4 ± 0.9
II 7 -19.8 ± 0.3 4.2 ± 0.8
II or III and III 7 -19.6 ± 0.1 4.3 ± 1.7
2012 D.E. Nelson, J. Heinemeier, J. Møhl, and J. Arneborg 87
ment cattle were unusual, as compared to those in
the Eastern Settlement, and that there may be an
increase in their δ15N values over time, which could
be due to cumulative effects of throwing out refuse
or deliberate fertilization practices. Much more data
will be required to test this tentative observation.
Summary Discussion
The data obtained provide an over-view of the
isotopic compositions of the animals which formed
the basis of the Greenlandic Norse domestic economy.
As is evident from the tables of values presented
in the preceding section, the results for the different
species are consistent and definitive, and allow us to
provide detailed responses to the questions posed at
the outset. We address these questions here in turn.
For reference, Table 13 gives a summary of the mean
values for the domesticates as well as for their contemporary
wild herbivores (Nelson et al. 2012a [this
volume]).
Questions: What are the isotopic compositions of the
animals introduced by the Norse into Greenland? In
general, do these domestic herbivores have compositions
typical of herbivores in a C3 plant environment,
or are they different? How variable are these
compositions?
The data for the Norse herbivores are very similar
to those obtained for herbivores from most other
areas of the world (Kosiba et al. 2007, Müldner and
Richards 2005, Mulville et al. 2009, Noe-Nygaard
et al. 2005, Richards et al. 2006), where typical
δ13C values are around -22 to -21‰. The cattle,
sheep, goats, and horses all have the characteristic
carbon isotope composition (e.g., within the range
of about -20 ±1‰) expected for herbivores in a C3
environment or 1–2‰ more positive. This result fits
very well with that of a separate study of modern
Greenlandic plants (E. Nelson and J. Møhl, unpubl.
data) in which the mean δ13C value <δ13C> = -25.2‰
(corrected for the atmospheric impact of the Industrial
Revolution) was obtained, giving the expected
5‰ difference between an animal’s diet and its bone
collagen. For all these Greenlandic herbivores, the
observed δ13C standard deviations of ≤0.5‰ are
very small, indicating that the measurement procedures
are reliable, that there is little dietary variation
between individual animals, and that the calculated
mean for each species is a robust determination.
With some exceptions, the δ15N values for the
individual animals are also within the range observed
in other studies for herbivores in temperate
climates (see, e.g., Noe-Nygaard et al. 2005). These
exceptions, especially as is seen in the Western
Settlement cattle, suggest real differences between
animals and sites. Again, these nitrogen data mirror
those obtained for modern Greenlandic plants (ibid)
for which <δ15N> = - 0.4‰, but for which there also
were a few samples with high anomalous values.
Question: Are there differences between the domestic
species?
The mean carbon isotope data for the different
domestic herbivores and locales all fall within a
range of about 1.3‰. Of these, the important food
animals—cattle, sheep, and goats—have means
differing by ≤0.8‰. The horses may be 1‰ lower,
but as they were not a part of the human diet, that
is only of indirect interest here. This δ13C range is
so small that measurement uncertainty will become
an important consideration in more detailed comparative
analyses of the species. Even so, the small
differences are statistically significant and have also
been of practical value, as in a few instances when
the identity of a sample was challenged by the isotopic
data and zoological re-examination of the bone
resulted in re-assignment to another species. With
the exception of the Western Settlement cattle, the
mean δ15N values for the different species (Table
13) are identical within observed variation. In short,
while there are some differences observed between
species, they are very small.
Questions: How do the isotopic compositions of
the domesticates compare to those of the wild terrestrial
herbivores? Can we see evidence for natural
regional differences in the isotopes of Greenlandic
terrestrial herbivores?
As seen in Table 13, the mean values for the
domestic animals are close to those of their wild
Table 13. The average isotopic values for domestic and wild herbivores.
Species Locale Number (N) of individuals δ13C ± 1σ (‰ v PDB) δ15N ± 1σ (‰ v AIR)
Domestic
Cattle Eastern Settlement 17 to 22 -20.2 ± 0.5 3.7 ± 1.1
Western Settlement 23 to 30 -20.5 ± 0.5 6.1 ± 2.2
Sheep / goats ES & WS 32 to 52 -19.7 ± 0.4 4.1 ± 1.1
Horses ES & WS 4 to 6 -21.2 ± 0.1 3.7 ± 1.6
Wild
Musk oxen Northeast 6 -20.2 ± 0.2 2.8 ± 0.4
Hare Western Settlement 1 -20.6 3.8
Caribou Northeast 6 -19.3 ± 0.2 1.5 ± 0.5
Southwest 17 to 21 -18.2 ± 0.4 2.0 ± 0.7
88 Journal of the North Atlantic Special Volume 3
contemporaries. In particular, the δ13C means for
the cattle from both settlements are identical within
measurement variability to those of the musk oxen
from Northeast Greenland and the single hare measured
from a Western Settlement site. As the musk
oxen are the closest wild equivalent of the cattle, it
would appear that natural climatic or regional differences
have little effect on the carbon isotope values
(Nelson et al. 2012a [this volume]).
Sheep, goats, and caribou forage more selectively
than do cattle and musk oxen, and their δ13C values
suggest that they chose vegetation with a slightly
different mean value. The isotopic compositions
for the Southwest caribou reflect their consumption
of lichen (Nelson et al. 2012a [this volume]) which
other herbivores cannot easily digest. It would be
interesting to know whether sheep and goats are also
consuming and digesting small amounts of lichen, or
whether the difference from the cattle reflects a more
selective foraging of other graze and browse species
foraging.
Other than the single hare measurement, the stable
nitrogen isotopic compositions for the wild animals
are lower than those observed for the domesticates.
This is expected for the Southwest caribou,
as lichen nitrogen values are also lower than those
of the C3 plants (ibid). Is there a real difference in
δ15N between plants in the high arctic Northeast and
those in the low arctic and subarctic Southwest? We
don’t have the data to directly answer this question,
but it would appear from these results that any such
difference between these locales is only about 1‰.
With the exception of some Western Settlement
δ15N values, the isotopic data for the different
domestic species, the different sites, and the two
settlements are very homogeneous. Both isotopes
for the sheep and goats from all sites were so similar
that they were combined into one group. As these
two species were the most likely to have been left to
fend for themselves, we can argue that any natural
isotopic differences between Eastern Settlement
and Western Settlement are smaller than our measurement
resolution, and so the different climatic
regimes in which these settlements were found are
not reflected in the animals’ isotopic compositions.
Questions: Is there evidence that Norse husbandry
is reflected in the isotopic compositions of their
animals? Can we detect any differences between the
domestic animals in the two settlements which refl
ect different management practices in the subarctic
Eastern Settlement and the other low arctic Western
Settlement?
Of the domestic species of dietary importance,
the cattle are most likely to reflect any such differences,
but their carbon isotope ratios for the Eastern
Settlement and Western Settlement differ by only
0.3‰. While this difference is statistically signifi
cant, it is far too small to allow any substantive
conclusions to be drawn about differences in cattle
husbandry between Eastern Settlement and Western
Settlement.
The nitrogen data offer a first tentative indication
that Norse farming practice may have affected the
isotopic data of their animals. A possible explanation
for the unusual Western Settlement δ15N values
is that they result from fertilization of some Norse
fields. Such fertilization could either be a natural
occurrence due to animals grazing in the same areas
and gradually fertilizing the soil through their urine
and feces, as has been postulated for the caribou
greens in Southwest Greenland (Fredskild and Holt
1993, Thing 1984) or it could be anthropogenic if
the Norse were actively adding fertilizer to their hay
meadows. As mentioned above, this interpretation
seems to be confirmed by recent studies (Commisso
and Nelson 2010). The strongest evidence for this
comes from the small farm at Niaquusat W48, where
cattle with high δ15N values were noted. While this
farm was not representative of the mainstream Norse
domestic economy (Arneborg et al. 2012a [this volume]),
it is interesting to note that the isotopic results
indicate, in accordance with the archeological
evidence, that the domestic animals were confined to
a limited grazing area close to the farm, leading to
concentrated fertilization from refuse and from the
grazing animals.
Were the farmers using “Vårknipa” methods
to feed their cattle in the winters? While feeding
bushes, leaves and perhaps even horse manure to
cattle would not have a large effect on the isotopic
compositions of their bone collagen, any substantial
inclusion of marine protein (e.g., from seaweed, fish,
or seals) would leave an imprint on both isotopes. At
least, one might expect to see the practice reflected
in higher carbon and nitrogen isotope ratios for neonates
if their mothers were fed marine protein during
the winter in which the fetus was formed. The data
available here indicate that marine protein was not
a significant factor in winter-feeding of gestating
cows. While the carbon data for the neonates and
juveniles are very slightly higher than those for the
adult animals at each farm, the difference is small,
inconsistent, and not mirrored in the nitrogen data
(Tables 4, 5; Fig. 1). Any consumption of marine
protein by a gestating cow was at most a very small
part of its diet. A single animal illustrates this conclusion:
At Niaquusat W48, the Late Period fetus/
neonate with the extremely high δ15N value has the
same δ13C value as the other animals from the farm,
and so we can state with certainty that the high nitrogen
value was not the result of its mother being fed
marine protein.
Questions: Is there any evidence that the early Norse
colonists adjusted their animal husbandry to suit
2012 D.E. Nelson, J. Heinemeier, J. Møhl, and J. Arneborg 89
goats significant amounts of protein derived from
the sea, as has been done in times of need elsewhere
in far Northern Scandinavia. This statement includes
Western Settlement cattle of the Late period.
In summary, neither the carbon nor nitrogen isotope
data provide evidence for unusual adaptations
or for changes over time in the Eastern Settlement.
For the Western Settlement, the carbon isotope data
are also as expected and constant over time, while
the variable nitrogen isotope data indicate different
circumstances from those to the South. Although the
nature of these differences is not known, there is no
evidence in the isotopic data for any change with
time.
The few pigs form an exception to (and a confirmation
of) these statements, as both their carbon and
nitrogen isotope ratios clearly show that their diet
included marine protein. Was this a conscious Norse
adaptation to Greenlandic conditions or did the pigs
work this out for themselves? We cannot say, but
as pigs were an early curiosity rather than a dietary
staple, this interesting observation has no impact
on the analyses of the Greenlandic Norse dietary
economy.
Question: To what extent can we define characteristic
carbon and nitrogen isotope end-members for the
terrestrial protein consumed by the Norse?
Greenlandic conditions? Are there any long-term
differences for the domesticates in either of the two
settlements which might reflect changing practice or
changing climate?
The isotopic data for the primary Norse domesticates
in the Eastern Settlement provide no indication
of unusual adaptations to suit Greenlandic circumstances.
Both the carbon and nitrogen isotope data
for these domesticates are as expected for herbivores
consuming the local plants. The same holds true
for the carbon isotope data for Western Settlement
animals. The only evidence for differences in farming
practice is that given by the high δ15N values for
some of the Western Settlement cattle and goats, especially
those at V48. We noted that higher nitrogen
values occur in animals from the Early through to the
Late settlement Periods, and that there may perhaps
have been an increase over time in the values at V48.
Do these differences reflect early or later changes
in field management in the Western Settlement?
Differences between the larger and smaller farms?
Natural differences in the environment? More data
will be required to answer these questions, but we
can speculate that the Western Settlement animal
data may reflect an outcome of field fertilization.
The available data indicates that the Norse farmers
were not winter-feeding their cattle, sheep, or
Figure 3. Distribution of δ13 C values.
90 Journal of the North Atlantic Special Volume 3
form a homogeneous whole, and the δ13C mean value
and standard error are thus very well characterized
for both settlements at <δ13C> = -20.01 ± 0.06‰,
i.e., with a precision which is well beyond the measuring
accuracy.
The situation may not be quite so clear-cut for a
δ15N mean value, as even for the herbivores of interest
here; these measures are not necessarily normally
distributed about a central mean. Young suckling
animals have higher values, as will those consuming
unusual fodder, such as that from fertilized
fields. How homogeneous are the nitrogen isotope
data for these animals? Figure 4 plots the measured
values for all the cattle, sheep, and goats from both
settlements. Overlaying these data is a calculated
Gaussian distribution with a mean and standard deviation
of 4.0 ± 1.0‰. With the exception of a few
Western Settlement cattle, this mean and standard
deviation describe the observed distribution well. To
a good first approximation then, the mean nitrogen
isotope ratio of 4.0 ± 0.1‰ (at 1 standard error) can
be applied to the primary domesticates of Norse
Greenland, if it is borne in mind that there could be
unusual scatter in the values for human consumers in
the Western Settlement.
We have a clear answer to this question. The
isotope data obtained here for all Norse domestic
animals of dietary importance form a very homogeneous
data set. While there is evidence for very
small isotopic differences between the cattle as
one group and the sheep and goats as another, and
perhaps even between the cattle in the different
settlements, we can define meaningful isotope diet
mean values for both carbon and nitrogen which are
applicable to the domesticates as a whole. Figure 3
shows the δ13C results for the domestic species of
dietary importance plotted as a histogram. The mean
and standard deviation for the entire data set (cattle,
sheep, and goats) is <δ13C> = -20.01 ± 0.57‰. While
there is some internal patterning within this food
resource (e.g., any humans who ate only beef would
have very slightly different δ13C values than those
who ate only mutton), the animal data as a whole
are normally distributed. The solid curve drawn
over the data in Figure 3 is the calculated Gaussian
distribution with the observed average and standard
deviation. The good fit is obvious.
For humans randomly sampling from this resource,
it is the standard error that is of importance
in dietary calculations, as a single human will have
consumed protein from many more individual animals
than those represented in this study. These data
Figure 4. Distribution of δ15 N values.
2012 D.E. Nelson, J. Heinemeier, J. Møhl, and J. Arneborg 91
Literature Cited
Amorosi, T., P.C. Buckland, K.J. Edwards, I. Mainland, T.
McGovern, J.P. Sadler, and P. Skidmore. 1998. They
did not live by grass alone: The politics and palaeocology
of animal fodder in the North Atlantic region.
Environmental Archaeology 1:41–54.
Andersen, G.J., J. Heinemeier, H.L. Nielsen, N. Rud, M.S.
Thomsen, S. Johnsen, Á.E. Sveinbjörnsdóttir, and A.
Hjartarson. 1989. Ams C-14 Dating on the Fossvogur
sediments, Iceland. Radiocarbon 31(3):592–600.
Arneborg, J., J. Heinemeier, N. Lynnerup, H.L. Nielsen,
N. Rud, and Á.E. Sveinbjörnsdóttir. 1999. Change of
diet of the Greenland Vikings determined from stable
carbon isotope analysis and C-14 dating of their bones.
Radiocarbon 41(2):157–168.
Commisso, R.G., and D.E. Nelson. 2010. Stable nitrogen
isotopic examination of Norse sites in the Western
settlement of Greenland. Journal of Archaeological
Science 37:1233–1240.
Malasse, M., I. Mainland, and M.P. Richards. 2009.
Stable Isotope evidence for seasonal consumption of
marine seaweed by modern and archaeological sheep
in the Orkney archipelago (Scotland). Environmental
Archaeology 14(1):1–14.
Egardt, B. 1981. Hästkött. Kulturhistorisk Leksikon for
Nordisk Middelalder 7:280–281.
Enghoff, I.B. 2003. Hunting, fishing and animal husbandry
at The Farm Beneath The Sand, Western Greenland.
Meddelelser om Grønland – Man & Society 28. The
Danish Polar Center, Copenhagen, Denmark. 104 pp.
Fischer, A., J. Olsen, M. Richards, J. Heinemeier, Á.E.
Sveinbjörnsdóttir, and P. Bennike. 2007. Coastinland
mobility and diet in the Danish Mesolithic and
Neolithic: Evidence from stable isotope values of
humans and dogs. Journal of Archaeological Science
34:2125–2150.
Fredskild, B., and S. Holt. 1993. The West Greenland
“greens”: Favourite caribou summer grazing areas and
late Holocene climatic changes. Geografisk Tidsskrift
93:30–38.
Fogel, M.L., N. Tuross, and D.W. Owsley. 1989. Nitrogen
isotopes tracers of human lactation in modern and
archaeological populations. Annual Report of the Director,
Carnegie Institution of Washington Yearbook
89:111–117.
Hansen, B.U. 2001. The Climate. Pp. 66–83, In E.W. Born
and J. Böcher. (Eds). The Ecology of Greenland. Atuakkiorfi
k, Nuuk, Greenland. 429 pp.
Kosiba, S.B., R.H. Tykot, and D. Carlsson. 2007. Stable
isotopes as indicators of change in the food procurement
and food preference of Viking Age and Early
Christian populations on Gotland (Sweden). Journal of
Anthropological Archaeology 26(3):394–411.
McGovern, T.H., 1985. Contribution to the paleoeconomy
of Norse Greenland. Acta Archaeolgica 54:73–122.
Muldner G., and M.P. Richards. 2005. Fast or feast: Reconstructing
diet in later medieval England by stable
isotope analysis. Journal of Archaeological Science
32(1):39–48.
Mulville, J., R. Madwick, R. Stevens, T. O´Connell, O.
Craig, A. Powell, N. Sharples, and M.P. Pearson. 2009.
Isotopic Analysis of Faunal Material from South Uist,
Western Isles, Scotland. Journal of the North Atlantic
2:51–59.
Conclusions
Stable isotope measurements of bones of the
domestic animals from the two Norse settlements
in Greenland have provided answers to the basic
technical questions underlying application of stable
isotope analyses to dietary studies. For the domestic
species of importance to Norse diet, it is possible to
clearly define characteristic mean values for both
δ13C and δ15N of bone collagen. While there are
small isotopic differences between species and there
may be small differences between locales, these are
not large enough to impact dietary reconstruction for
the humans who consumed these animals.
The results also provide archaeological information
on Norse animal husbandry in Greenland. First,
we find no evidence that the Norse were in general
required to adopt any unusual farming practices to
maintain their cattle, sheep, and goats. Second, while
the small differences between the animals in the subarctic
Eastern Settlement and the low arctic Western
Settlement may indicate slight differences in practice,
it will require detailed studies to further investigate
this possibility. In particular, there is tantalizing
evidence that some of the Western Settlement animals
reflect direct or indirect field fertilization.
Third, the domesticates of marginal or no dietary
importance had isotopic compositions unlike
the other groups. It is evident that marine protein
formed a significant and sometimes dominant part of
the diets of the pigs and dogs. Horses had isotopic
compositions a little different from those of the other
herbivores, and it is not clear whether this is due to
their fundamentally different digestive system or
whether they fed on a slightly different selection of
plants.
Last, other than the possibility of fertilization effects,
we can find no evidence for any chronological
changes in the isotopic compositions of the animals.
Our data include measurements on animals from
the early settlement period through to the mid-14th
century, by which time the people in the Western
Settlement are thought to have been leaving. Present
reconstruction of settlement abandonment places
emphasis on the impact of worsening climate on the
Norse life-style and on their apparent unwillingness
to change from an economy based on animal husbandry
to one based on hunting. If this were the case,
one might have expected to see evidence for change
in the animals’ isotopic compositions, as one would
expect that the Norse would make increasingly desperate
attempts to keep their domestic stock and thus
their life-style in good health. Either the isotopic
method cannot detect any such changes that were
made, or the Norse simply gave up without such a
struggle, or the emphasis on climate change is exaggerated
in present reconstruction.
92 Journal of the North Atlantic Special Volume 3
Mørkved, B., 1996. Vårknipa i nordnorsk tradisjon, med
hovedvekt på forholdene i Troms og Loftoen/Vesterålen.
Polarflokken 20(1):9–18.
Noe-Nygaard, N., 1988. δ13C-values of dog bones reveal
the nature of changes in man’s food resources at the
Mesolithice-Neolithic transition, Denmark. Chemical
Geology (Isotope Geoscience Section) 73:87–96.
Noe-Nygaard, N., T.D. Price, and S.U. Hede. 2005. Diet
of aurochs and early cattle in southern Scandinavia:
Evidence from 15N and 13C stable isotopes. Journal of
Archaeological Science 32(6):855–871.
Richards M.P., B.T. Fuller, and T.I. Molleson. 2006. Stable
isotope palaeodietary study of humans and fauna from
the multi-period (Iron Age, Viking and Late Medieval)
site of Newark Bay, Orkney. Journal of Archaeological
Science 33(1):122–131.
Sveinbjörnsdóttir Á.E., J. Heinemeier, J. Arneborg, N.
Lynnerup, G. Ólafsson, and G. Zoëga. 2010. Dietary
reconstruction and reservoir correction of 14C dates
on bones from pagan and early Christian graves from
Iceland. Radiocarbon 52(2–3): 682–696.
Thing, H. 1984. Feeding ecology of the West Greenland
caribou (Rangifer tarandus groenlandicus) in the
Sisimiut – Kangerlussuaq region. Danish Review of
Game Biology 12(3):1–53.