Journal of the North Atlantic
T.D. Price and E. Naumann
2015 Special Volume 7
88
Introduction
For the investigation of the early Viking colonists
of the North Atlantic islands, our focus in this special
volume is on Iceland and Greenland where there
are significant numbers of preserved and excavated
burials available for study. Questions concerning the
origins of the early inhabitants of these two major
centers of Norse settlement in the Atlantic remain unanswered
and the raison d’être for our investigations.
There are few skeletal remains from the Faroe Islands
and none from the Viking settlement at L’Anse aux
Meadows in Newfoundland. There are Viking burials
on the Shetlands, Orkneys, and the Western Isles.
In terms of initial settlement, however, these islands
were occupied before the arrival of the Norse. We
also have some data from Dublin and the Isle of Man
related to the Viking occupation, although too little
is known isotopically about much of the Republic of
Ireland, Northern Ireland, and mainland Scotland.
There are a number of published studies of Viking
graves and mass burials in Britain.
We also have a substantial data set from Norway—
the primary homeland for the Viking expansion
in the North Atlantic—for comparison with
these colonies. We have some baseline and human
data from Sweden and Denmark, but these areas seem
less relevant as places of origin. It is also the case that
the other important homelands for the settlers of the
North Atlantic lie in northern Britain and Ireland. The
strontium and oxygen isotopic signatures of these
areas are almost identical to those of Norway. For this
reason, isotope proveniencing is unable to distinguish
these areas. We will focus on Norway with the understanding
that northern Britain and Ireland are also
included in this definition of homeland.
We have measured 200 samples for strontium
isotopes from Norway. This total includes 144 humans
and 56 floral and faunal samples. Biological
samples including the plants and animals are discussed
in Price et al. (2015 [this volume]). The very
old rocks of the FennoScandinavian Shield and the
Caledonides Province in Norway generally manifest
high 87Sr/86Sr values ranging from 0.715 to 0.760 and
even higher. Bioavailable values from floral and faunal
samples, however, are generally lower and range
from 0.707 to 0.725 with an average around 0.713.
The impact of sea spray and rainfall and marine food
sources in coastal areas is likely substantial and reduces
the terrestrial 87Sr/86Sr values in human tooth
enamel in many places.
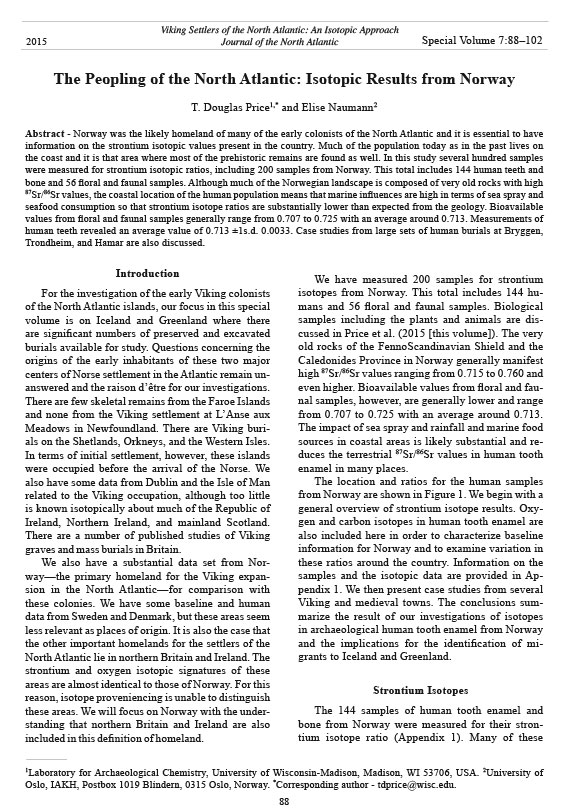
The location and ratios for the human samples
from Norway are shown in Figure 1. We begin with a
general overview of strontium isotope results. Oxygen
and carbon isotopes in human tooth enamel are
also included here in order to characterize baseline
information for Norway and to examine variation in
these ratios around the country. Information on the
samples and the isotopic data are provided in Appendix
1. We then present case studies from several
Viking and medieval towns. The conclusions summarize
the result of our investigations of isotopes
in archaeological human tooth enamel from Norway
and the implications for the identification of migrants
to Iceland and Greenland.
Strontium Isotopes
The 144 samples of human tooth enamel and
bone from Norway were measured for their strontium
isotope ratio (Appendix 1). Many of these
The Peopling of the North Atlantic: Isotopic Results from Norway
T. Douglas Price1,* and Elise Naumann2
Abstract - Norway was the likely homeland of many of the early colonists of the North Atlantic and it is essential to have
information on the strontium isotopic values present in the country. Much of the population today as in the past lives on
the coast and it is that area where most of the prehistoric remains are found as well. In this study several hundred samples
were measured for strontium isotopic ratios, including 200 samples from Norway. This total includes 144 human teeth and
bone and 56 floral and faunal samples. Although much of the Norwegian landscape is composed of very old rocks with high
87Sr/86Sr values, the coastal location of the human population means that marine influences are high in terms of sea spray and
seafood consumption so that strontium isotope ratios are substantially lower than expected from the geology. Bioavailable
values from floral and faunal samples generally range from 0.707 to 0.725 with an average around 0.713. Measurements of
human teeth revealed an average value of 0.713 ±1s.d. 0.0033. Case studies from large sets of human burials at Bryggen,
Trondheim, and Hamar are also discussed.
Viking Settlers of the North Atlantic: An Isotopic Approach
Journal of the North Atlantic
1Laboratory for Archaeological Chemistry, University of Wisconsin-Madison, Madison, WI 53706, USA. 2University of
Oslo, IAKH, Postbox 1019 Blindern, 0315 Oslo, Norway. *Corresponding author - tdprice@wisc.edu.
2015 Special Volume 7:88–102
Journal of the North Atlantic
T.D. Price and E. Naumann
2015 Special Volume 7
89
samples were measured in the hope of obtaining
baseline, bioavailable information. It is certainly the
case that some of these individuals had moved from
their birthplace to the place of burial and are not
local. Some of the domestic animals measured for
baseline information may also have been taken to
market or moved for other reasons. Nevertheless, the
goal was to obtain an indication of the range of values
in Norway in general and in some of the towns
and places that may have been the original homes of
the settlers and colonists that spread across the North
Atlantic.
Variability in strontium isotope ratios in human
tooth enamel in Norway is pronounced. The range
of 87Sr/86Sr for the 144 samples is 0.7075–0.7317,
with a mean of 0.7125 and standard deviation of ±
0.0033. A bar graph of these data in rank order is presented
in Figure 2. All but 11 of the human samples
Figure 1. Strontium isotope ratios from human tooth enamel from Norway.
Journal of the North Atlantic
T.D. Price and E. Naumann
2015 Special Volume 7
90
fall between 0.709 and 0.718. There are four values
below 0.709 and five values above 0.720. The two
lowest values, 0.7075 and 0.7076, are an individual
from Larvik (Vestfold) and a 25-year-old female
from West Norway (Gulen, Sogn), both likely born
in Iceland. There is very little overlap between
the 87Sr/86Sr values from Norway and those from
Iceland, making the identification of local and nonlocal
individuals on Iceland rather straightforward.
The two other low values at 0.7083 and 0.7087 may
well be migrants to Norway from elsewhere, given
the very rare occurrence of values below 0.709.
There are four rather segregated values between
0.720 and 0.722 that may represent the maximum
values for humans born in Norway. There is one
higher value in the data set at 0.7317, but it is so distinct
from the other values and so high that this was
very likely an individual born in Greenland, possibly
in the Western Settlement, who migrated to Norway.
The map of Norway with isotope data (Fig. 1)
provides information on the distribution of human
samples and the range of variation in 87Sr/86Sr values.
When there was more than one sample from a
site, values were averaged. The human remains may,
of course, be non-representative if they are non-local
individuals, i.e., moved to the place of burial from
elsewhere or if diets included a substantial amount
of food from the sea.
Several patterns emerge from the distribution of
human values. It is clear that a number of the lower
values from Norway are found in the coastal area
where marine diets may have been prevalent and
sea-spray effects most pronounced. These lower values
are also noticeable in the Oslo fjord area where
the glacial moraine and marine sediments may contribute
to values around 0.709-0.710. Inland areas in
general show a much higher average 87Sr/86Sr value.
At the same time, at least virtually all of the population
on the west coast of Norway lived along the
sea. The general pattern of lower values in coastal
areas is strong. A number of higher values are also
found along the coast, and in several cases in close
proximity to lower ratios. These higher values might
represent either individuals born inland who moved
to coastal areas or individuals who did not consume
a large proportion of marine foods in their diet.
A histogram of these same data is also informative
and provides a sense of the relative abundance
of different ratios in Norway (Fig. 3). There are
several modes in the distribution—0.7105, 0.712,
0.713, 0.715, and 0.7175—that may characterize the
major bioavailable baseline values for Norway. Although
there are modes, it is also clear that the ratios
overlap among all of these central points with the
possible exception of the values around 0.7175. It is
also important to remember that the consumption of
marine foods, and sea spray and rainfall in coastal
areas, will dampen higher strontium isotope ratios,
shifting higher values lower.
Oxygen Isotopes
The δ18OPDB data from human tooth enamel in
Norway also exhibits a wide distribution of values.
The mean of the 87 measurements is -5.1‰ ± -1.3
with a range from -1.42‰ to -7.72‰. A histogram of
these values is shown in Figure 4.
The extreme values of -7‰ and -1‰ reflect water
VSMOV values of -11‰ and -1‰, respectively.
The -1‰ value is enigmatic, very rare anywhere in
Figure 2. Bar graph of ranked 87Sr/86Sr from 144 samples of human tooth enamel from Norway .
Journal of the North Atlantic
T.D. Price and E. Naumann
2015 Special Volume 7
91
Europe, and may be an aberrant
value; it is shown to be an outlier
distinct from the other values on
the histogram. The very negative
oxygen values should indicate an
origin in an area from the westcentral
coast of Norway across
to the Oslo fjord area in a band
perhaps 200 km wide north–south,
based on comparable values in
modern precipitation (see Price et
al. 2015 [this volume]:fig. 19).
Values for enamel carbonate
have been reported for a number
of locations in the study area, and
some of this information is summarized
in Table 1. These samples
include some non-local individuals
at almost every site. Nevertheless
the mean value for δ18Oenamel
can provide some indication of
expected local ratios. The pattern
is as expected from the rainfall
values, with somewhat higher average
values found in more northerly
Scandinavia. Values more
negative than -5.0‰ are seen in
parts of Sweden (Fäslegården) and
at Hamar and Trondheim in Norway.
Sites like Bryggen in modern
Bergen, Birka outside Stockholm,
and Kopparsvik on the island of
Gotland have values more positive
than -5.0‰. Uppåkra, outside
of modern Lund, has an average
value of -5.0‰. Values in southern
Sweden, Denmark, and northern
Germany generally average between
-4.0‰ and -4.5‰ across a
broad area. Values on other Baltic
islands (Kopparsvik on Gotland
and Ndr. Grødbygård on Bornholm)
average -4.7‰ and -4.9‰,
respectively.
A plot of δ18O vs. 87Sr/86Sr from
Norway (Fig. 5) reveals a generally
negative trend with a correlation
coefficient of r = 0.488 (n = 55, significant
at 95%). This correlation
records a relationship between the
variables in which more negative
oxygen values are found with more
positive strontium values. This relationship
in part reflects the lower
strontium values along the coasts
Table 1. Oxygen isotope ratios (δ 18Oenamel ‰) in human tooth enamel from archaeological
sites in northern Europe.
Site Country n Min Max Mean ± sd Source
Hamar Norway 17 -7.7 -4.9 -6.3 ± 0.8 Unpublished
Bryggen Norway 15 -5.3 -3.2 -4.3 ± 0.7 Unpublished
Trondheim Norway 9 -7.6 -4.5 -6.0 ± 1.1 Unpublished
Birka Sweden 29 -7.4 -2.2 -4.9 ± 1.2 Unpublished
Fäslegården Sweden 42 -10.3 -4.2 -8.1 ± 1.5 Sjögren et al. 2009
Kopparsvik Sweden 44 -6.4 -2.5 -4.7 ± 1.1 Unpublished
(Gotland)
Uppakra Sweden 10 -6.8 -3.3 -5.0 ± 0.9 Price 2013
Sebbersund Denmark 7 -4.7 -3.3 -4.0 ± 1.5 Price et al. 2012
Trelleborg Denmark 41 -5.8 -1.7 -4.4 ± 0.7 Price et al. 2011
Galgedil Denmark 34 -6.0 -2.5 -4.2 ± 0.7 Unpublished
Ndr. Grodbygaard Denmark 36 -6.4 -3.6 -4.9 ± 0.6 Price et al. 2013
(Bornholm)
Haithabu Germany 53 -6.8 -2.7 -4.0 ± 0.8 Unpublished
Figure 4. Histogram of 87 δ 18O values for human enamel from Norway.
Figure 3. Histogram of 144 enamel 87Sr/86Sr values from Norway.
Journal of the North Atlantic
T.D. Price and E. Naumann
2015 Special Volume 7
92
due to marine effects. Strontium isotope ratios are
generally higher inland where oxygen isotope ratios
may be somewhat lower. There are two values below
-7‰, and they have high strontium values (0.713
and 0.718, respectivley). Both of these samples are
from Hamar in eastern Norway where δ18OPBD values
are expected to be between -7‰ and -9‰.
It is important to reiterate that most of the southwest
coast of Norway, from Stavanger to Trondheim
has predicted δ18OVSMOV values between -6‰ and
-7‰ for annual precipitation. This is the region from
which the original settlers of Iceland and other parts
of the North Atlantic were said to have come in the
Icelandic Sagas. Converting the enamel δ18OPDB values
to δ18OVSMOV yields a value of -6.4‰ (Chenery
et al. 2012), which fits very well with the predicted
values for precipitation in this area. Thus, we would
expect that individuals from Norway for the most
part would have δ18OPDB in human enamel between
-2.5‰ and -6.5‰.
Carbon Isotopes
The measurement of carbon isotope ratios in
bone collagen is well known in archaeology from
the study of marine resources and C4 plants in human
diets (e.g., Schoeninger and DeNiro 1982, Tauber
1981, van der Merwe and Vogel 1978). The method
has been in use for a number of years and is well
established. Carbon also is present in the mineral, or
carbonate, portion of bone and tooth enamel, where
it too contains information on diet (e.g., Sullivan and
Krueger 1981), although there are potential problems
with contamination.
In this study, carbon isotope ratios were measured
in the apatite mineral in tooth enamel (δ13Cen).
This tissue provides different information on diet
than bone collagen. Tooth enamel—and the carbonate
and phosphate minerals where carbon is bound—
forms during childhood. Bone collagen provides a
record of adult diet; tooth enamel is a record of the
diet of early childhood. Values for δ13Cen vary from
approximately 1.0‰ to -18.0‰.
Experimental studies have shown that collagen
carbon comes largely from dietary protein, while
apatite carbon more accurately reflects the isotopic
composition of the total diet (Ambrose and Norr
1993). Protein-poor foods will be reflected in carbon
isotopes in carbonate when consumed in even small
amounts, whereas they will be reflected in collagen
only when consumed in sizeable proportions (Harrison
and Katzenberg 2003).
The carbon isotope ratios from human enamel
for 87 Norwegian burials have a mean of -14.7‰ ±
1.3 with a range from -11.25‰ to -17.31‰. A histogram
of the distribution of these values is provided
in Figure 6. These values show
a rather continuous distribution
between -15.5‰ and -13.5‰
reflecting variation in the childhood
diets of the Norwegian
population with more to less
marine foods.
Comparison of the mean
δ13C value at several Norwegian
sites with other locations across
Scandinavia and northern Germany
(Table 2) documents a
strong similarity among these
carbon isotope ratios. There
is no clear pattern of variation
among these sites. The diet
of the overall area appears to
be largely terrestrial although
some of the variation is likely
due to marine foods in the diet.
There is convincing evidence
that the consumption of
marine foods, especially fish,
increased substantially in northern
Europe between the late
Iron Age and the end of the
Middle Ages. Barrett and Rich-
Figure 5. Scatterplot of δ18O vs. 87Sr/86Sr for 55 samples of human tooth enamel
from Norway.
Journal of the North Atlantic
T.D. Price and E. Naumann
2015 Special Volume 7
93
-21.1‰. The percentage of seafood in the coastal
diets was inferred to be on the order of 75%, while
the values for the inland population were thought to
reflect a diet with less than 10% marine resources.
Case Studies
We can look at isotopic variation in Norway in
more detail by examining localities where a number
of individuals from a single cemetery or community
have been analyzed. There are three places of interest:
Trondheim, Bryggen, and Hamar. The remains
from Trondheim come from two medieval cemeteries.
The samples form Bryggen, the medieval town
in modern Bergen, come from three burial grounds
there — Nykirken, Lille Ovregt, and Bryggen itself.
Hamar refers to a medieval
churchyard in the interior town
of the same name. Information on
the number of samples and mean
and s.d. for 87Sr/86Sr for burials
from these sites appears in Table
3. Also in this table are measurements
on samples of pig bones
from Bryggen for comparison
with the human remains. The s.d.
for these samples provides some
additional information. The two
coastal towns, Trondheim and
Bryggen, have higher standard
deviations. Hamar, an inland location,
has a relatively low s.d.
and a value close to the Bryggen
pigs. The distribution of data for
each location is not normal. The
three locations are discussed in
detail below.
Bryggen
In the case of Bryggen, the
16 pigs have a mean value of
0.7111 that provides a terrestrial
bioavailable baseline for the medieval
town. Among the humans,
the mean is slightly higher at
0.7121 for 22 samples with a s.d.
of ± 0.004. A graph of the ranked
87Sr/86Sr values for human enamel
is shown in Figure 7. These values
are highly variable and appear to
confirm the archaeological and
historical evidence that Bryggen
was a major destination for people
from elsewhere in Norway and
ards (2004) analyzed collagen carbon isotope ratios
in 54 burials from northern Scotland and the Orkney
Islands. Significant fish consumption appeared in the
Viking Age (9th to 11th centuries AD), followed by a
peak in marine protein consumption from approximately
the 11th to the 14th centuries AD, particularly
among men, after which the importance of fish in the
diet returned to Viking Age levels.
Evidence for a substantial difference between
coastal and inland diets in early medieval Norway
comes from another study of carbon isotopes in
bone collagen (Johansen et al. 1986). Burials from
the coastal site of Træna (Nordland) had a range of
δ13Ccol values between -15.7‰ and -19.0‰, while
bone samples from the inland site of Heidal (Oppland)
exhibited values ranging from -19.9‰ to
Table 2. δ 13C values (‰) in human enamel from sites across Scandinavia with n, minimum,
maximum, mean and 1 sd.
Site Country n Min Max Mean ± sd Source
Hamar Norway 19 -15.0 -11.2 -13.5 ± 1.2 Unpublished
Bryggen Norway 24 -16.9 -11.3 -14.7 ± 1.7 Unpublished
Trondheim Norway 9 -16.1 -14.5 -15.5 ± 0.6 Unpublished
Birka Sweden 29 -16.3 -14.0 -15.2 ± 0.6 Unpublished
Fäslegården Sweden 42 -15.5 -13.4 -14.4 ± 0.6 Sjögren et al. 2009
Kopparsvik Sweden 44 -16.8 -10.2 -14.5 ± 1.4 Unpublished
(Gotland)
Uppakra Sweden 10 -15.8 -13.9 -14.5 ± 0.5 Price 2013
Sebbersund Denmark 7 -15.7 -12.0 -13.5 ± 1.4 Price et al. 2012
Trelleborg Denmark 41 -15.5 -12.8 -14.0 ± 0.7 Price et al. 2011
Galgedil Denmark 29 -15.5 -12.8 -14.7 ± 0.4 Unpublished
Ndr. Grodbygaard Denmark 36 -15.3 -9.4 -13.6 ± 1.2 Price et al. 2013
(Bornholm)
Haithabu Germany 53 -16.9 -11.3 -14.4 ± 0.1 Unpublished
Figure 6. Histogram of δ13C values for human enamel from Norway.
Journal of the North Atlantic
T.D. Price and E. Naumann
2015 Special Volume 7
94
was -4.4‰ ± 0.8 with a range from -3.0‰ to -5.8‰.
Carbon isotope ratios averaged -14.7‰ ± 1.2, with
values from -13.7‰ to -16.9‰. No particular pattern
or unusual value was noted in these data.
Hamar
Medieval Hamar was a small market center
(kaupang) and the only inland town in Norway, located
some 100 km north of Oslo. Hamar kirke was
the medieval cathedral and churchyard in the town
and the location of the bishop’s palace. The inhabitants
of this small town lived a somewhat rural life,
while the high-status members of the ecclesiastical
community enjoyed a more urban status (Bagge
1998). Archaeological investigations around the
medieval cathedral ruins at Hamar in the 1990s (e.g.,
Reed 1998) have resulted in well-documented skeletal
material, comprising the remains of more than
1000 individuals (Sellevold 1991, 1996).
During the Christian Middle Ages, the burial
customs were rather uniform and grave goods were
few (Sellevold 1996). Status differences among
the dead are not readily apparent. It is not known
Northern Europe. There is one low value (0.7083),
a series of 12 samples with similar values around
0.710, and then distinct change in the curve of the
line as values increase rapidly with much more
variation present. The group of 12 individuals with
similar values around 0.710 were perhaps members
of the local Bergen population. Their 87Sr/86Sr values
are very close to the pigs. The higher human values
may represent either diets with less marine intake
or individuals who grew up away from the coast in
the interior areas of western Norway (or elsewhere)
and moved to Bryggen. Because the values are quite
high, they are likely Norwegian in origin.
Oxygen and carbon isotope ratios were also measured
on 24 Bryggen samples. The mean δ18O value
Figure 7. Ranked 87Sr/86Sr values from 21 human enamel samples from Bryggen.
Table 3. 87Sr/86Sr mean and s.d. for Viking and Medieval human
and pig samples from three locations in Norway.
Site n Mean s.d.
Trondheim 10 0.7155 ± 0.007
Hamar 19 0.7148 ± 0.002
Bryggen 22 0.7121 ± 0.004
Bryggen Pigs 16 0.7111 ± 0.002
Journal of the North Atlantic
T.D. Price and E. Naumann
2015 Special Volume 7
95
whether the Hamar cathedral cemetery was used as
a parish churchyard for the Hamar market town, or
whether it was mainly reserved for the ecclesiastical
community associated with the bishop’s palace and
the cathedral (Sellevold 2001). Bioarchaeological
studies have revealed certain differences in skeletal
morphology that may be attributed to status (Sellevold
2001).
Strontium, oxygen, and carbon isotopes were
measured on samples of human tooth enamel from
the cathedral cemetery Appendix 1. There is only one
female and two unidentified individuals among the
males in the sample set. The largely male 87Sr/86Sr
values for 18 samples had a mean ± s.d. of 0.7150 ±
0.002 with a range between 0.7112 and 0.7178. A bar
graph of these ranked values is shown in Figure 8.
There is one lower value at 0.7112 and then a generally
continuous increase from 0.7123 to 0.7147. This
range represents a fairly narrow degree of variation in
the strontium isotope ratios. There is no baseline bioavailable
data from the Hamar area, so it difficult to
identify locals and non-locals from the strontium isotope
ratios. On the other hand, given the high 87Sr/86Sr
values for the interior geology of Norway and the
rather continuous range of values from Hamar kirke,
it may be that most of the individuals are from the local
region. The one individual with a particularly low
value may be from elsewhere in Norway.
The 19 δ18O values from Hamar have a mean
and standard deviation of -6.3‰ ± 0.8 with a range
from -4.9‰ to -7.7‰. A plot of 87Sr/86Sr against δ18O
(graph not shown) provides little information for
identifying non-locals.
Carbon isotope ratios for 17 samples at Hamar
average -13.5‰ ± 1.2 with a range from -11.2‰
to -15.0‰ and do show some interesting patterning
when cross-plotted with strontium (Fig. 9). It is
important to remember in this case that the range of
carbon isotope ratios in enamel varies with marine
foods in the diet such that more positive enamel values
indicate a higher marine component. In Norway,
most values for δ13Cenamel fall between -16‰ and
-13‰. For the Hamar data, there are 5 individuals
greater than -13‰ and four more above -14‰, values
that reflect a more marine diet. These individuals
were likely not born in Hamar and probably moved
here during their lifetimes.
For comparison, δ13C values from human enamel
from sites across Scandinavia are listed in Table 3
with n, minimum, maximum, mean, and 1 sd. Mean
values from the sites range between -15.5‰ at
Trondheim to -13.5‰ at Hamar and Sebbersund in
northern Denmark. The values are generally very
similar among the sites and likely reflect a diet of
largely terrestrial domestic foods. More positive
values should indicate a larger proportion of marine
Figure 8. Bar graph of ranked 87Sr/86Sr values from enamel samples from Hamar Kirke, Norway .
Journal of the North Atlantic
T.D. Price and E. Naumann
2015 Special Volume 7
96
Trondheim
Samples of human tooth enamel from Trondheim
come from excavations of two medieval cemeteries
in the center of the city, at Sondregatan (8 samples)
and the Library (2 samples). The ten samples together
have a mean 87Sr/86Sr of 0.7155 ± 0.007,
with a range from 0.7096 to 0.7317. A bar graph of
ranked values is shown in Figure 11. Values are wide
ranging in both cemeteries. Baseline 87Sr/86Sr is difficult
to determine in such cases, but it would appear
likely that the values around 0.710 are those of local
individuals with a diet high in seafood and that the
higher values reflect non-local persons from terrains
with higher strontium isotope ratios.
The 0.731 individual has the highest
value recorded in Norway, far greater
than any other, and could well be a
migrant from Greenland to Norway.
Carbon and oxygen isotopes were
also measured on 9 of these samples
from Trondheim. The carbon isotope
ratios average -15.5‰ ± 0.6 with a
narrow range from -14.5‰ to -16.1‰,
directly in the middle of the distribution
for Norway and typical for coastal
values. Plots of carbon isotopes vs.
strontium and oxygen were not enlightening
(graphs not shown).
The oxygen isotopes have a mean
of -6.0‰ ± 1.1 with a range from -4.5‰
to -7.6‰. A plot of 87Sr/86Sr and δ18O
values for the 9 enamel samples from
Trondheim is intriguing (Fig. 12).
There appear to be three groups of
samples: (1) 2 samples with low strontium
ratios and δ18O near -4.5‰, (2) 4
samples with varied 87Sr/86Sr and
δ18O just above -6‰, and (3) 3
samples with mid-range 87Sr/86Sr
and d18O between -7‰ and
-8‰. These three groups may
represent three different places
of origin for the individuals
sampled from the Trondheim
cemeteries. Converting enamel
δ18OPDB to δ18OSMOW provides a
minimum (-12‰) and maximum
(-7‰) value for the Trondheim
data (Fig. 12). Based on modern
precipitation values, oxygen
isotope ratios -7‰ and -9‰
are expected for Trondheim.
These values fit with the first two
groups described above. These
resources in the diet although this pattern does not
make sense in terms of Hamar as an inland site in
southern Norway.
Lead isotopes were measured for some of the
Hamar enamel samples. A scatterplot of 13 87Sr/86Sr
vs. 206Pb/207Pb values for these samples is shown
in Figure 10. Two samples plot outside of the very
linear distribution of 206/207 values concentrated
around the ratio of 1.18. These two samples have
relatively high 87Sr/86Sr values of 0.7152 and 0.7176
and are likely non-local to Hamar. The two are a
20–22 year-old male (Grave 25) and a 6–7 year-old
child (Grave 78), respectively.
Figure 9. Scatterplot of 87Sr/86Sr and δ13C values for 17 enamel samples from
Hamar, Norway.
Figure 10. 87Sr/86Sr plotted against 206Pb/207Pb for 13 Hamar enamel samples.
Journal of the North Atlantic
T.D. Price and E. Naumann
2015 Special Volume 7
97
of information. These data confirm that strontium
isotope ratios are highly variable in Norway and the
definition of a local signal is difficult. It is certainly
the case that some of the highest 87Sr/86Sr values that
we have recorded in this study (with the exception
of Greenland) come from Norway.
The range of 87Sr/86Sr values of samples from
Norway fall approximately between 0.709 and
0.721. There are so few values below 0.709 that this
values are also found across south-central Norway
and are in no way limited to the Trondheim region.
The three more-negative values should be from more
northerly areas or higher elevations.
Conclusions
Isotopic analyses of human teeth and biological
samples from Norway provide a significant amount
Figure 11. Bar graph of 10 87Sr/86Sr values from Trondheim. Blue = Sondregatan; red = Library.
F i g u r e 1 2 .
Scatterplot of
87Sr/86Sr and
δ 1 8O values
for 9 enamel
samples from
Tr o n d h e i m ,
Norway. Enamel
and rainfall
values are given
on the left
and right side
of the plot, respectively.
Journal of the North Atlantic
T.D. Price and E. Naumann
2015 Special Volume 7
98
value is a reasonable cut-off point for individuals
born in Norway. There are two bioavailable values
from around the Oslo fjord of 0.708, but consumption
of seafood by humans in this coastal area would
raise the enamel value toward 0.7092. In any case,
the incidence of individuals below 0.709 in Norway
is extremely low.
Lower 87Sr/86Sr values are most common along
the coasts, where much of the population of Norway
has lived for centuries. In these areas, lower ratios
above 0.7092 are likely the result of a mixed diet of
terrestrial and marine resources, which reduce the
ratio depending on the proportion of marine foods
in the diet. The higher values from Norway are
likely individuals who either lived in the interior,
were born in the interior and later moved to the
coast, or did not eat much seafood. There are two
values above 0.730 and two below 0.708 that are
very unusual and likely document two Greenlanders
and two Icelanders, respectively, who migrated to
Norway. It is important to remember that migration
is a two-way street. There may also be a number of
Norwegian-born individuals who migrated to Iceland
or Greenland only to return home. The isotopic
data from childhood in the teeth of these individuals
would not reveal this movement.
For the most part, carbon and oxygen isotopes
were not particularly useful in distinguishing individuals
within Norway. The carbon isotopes
provided some information on childhood diets
and especially the role of seafood in nutrition, but
little geographic patterning was observed beyond a
general coast–inland differentiation. Lead isotopes
provided some insight into outlier samples at Hamar
that likely represent non-local individuals and offer
promise of more resolution in future studies.
Acknowledgments
We would like to express our gratitude to Per Holck
(University of Oslo), Anne Karin Hufthammer (Bergen
Musem), Berit Sellevold (Norwegian Insitute for
Cultural Heritage Research in Oslo), and Åsa Dahlin
Hauken (Univeristy of Stavanger), for assistance with
permissions and samples, and to James Burton (Laboratory
for Archaeological Chemistry at the University of
Wisconsin-Madison) for all his hard labor. We also thank
Paul Fullagar (University of North Carolina at Chapel
Hill) and David Dettman (University of Arizona) for
assistance with analysis. We are grateful to the US National
Science Foundation and the Univeristy of Oslo for
funding aspects of this project.
Literature Cited
Ambrose, S.H., and L. Norr. 1993. Experimental evidence
for the relationship of the carbon isotope ratios of
whole diet and dietary protein to those of bone collagen
and carbonate. Pp. 1–37, In J.B. Lambert and G.
Grupe (Eds.). Prehistoric Human Bone: Archaeology
at the Molecular Level. Springer, Berlin, Germany.
Bagge, S. 1998. Mennesket i middelalderens Norge. Tanker,
tro og holdninger 1000–1300. H. Aschehoug &
Co., Oslo, Norway.
Barrett, J.H., and M.P. Richards. 2004. Identity, gender,
religion, and economy: New isotope and radiocarbon
evidence for marine resource intensification in Early
Historic Orkney, Scotland, UK. European Journal of
Archaeology 7:249–271.
Chenery, C.A., V. Pashley, A.L. Lamb, H.J. Sloane, and
J.A. Evans. 2012. The oxygen isotope relationship between
the phosphate and structural carbonate fractions
of human bioapatite. Rapid Communications in Mass
Spectrometry 26:309–319.
Harrison, R.G., and M.A. Katzenberg. 2003. Paleodiet
studies using stable carbon isotopes from bone apatite
and collagen: Examples from southern Ontario and
San Nicolas Island, California. Journal of Anthropological
Archaeology 22:227–244.
Johansen, O.S., S. Gulliksen, and R. Nydal. 1986. 13C and
diet: Analysis of Norwegian human skeletons. Radiocarbon
28:754–761.
Price, T.D. 2013. Human mobility at Uppåkra: A preliminary
report on isotopic Proveniencing. Pp. 157–169, In
B. Hårdh and L. Larsson (Eds.). Studies at Uppåkra,
An Iron Age City in Scania, Sweden. Institute of Archaeology,
Lund, Sweden.
Price, T.D., K.M. Frei, A. Dobat, N. Lynnerup, and P.
Bennike. 2011. Who was in Harold Bluetooth’s army?
Strontium isotope investigation of the cemetery at the
Viking Age fortress at Trelleborg, Denmark. Antiquity
85:476–489.
Price, T.D., J.N. Nielsen, K.M. Frei, and N. Lynnerup.
2012. Sebbersund: Isotopes and mobility in an 11th–
12th c. AD Danish churchyard. Journal of Archaeological
Science 39:3714–3720.
Price, T.D., M. Naum, P. Bennike, N. Lynnerup, K.M.
Frei, H. Wagnkilde, and F.O. Nielsen. 2013. Investigation
of human provenience at the Early Medieval
cemetery of Ndr. Grødbygård, Bornholm, Denmark.
Danish Journal of Archaeology 1:93–112.
Price, T.D., K.M. Frei, and E. Naumann. 2015. Isotopic
baselines in the North Atlantic region. Journal of the
North Atlantic Special Volume 7:103–136.
Reed, S. 1998. De arkeologiske undersøkelsene. Statsbygg
1998:13–15.
Schoeninger, M.J., and M.J. DeNiro. 1982. Nitrogen and
carbon isotopic composition of bone collagen from
marine and terrestrial animals. Geochimica et Cosmochimica
Acta 48:625–639.
Sellevold, B.J. 1991. Skjelettfunnene ved Hamar domkirkeruin
1991. Pp. 7–14, In R. Pedersen (Ed.). Fra
kaupang og bygd 1991. Hedmarksmuseet og Domkirkeodden,
Hamar, Norway.
Journal of the North Atlantic
T.D. Price and E. Naumann
2015 Special Volume 7
99
Sellevold, B.J. 1996. Middelalderens mennesker: Om
knokler som kunnskapskilde. In M. Rindal (Ed.). Studier
i kilder til vikingtid og nordisk middelalde. KULT
skriftserie 46, Norges forskningsråd, Oslo, Norway.
Sellevold, B.J. 2001. From Death to Life in Medieval
Hamar: Skeletons and Graves as Historical Source
Material. Acta Humaniora 109. Unipub Forlag, Oslo,
Norway.
Sjögren, K.-G., T.D. Price, and T. Ahlström. 2009.
Megaliths and mobility in southwestern Sweden:
Investigating relations between a local society and
its neighbours using strontium isotopes. Journal of
Anthropological Archaeology 28:85–101.
Sullivan, C.H., and H.W. Krueger. 1981. Carbon isotope
analysis of separate chemical phases in modern and
fossil bone. Nature 292:333–335.
Tauber, H. 1981. δ13C for dietary habits of prehistoric man
in Denmark. Nature 292:332–333.
van der Merwe, N.J., and J.C. Vogel. 1978. 13C content
of human collagen as a measure of prehistoric diet in
woodland North America. Nature 276:815–816.
Journal of the North Atlantic
T.D. Price and E. Naumann
2015 Special Volume 7
100
Appendix 1. Strontium, oxygen, and carbon isotope ratios on human enamel from Norway.
Individual No. Site Element Sr86/Sr87 δ18Oenamel δ13Cenamel
A3705 Sør-Kil, Øvre Sjødalen M1 0.7129 -4.4 -15.3
A4480 Marøystrand M1 - -3.0 -14.7
A5274 Bodø M1 - -4.7 -15.3
A4295 Havsteinen, Herøy #28 0.7099 -5.1 -14.1
A5115 Holkestadvika, Steigen M1 - -4.2 -13.7
A4511 Rønvik, Bodø M1 0.7130 -5.5 -16.6
A5117 Rossøy, Steigen M1 0.7141 -3.1 -15.7
A4562 Skarstein, Deverberg M1 0.7106 -1.4 -14.9
A4779 Ytre Torget M1 0.7102 -3.6 -16.4
A1505 Offerøy, Lødingen M1 0.7097 - -
A1579 Løvøy, Steigen M1 0,7116 -3.4 -15.7
A4007 Senja #18 0,7091 -3.2 -14.4
A995/A2806 Helgøy, Karlsøy M1 0,7109 -5.5 -15.6
A996/A2806 Helgøy, Karlsøy M1 0,7134 -5.5 -15.7
Sola m. grave 4 Sola medieval Churchyard ULM1 0,7181 - -
A3171 Gulen, Sogn Unknown tooth 0,7076 -5.5 -15.8
A5036 Møre, Nord-trøndelag Unknown tooth 0,7108 -3.7 -14.0
A7418 Kristiansand, Vest-Agder Unknown tooth 0,7115 - -
A1515 Oseberg, Vestfold Unknown tooth - -4.6 -15.8
A1515 Oseberg, Vestfold Unknown tooth 0,7114 - -
JS 988 246/2 Lille Øvregt./Domkirkeplass M2 0,7125 -4.9 -15.4
JS 988 246/3 Lille Øvregt./Domkirkeplass M2 0,7104 -3.8 -14.4
JS 988 246/4 Lille Øvregt./Domkirkeplass Unknown tooth 0,7103 -3.0 -13.7
JS 988 146/67 Lille Øvregt./Domkirkeplass M2 0,7134 -5.8 -15.3
JS 988 246/66 Lille Øvregt./Domkirkeplass M2 0,7101 -3.6 -14.8
JS 1023/1 Lysekloster M2 0,7126 -4.4 -15.8
JS 1037/1 Nykirken M2 0,7099 -4.4 -13.3
JS 1037/2 Nykirken M2 0,7127 -5.6 -15.9
JS 1037/3 Nykirken M2 0,7099 -5.3 -13.1
JS 1037/5 Nykirken M2 0,7097 -3.9 -14.6
JS 1040 75004 Bryggen, Gullskoen P4 0,7219 -5.1 -15.5
JS 1040 75061 Bryggen, Gullskoen M2 - -4.3 -14.0
JS 1040 75013 Bryggen, Gullskoen M1 0.7105 -3.6 -15.2
JS 1040 75009 Bryggen, Gullskoen M1 0.7083 -3.2 -16.9
JS 1040 75019 Bryggen, Gullskoen P4 0.7104 -5.3 -11.3
JS 1040 75032 Bryggen, Gullskoen P4 0.7109 -3.8 -14.4
JS 1040 75024 Bryggen, Gullskoen P4 0.7209 -5.1 -15.6
JS 1040 75038 Bryggen, Gullskoen P4 0.7147 -5.1 -15.3
JS 1040 75040 Bryggen, Gullskoen M1 - -3.5 -15.3
JS 1040 75060 Bryggen, Gullskoen M2 - -3.8 -13.8
JS 1040 75229 Bryggen, Gullskoen M1 0.7100 -4.3 -14.9
JS 1040 76335 Bryggen, Gullskoen M1 0.7103 -4.9 -14.4
JS 1040 76341 Bryggen, Gullskoen P4 0.7152 -4.0 -15.6
JS 1040 70301 Bryggen, Gullskoen M2 0.7095 -3.9 -13.8
C51006/HKH 11658 Hamar Cathedral Tooth 28 0.7132 -7.6 -14.1
C51006/HKH 11657 Hamar Cathedral Tooth 28 0.7123 -5.3 -11.3
C51006/HKH 11663 Hamar Cathedral Tooth 38 0.7133 -7.0 -12.6
C51006/HKH 11664 Hamar Cathedral Tooth 28 0,7170 -5.8 -14.6
C39990/HKH 11654 Hamar Cathedral Tooth 48 0,7135 -4.9 -14.1
C39990/HKH 11654 Hamar Cathedral Fibula 0,7136 - -
C39990/HKH 11725 Hamar Cathedral Tooth 28 0,7130 -6.0 -14.3
C39990/HKH 7754 Hamar Cathedral Tooth 16 - -5.2 -14.5
C39990/HKH 7806 Hamar Cathedral Tooth 18 - -7.1 -12.5
C37624/HKH 7826 Hamar Cathedral Tooth 38 0,7150
C37624/HKH 7822 Hamar Cathedral Tooth 17 0,7146 -6.9 -15.0
C37624/HKH 7832 Hamar Cathedral Tooth 18 0,7173 - -
C37624/ HKH 7834 Hamar Cathedral Tooth 18 0,7176 -7.7 -14.7
C37624/ HKH 7808 Hamar Cathedral Tooth 25 0,7112 -5.5 -13.6
C37624/ HKH 7824 Hamar Cathedral Tooth 17 0,7134 -5.9 -13.5
C37624/ HKH 7897 Hamar Cathedral Tooth 17 0,7152 -6.2 -12.4
C37624/ HKH 7901 Hamar Cathedral Tooth 17 0,7157 -6.3 -13.9
C37624/ HKH 7917 Hamar Cathedral Tooth 17 0,7178 -5.9 -12.1
C39990/ HKH 11438/ 11413 Hamar Cathedral Tooth 18 0,7140 -6.7 -11.2
C39990/ HKH 11427/ 11419 Hamar Cathedral Tooth 17 0,7162 -6.9 -14.0
Journal of the North Atlantic
T.D. Price and E. Naumann
2015 Special Volume 7
101
Individual No. Site Element Sr86/Sr87 δ18Oenamel δ13Cenamel
C51006/ HKH 11588 Hamar Cathedral Tooth 16 0,7176 -5.8 -14.5
AS1 Trondheim M2 0,7203 -7.3 -14.5
AS17 Trondheim Unknown 0,7141 -5.9 -15.7
ASSK148 Trondheim M1 0,7108 - -
AV27 Trondheim M2 0,7144 -7.3 -16.0
AV29 Trondheim M2 0,7317 -5.7 -16.1
SK169 Trondheim Unknown 0,7156 -5.7 -15.4
Sk192 Trondheim M1 0,7107 -4.5 -16.1
AM95 Trondheim PM1 0,7096 -4.6 -14.6
KA52 Trondheim M3 0,7178 -7.6 -15.1
N3915 Trondheim M3 0,7104 -5.7 -15.6
5780h Ullaland av Bo, Farm #26, Ha k Bone 0,7115 - -
4792aa Ullaland av Bo, Farm #26, Ha k Bone 0,7108 - -
5183b Storrheia, Store Svela Bone 0,7116 - -
5186d Storrheia, Store Svela Bone 0,7122 - -
5179o Storrheia, Store Svela Bone 0,7100 - -
5184b Storrheia, Store Svela Bone 0,7125 - -
5182f Storrheia, Store Svela Bone 0,7108 - -
5181f Storrheia, Store Svela Bone 0,7122 - -
4549g Store Oma, Farm #13 Time k Bone 0,7116 - -
4960b Store Oma, Farm #13 Time k Bone 0,7132 - -
5789g Store Oma, Farm #13 Time k. Bone 0,7151 - -
11771a Gausel, Stavanger Bone 0,7124 - -
11772m Gausel, Stavanger Bone 0,7184 - -
11761ag Gausel, Stavanger Bone 0,7152 - -
11776i Gausel, Stavanger Bone 0,7126 - -
T19564/ A Tomeide, Tomma, Nordland M2 0,7114 - -
T19564/ B Tomeide, Tomma, Nordland M2 0,7102 - -
T19564/ C Tomeide, Tomma, Nordland M1 0,7096 - -
T19564/ D Tomeide, Tomma, Nordland M1 0,7098 - -
A253 Lødingen, Nordland M1 0.7175 -4.9 -16.0
A642 Leines, Nordland M2 0.7109 -4.5 -15.5
A1522 Rønvid, Bodø M2 0.7109 - -
A1648A Søndre Mæla, Gjerpen, Telemark M3 0,7138 - -
A1648B Søndre Mæla, Gjerpen, Telemark M2 0,7110 - -
A4049 Hillesøy, Troms PM1 0,7118 - -
A4182 Hillesøy, Troms M2 0,7106 - -
A4183 Hillesøy, Troms M3 0,7104 - -
A4184 Hillesøy, Troms M1 0,7110 - -
A4304 Lille Arnestad, Åmot, Hedmark M2 0,7159 - -
A4638 Indre Hernes, Bodø M2 0,7097 - -
A4688 Værøy, Nordland Unknown tooth 0,7094 - -
A4689 Værøy, Nordland Unknown tooth 0,7104 - -
A4719 Voss, Hordaland PM 0,7145 - -
A4720 Voss, Hordaland M2 0,7213 - -
A3709 Nesna, Nordland M1 0,7092 - -
A3985 Nesna, Nordland M3 0,7099 - -
A4001 Brønnøy, Nordland M1 0,7133 - -
A4268 Brønnøy, Nordland M2 0,7098 - -
A4280 Herøy, Nordland M1 0.7102 - -
A4295 Herøy, Brønnøy Nordland 2M 0.7098 - -
A4296 Brønnøy, Nordland M1 0.7105 - -
A4300 Bindal, Nordland M2 0.7107 - -
A4448 Tjøtta, Nordland M1 0.7103 -3.9 -14.5
A4479 Brønnøy, Nordland M2 0.7103 - -
A4491 Dønna, Nordland M2 0.7095 - -
A4502 Sømna, Nordland M1 0.7106 - -
A5304 Tomsvik, Nesna, Nordland M1 0.7116 - -
A5317 Herøy, Nordland M1 0.7092 - -
A3692 Trondnes, Troms M2 0.7105 - -
A3999 Rønvik, Nordland M1 0.7109 - -
A4303 Bodø Teglverk, Bodø M unknown 0.7122 - -
A4420 Sletten, Nordland M1 0.7103 - -
A4512 Rønvik, Nordland M1 0.7130 - -
A4615 Lenvik, Hillesøy, Troms M1 0.7105 - -
A4621 Vesterparten, Nordland M1 0.7106 - -
Journal of the North Atlantic
T.D. Price and E. Naumann
2015 Special Volume 7
102
Individual No. Site Element Sr86/Sr87 δ18Oenamel δ13Cenamel
A4642 Ytre Elgnes, Trondnes, Troms M2/#45 0.7128 -4.6 -13.4
A4643 Bessebostad, Trondenes, Troms M3 0.7109 - -
A4727 Stokke, Lødingen M2 0.7116 -4.6 -14.6
A4759 Slagstad, Bjarkøy, Troms M1 0.7098 - -
A5187 Gildeskål, Nordland M1 0.7093 - -
A5195 Vikran Nordre, Steigen, Nordland M1 0.7104 - -
A5287 Søberg, Bø, Nordland M2 0.7100 - -
A5301 Stokke, Tjeldsund, Nordland Unknown tooth 0.7124 - -
A4691b Steigen, Nordland M1 0.7106 - -
A5276 Larvik, Vestfold M2 0.7109 -5.6 -15.7
A5280 Larvik, Vestfold M1 0.7087 -3.2 -13.3
A5281 Larvik, Vestfold M1 0.7075 -2.4 -13.9
A1516 Høland, Akershus M2 0.7170 -6.5 -15.4
A3700 Lunner, Oppland M1 0.7135 -6.4 -15.9
A4005 Ringsaker, Hedmark M2 0.7179 -6.3 -14.9
A4006 Ringsaker, Hedmark M3 0.7132 -4.3 -13.7
A2808 Gran, Oppland M1 0.7101 -6.0 -14.7
A1521 Brevik, Telemark M unknown 0.7126 -4.2 -16.5
A1520 Lunner, Oppland M2 0.7100 -7.7 -14.7
A1518 Åsnes, Hedmark Pm1 0.7182 -6.7 -15.5
A3697 Skien, Telemark M2 0.7106 -5.2 -13.5
C52214 Gulli, Vestfold Unknown tooth 0.7102 -5.5 -17.3
A3777 Jevnaker, Oppland M1 0.7170 -5.9 -17.3