27
T.R. Black, B.K. Jones, and H.T. Mattingly
2013 Southeastern Naturalist Vol. 12, Special Issue 4
Development and Validation of Habitat Models for the
Threatened Blackside Dace, Chrosomus cumberlandensis,
at Two Spatial Scales
Tyler R. Black1,2,*, Brena K. Jones1,2, and Hayden T. Mattingly1
Abstract - Chrosomus cumberlandensis (Blackside Dace) is a small-bodied, freshwater
fish endemic to the upper Cumberland River system in southeastern Kentucky and northeastern
Tennessee. A detailed study of its habitat requirements using presence-absence
data has not been published to date. Identification of important habitat variables at multiple
spatial scales would facilitate proactive management and recovery of this federally
listed species. Using logistic regression, we developed and validated habitat models
of Blackside Dace presence as a function of environmental variables measured at two
spatial scales (i.e., stream and reach). For model development, map-produced and fieldcollected
variables were gathered for 91 waterways at the stream scale and 72 localities
at the 200-m reach scale during summer. Our initial models predicted the likelihood of
Blackside Dace presence to be optimized in streams with crude gradient between 1%
and 6%, and in reaches with a turbidity ≤10 NTU, dissolved oxygen >8.5 mg/L, summer
water temperatures between 14.6 oC and 18.5 oC, conductivity <240 μS, percent riffle
between 35% and 50%, and link magnitude between 3 and 6, although the species was occasionally
observed in locations with conditions outside of thi s predicted optimal range.
We then validated the models by collecting additional data from 27 new streams and 47
new reaches. Model performance was assessed with Cohen’s kappa (κ). The strongest
models included conductivity as a predictor variable, with the combination of conductivity
and temperature producing the strongest performance (κ = 0.41). Models containing
crude gradient, turbidity, dissolved oxygen, and percent riffle generally did not perform
well upon validation. Our findings suggest that conductivity, water temperature, and link
magnitude are three important reach-scale variables for resource managers to consider
when conserving populations of Blackside Dace.
Introduction
Approximately 90% of temperate freshwater fish species found within the
United States are considered nongame fishes (Warren and Burr 1994). These nongame
species are popularly perceived as “minnows” whose existence is seldom
recognized by the public and whose primary value to humans lies in their use
as bait or food for game fishes (Sheldon 1988, Warren and Burr 1994). Among
these “minnows” are two speciose families, Cyprinidae (minnows) and Percidae
(darters, perches, sauger, and walleye), which comprise nearly half of the US
fish fauna (Sheldon 1988, Warren and Burr 1994) and 61% of the Southeast’s
fish fauna (Walsh et al. 1995). Within Cyprinidae, 49 species are considered
1Department of Biology, Box 5063, Tennessee Technological University, Cookeville,
TN 38505. 2Current Address - North Carolina Wildlife Resources Commission, 1718
NC Highway 56 West, Creedmoor, NC 27522. *Corresponding author - tyler.black@
ncwildlife.org.
Ecology and Conservation of the Threatened Blackside Dace, Chrosomus cumberlandensis
2013 Southeastern Naturalist 12(Special Issue 4):27–48
T.R. Black, B.K. Jones, and H.T. Mattingly
2013 Southeastern Naturalist
28
Vol. 12, Special Issue 4
vulnerable, 20 are threatened, 47 are endangered, and 11 are extinct (Jelks et al.
2008). Many of these imperiled fishes are localized in the Tennessee-Cumberland
and Mobile river basins; among these species, 70% are endemic or restricted to
one of the two regions (Master et al. 1998).
Chrosomus cumberlandensis (Starnes and Starnes) (Blackside Dace) is a federally
protected (status = threatened) cyprinid endemic to the upper Cumberland
River system within southeastern Kentucky and northeastern Tennessee (Black
et al. 2013 [this issue], Eisenhour and Strange 1998; O’Bara 1988, 1990; Starnes
and Etnier 1986; Starnes and Starnes 1978, 1981; USFWS 1987, 1988). Blackside
Dace obtain an adult total length of 50–80 mm, have a moderately deep and slightly
compressed body, and differ from congeners by exhibiting distinct coloration patterns
(Etnier and Starnes 2001, Starnes and Starnes 1978, H.T. Mattingly, unpubl.
data). Blackside Dace generally inhabit shallow pools in cool streams with ample
refugia such as undercut banks, rootwads, sunken logs, and boulders. These small,
2- to 5-m-wide stream habitats often exhibit intact riparian zones and a percent
riffle:pool ratio not exceeding 60:40 (O’Bara 1990; Starnes and Starnes 1981;
USFWS 1987, 1988). Using presence-only data, Liang et al. (2012) recently modeled
Blackside Dace habitat suitability in Kentucky at the stream-segment scale
and found that stream gradient, mining density, and stream order most influenced
their predictions of habitat suitability. Despite these generally recognized habitat
affinities, a detailed study of Blackside Dace presence-absence and habitat use at
multiple spatial scales has not been published to date.
Development of coal and timber resources in the Cumberland River basin has
led to degradation of streams and extirpation of numerous aquatic populations
(Kentucky Division of Water 2000). Acid mine drainage has increased heavymetal
concentrations and changed pH in streams; logging, road development,
and cattle grazing have modified riparian zones, increased siltation, and altered
temperature regimes; agriculture has contributed chemical runoff from crops;
and rural homes have discharged untreated sewage and garbage into streams
(O’Bara 1990; Starnes 1981; Starnes and Starnes 1978; USFWS 1987, 1988).
These threats highlight the need for ongoing management actions to slow Blackside
Dace habitat degradation. In particular, describing the relationship between
the dace and its habitat is an important component of the species’ recovery plan
(objective 1.3.1; USFWS 1988). Furthermore, knowledge of habitat ecology will
play a vital role if new populations are to be discovered or reintroduced (objective
2; USFWS 1988).
Porter et al. (2000) noted that conserving fish diversity requires reliable data
on distribution and habitat, especially for species that are at risk because of low
numbers, a fragmented or endemic distribution, or habitat perturbation issues.
Therefore, predicting the distribution of rare species based on habitat parameters
is often perceived to be a useful tool for conservation and ecological management
(Fielding and Bell 1997). Models estimating species presence, population
size, distribution, areas with high risks of extinction, and potential reintroduction
locations are often constructed from survey data (i.e., biological, physical, and
29
T.R. Black, B.K. Jones, and H.T. Mattingly
2013 Southeastern Naturalist Vol. 12, Special Issue 4
chemical components of ecosystems) using correlative univariate or multivariate
methods such as logistic regression, discriminant analysis, and artificial neural
networks (e.g., Fielding and Bell 1997, Joy and Death 2002, Kanno et al. 2012,
Manel et al. 2001). Fielding and Bell (1997) and Manel et al. (2001) advocate
that models should be tested with independent information to ensure their merit
and accuracy. Comprehensive modeling investigations usually include a validation
component, in which models are tested in new situations to assess their
performance and applicability to management decisions (e.g., Mattingly and
Galat 2004). Although model validation is often stressed as an important component
of sound, predictive habitat models, it is frequently neglected in analyses
(Manel et al. 2001). Olden et al. (2002) also report that researchers often perceive
the modeling process as complete once construction and predictions are made,
a problem reinforced by the reliance on statistical modeling software packages.
Thus, the objectives of this study were to (1) develop logistic regression habitat
models to predict Blackside Dace presence at stream and reach spatial scales, and
(2) validate the effectiveness of habitat models to accurately predict presence at
other sites within the upper Cumberland River drainage.
Methods
Model development
Stream scale. A stream-scale analysis was conducted to distinguish streams
that have a historic presence of Blackside Dace from those that do not. Ninety-one
streams within the species’ historic range were selected for study, including 46
streams with known dace presence and 45 streams in which dace absence has been
recorded (USFWS, Cookeville, TN, unpubl. data). The historic range of the Blackside
Dace was divided into sub-basins based on 11-digit hydrological unit codes
(HUC), yielding a total of 45 sub-basins. To choose streams representing dace absence,
45 streams were selected haphazardly from 40 of these 45 sub-basins.
Variables measured for each stream were watershed (drainage) area, stream
elevation at mouth and headwaters, stream length, stream gradient, stream order
at mouth (Strahler 1957), and C-link (Fairchild et al. 1998). Data were collected
from either topographic maps in MapTech’s® Terrain Navigator (MTN) or geographic
information system (GIS) layers at a 1:24,000 scale. The drainage area
for each stream was considered to be the area enclosed by the 14-digit HUC
boundaries in ArcMap® GIS. C-link, an indicator of a stream’s position in the
watershed, was calculated by counting the number of confluences downstream
from the stream’s mouth until the Cumberland River mainstem was reached.
Reach scale. Reach-scale models were constructed to distinguish contemporary
differences between stream reaches that harbor Blackside Dace and those
that do not. Reaches were defined as 200 m in length along the longitudinal
stream axis. One to four such reaches were established in 28 streams with a
known historic record of Blackside Dace presence, yielding a total of 72 study
reaches surveyed by Black et al. (2013 [this issue]). Reaches were sampled via
AC backpack electrofishing equipment in June through August 2003 and yielded
T.R. Black, B.K. Jones, and H.T. Mattingly
2013 Southeastern Naturalist
30
Vol. 12, Special Issue 4
Blackside Dace presence at 25 of 28 streams and 52 of 72 reaches (Black et al.
2013 [this issue]).
Twenty-two habitat variables were selected for reach-scale analysis, 19 of
which were derived from field measurements, while the remaining 3 (stream
order, link magnitude, and straight-line distance to coal exploration [km]) were
assessed in ArcMap® GIS. Transects perpendicular to streamflow were established
at each 200-m reach, spaced regularly at 20-m intervals. Not all variables
were measured at each of the 72 reaches; however, a minimum sample size of at
least 30 reaches for each variable was maintained.
Water quality variables including turbidity (nephelometric turbidity units
[NTU]), dissolved oxygen (mg/L), temperature (oC), conductivity (μS/cm),
and pH were recorded once at the upstream and downstream limit of the reach.
Turbidity was measured with an HF Scientific MicroTPI turbidimeter; dissolved
oxygen, temperature and conductivity were recorded using a Yellow Springs
Instrument (YSI)® Model 85 meter; and pH was determined using an Oakton Instruments
pHTestr 3+ meter. Wetted-channel width, maximum and average water
depth, and percent streambed gradient were measured at each transect, 11 times
per reach. Percent gradient was measured using a handheld clino meter from one
transect line upstream to the previous one. Values for each aforementioned variable
were averaged to generate a single value for the entire reach. The coefficient
of variation for maximum water depth and percent gradient was calculated once
for each reach. Stream discharge (cm3/s), as outlined by Gallagher and Stevenson
(1999), was assessed using a Marsh-McBirney Flo-Mate 2000 or 201D and a topset
wading rod.
Silt depth and percent of site composed of riffle habitat were recorded for
each reach as a whole. Percent riffle was visually estimated for the entire reach
cumulatively during electrofishing. Silt depth covering the rocky substrate was
visually estimated at the upstream and downstream limits of each reach following
a single calibration with a ruler at the beginning of the field season, and the
highest value for the reach was used in analysis. The dominant substrate size
along each transect line was visually estimated and classified as follows: 1 =
silt, 2 = sand, 3 = gravel, 4 = cobble, 5 = rock, 6 = boulder; and 7 = bedrock (using
a modified Wentworth scale from Bain 1999), and it was recorded 11 times
per reach. The mode of the substrate values was calculated to generate a single
substrate value for each reach. These categories were visually calibrated using a
ruler at the beginning of the field season. Streambank vegetative and rock cover
were evaluated 11 times per reach in the area where the transect line met the bank
for a distance of 0.5 m both up- and downstream. Cover included any material
observed between the water’s edge and the upper bankfull channel edge, and
its extent was evaluated for both streambanks using the Daubenmire scale (1 =
0-5%, 2 = 5–25%, 3 = 25–50%, 4 = 50–75%, 5 = 75–95%, 6 = ≥ 95%; Daubenmire
1959) to estimate vegetative and rock cover separately. The 11 values for
each bank were averaged, and then the two resulting values were averaged to
create separate values for rock and vegetative cover for each reach. Woody debris
31
T.R. Black, B.K. Jones, and H.T. Mattingly
2013 Southeastern Naturalist Vol. 12, Special Issue 4
was categorized by measuring the diameter (cm) of the largest piece in the stream
channel that intersected the transect line: 1 = no debris present, 2 = <10.2 cm, 3 =
10.2–15.2 cm, 4 = 15.2–30.5 cm, 5 = >30.5 cm, and 6 = root mass or accumulated
woody debris. A bank undercut was recorded as present (1) if the streambank extended
over the edge of the wetted channel within ≤0.5 m from the water surface
on either side of a transect. If neither side of the transect had an undercut bank, a
value of 0 was recorded. The 11 observations per reach of woody debris and bank
undercut were averaged to generate a single value for each vari able.
Statistical analysis. For each environmental variable a frequency histogram
was constructed comparing Blackside Dace presence and absence. Then,
Spearman rank-order correlations were calculated in SAS® (SAS Institute,
Inc.; www.sas.com) for all possible combinations of environmental variables,
including Blackside Dace presence/absence. The sequential Bonferroni correction
procedure was used to correct for experiment-wise error (Holm 1979)
for habitat variable correlations; this procedure improves statistical power over
the standard Bonferroni correction when testing multiple null hypotheses (Rice
1989). Correction reduces α values and thus reduces the probability of Type I
error. However, for analysis of potential relationships between dace and habitat
attributes, pre-correction values were used; because this species is threatened,
taking an overly conservative statistical approach would be detrimental to recovery
and management.
Logistic regression models were built in SAS® with both single and multiple
predictors relating the presence/absence of Blackside Dace to environmental
variables. Models were in the following format (Hosmer and Leme show 2000):
π (BSD) = e f / (1 + e f ),
where f = β0 + β1x1 + β2x2 + … + βixi , π (BSD) equals the probability of Blackside
Dace presence, β0 equals the model intercept (constant), βi equals the parameter
estimate, and xi is the environmental variable, where i ≥ 1. Model performance
was evaluated internally using Cohen’s kappa (κ):
κ = ([a + d] – [([a + c][a + b] + [b + d][c + d]) / n]) ,
(n – [([a + c][a + b] + [b + d][c + d]) / n])
where a is the number of true positives, b is the number of false positives, c is
the number of false negatives, d is the number of true negatives, and n is the total
number of all cases (Fielding and Bell 1997, Manel et al. 2001, Mattingly and
Galat 2004). Cohen’s kappa is a statistic that calculates the proportion of all presence/
absence cases that are correctly predicted by a model after taking random
chance into consideration (Manel et al. 2001). A probability decision threshold
was chosen individually for each model, based on the distribution of output values,
in order to maximize κ. Any output value above this threshold was considered
to be a prediction of dace presence, while values below were classified as a
prediction of absence. For example, at a probability decision threshold of 0.70,
a model output of 0.43 for a stream reach would be classified as indicating dace
T.R. Black, B.K. Jones, and H.T. Mattingly
2013 Southeastern Naturalist
32
Vol. 12, Special Issue 4
absence in that particular reach. SAS-generated concordance values were also
recorded; a higher concordance value indicates that a model is better able to correctly
predict the outcome. Odds ratios were generated for variables exhibiting
significant correlations with dace presence. All models were ranked according
to their Akaike information criteria (AIC); a low AIC indicates a more valuable
model (Burnham and Anderson 2002). All R2 values reported are ratios of loglikelihood
values for each null and fitted model (Nagelkerke 1991). R2 values
for logistic regression are often lower than those reported for linear regression
models due to the binary nature of the response variable, and they can be difficult
to interpret for a single equation (Hosmer and Lemeshow 2000). However, these
values can be useful when comparing the applicability of competing logistic regression
models (Hosmer and Lemeshow 2000). For all statistical tests, α = 0.05.
Certain continuous habitat variables were transformed to categorical variables
to provide stronger models and to highlight intervals of disproportionate dace
occupancy. Discrete intervals were identified using each variable’s frequency
histogram; specifically, if several adjoining categories had “present” frequency
bars consistently higher than “absent” bars, this interval was assigned a value
of 1. For example, streams with a gradient between one and six were assigned a
value of 1 and streams outside this range were assigned a value of 0 to create the
categorized crude gradient variable. Similarly, for reaches, categorized turbidity
is a dichotomous variable whose value was 1 if turbidity was ≤10 NTU and 0 if
it was >10 NTU. Categorized dissolved oxygen was equal to 1 (>8.5 mg/L) or
0 (≤8.5 mg/L). Categorized percent riffle was equal to 1 (between 35 and 50%)
or 0 (outside of aforementioned range). Categorized link magnitude was equal
to 1 if the link magnitude of the reach was between 3 and 6, and 0 if it had any
value outside of this range. The only exception to this categorization procedure
occurred with conductivity: first, the selected interval did not occur exactly at
the transition point between higher present or absent bars (shifted from 200 μS
to 240 μS); second, conductivities above 240 μS were assigned a value of 1 and
conductivities below 240 μS were assigned a value of 0 to generate a negative
parameter coefficient during the modeling process.
Model validation
Significant models generated during the model-development phase were
subsequently validated with additional, independent data collected during June
through August, 2005 and 2006 (Black et al. 2013 [this issue]). Specifically, 47
new 200-m reaches within 27 new streams were sampled via pulsed-DC backpack
electrofishing equipment (Smith-Root® Model LR-24; Vancouver, WA) to
assess presence of Blackside Dace (Fig. 1; Black et al. 2013 [this issue]). One
difference between model development and validation was that development data
were from streams historically inhabited by Blackside Dace, while validation
data were from watersheds known to harbor dace, but not restricted to inhabited
streams. Also, more streams in Tennessee were included in the validation phase
than in the development phase (Fig. 1). All validation variables were assessed as
33
T.R. Black, B.K. Jones, and H.T. Mattingly
2013 Southeastern Naturalist Vol. 12, Special Issue 4
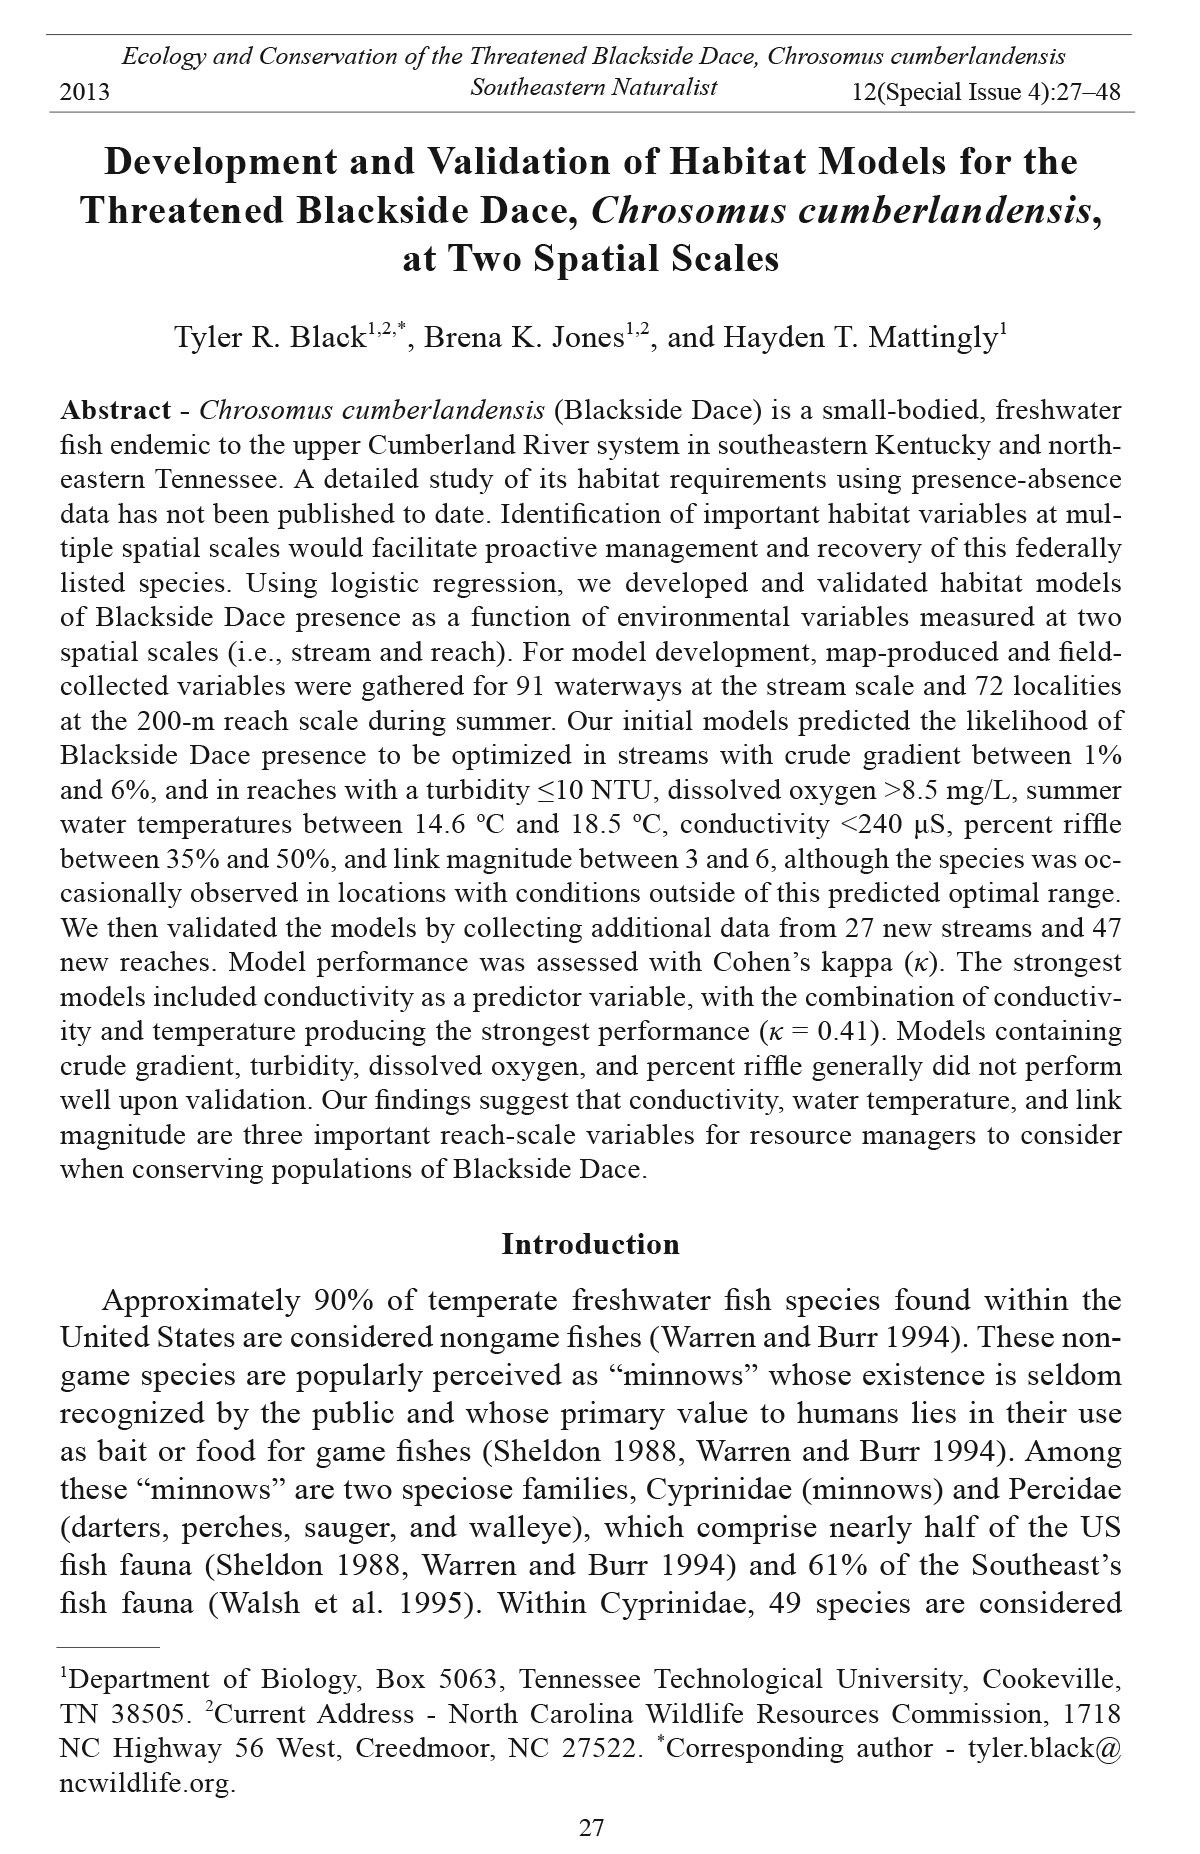
Figure 1. Upper Cumberland River system in Kentucky and Tennessee depicting 200-m study reaches sampled during model development
in summer 2003 (triangles) and model validation in summers 2005 and 2006 (circles).
T.R. Black, B.K. Jones, and H.T. Mattingly
2013 Southeastern Naturalist
34
Vol. 12, Special Issue 4
outlined previously; however, models that included dissolved oxygen were omitted
from analysis due to erratic oxygen-meter readings in 2005.
Deviations from the aforementioned variable assessments include omitting
2 streams from the stream-scale analysis and reach-scale link magnitude
because they were not present on topographic maps. In addition, percent riffle
was obtained by two methods (visual estimation and physical measurement) to
thoroughly evaluate models that included percent riffle as one of the parameters.
The operator of the backpack electrofishing unit visually estimated percent riffle
during single-pass electrofishing efforts, and physical measurements were taken
after the electrofishing pass by recording the total length of riffle within a reach
to determine actual percent riffle.
Values from the habitat variables assessed at the stream and reach scale were
inserted into models to generate the predicted probability of Blackside Dace
presence at new localities. Predicted probability of dace presence values were
arranged in order of increasing magnitude for each model and graphed to facilitate
visual assessment of model performance. Performance was quantitatively
assessed using the Cohen’s kappa statistic (κ). A confusion matrix (Fielding and
Bell 1997, Manel et al. 2001, Mattingly and Galat 2004) was constructed to calculate
κ, and probability decision thresholds were assessed to include a minimum
of 20% of the total number of streams or reaches. Probability decision thresholds
were set where sensitivity (the percentage of true positives correctly predicted)
was maximized. If visual assessment of a model graph indicated that a probability
decision threshold should be adjusted, the threshold was then reset where
misclassification rate (the proportion of false positives and the false negatives
within the data set) was minimized. Sensitivity and misclassification rate were
calculated using the following equations:
Sensitivity = a / (a + c),
Misclassification rate = (b + c) / n,
where a, b, c, and n are the same variables as described for Cohen’s kappa (Fielding
and Bell 1997). Kappa values range from -1 to 1, with higher values representing
stronger model performance and values below zero indicating poor performance.
According to Manel et al. (2001), kappa values indicate model performance as
follows: 0.0–0.4 = slight to fair, 0.4–0.6 = moderate, 0.6–0.8 = substantial, and
0.8–1.0 = almost perfect (with 1 meaning all sites were correctly classified).
Results
Model development
Stream scale. The number of significant correlations between Blackside
Dace and habitat attributes was reduced from 17 to 10 after using the sequential
Bonferroni procedure. Before Bonferroni correction, dace presence was positively
correlated with one habitat variable at the stream scale, categorized crude
gradient (|rs| = 0.32, P = 0.002); dace were 3.9 times more likely to be found in
35
T.R. Black, B.K. Jones, and H.T. Mattingly
2013 Southeastern Naturalist Vol. 12, Special Issue 4
streams with a crude gradient between one and six, yielding a significant logistic
regression model (G = 9.57, P = 0.002; Table 1). Six other variables (watershed
area, stream length, stream order, stream elevation at mouth or headwaters, and
C-link) were not significantly correlated with Blackside Dace presence and did
not result in any significant models (Jones 2005).
Reach scale. The number of significant correlations between Blackside Dace
and habitat attributes was reduced from 84 to 24 after using the sequential Bonferroni
procedure. Before Bonferroni correction, dace presence was correlated
with five habitat variables. There was a negative correlation with water temperature
(|rs| = 0.29, P = 0.01), turbidity (|rs| = 0.28, P = 0.02), link magnitude (|rs| =
0.26, P = 0.03), and conductivity (|rs| = 0.24, P = 0.04). Variation in average
maximum water depth was positively correlated with dace presence (|rs| = 0.28,
P = 0.04), but no significant regression model could be constructed for this variable.
Seventeen other habitat variables were not correlated with Blackside Dace
presence (Jones 2005).
Fourteen significant logistic regression models were created using turbidity,
dissolved oxygen, water temperature, conductivity, percent riffle, link magnitude,
and selected combinations of these 6 variables (Table 1, Fig. 2). Blackside
Dace were especially likely to be found in reaches with a turbidity ≤10 NTU
(odds ratio = 3.44), dissolved oxygen >8.5 mg/L (odds ratio = 4.16), summer
temperatures between 14.6 oC and 18.5 oC (odds ratio = 0.63), conductivity <240
μS (odds ratio = 0.11), percent riffle between 35 and 50 (odds ratio = 3.25), and
a link magnitude between 3 and 6 (odds ratio = 9.43). The strongest model (AIC
= 71.05; Table 2) incorporated categorized versions of both conductivity and link
magnitude. Of the significant variables, the strongest single predictor of Blackside
Dace presence was categorized percent riffle (AIC = 75.29); categorized
turbidity was the weakest (AIC = 83.91). The model including both categorized
turbidity and categorized dissolved oxygen had the highest Kappa value (κ =
0.44), indicating a higher proportion of agreement between model predictions
and actual field data used to create the model. The two-variable models had kappa
values ranging from 0.30 to 0.44, while the single variable models had a wider
range, from 0.19 to 0.40. Of the single-variable models, link magnitude produced
the highest Kappa (κ = 0.40), and categorized dissolved oxygen had the lowest
value (κ = 0.19).
Model validation
Most (58%) of the Blackside Dace logistic regression habitat models had
slight performance (i.e., kappa of 0.0–0.4; Table 2). One stream-scale model
(categorized gradient; kappa = -0.18), and three reach-scale models that included
turbidity and link magnitude individually or jointly had poor performance. Models
with slight performance had kappa values that ranged from 0.05 to 0.39. The
weakest model with slight performance was turbidity and temperature with a
kappa of 0.05, followed by turbidity and categorized percent riffle (κ = 0.09),
categorized percent riffle (κ = 0.09), temperature (κ = 0.19), temperature and
T.R. Black, B.K. Jones, and H.T. Mattingly
2013 Southeastern Naturalist
36
Vol. 12, Special Issue 4
Table 1. Logistic regression models predicting Blackside Dace presence at two spatial scales. The Wald χ2 statistic tests the significance of each coefficient.
The odds ratio indicates by how much the probability of dace pr esence will increase given a corresponding increase of one in t hat term.
Model/Term Coefficient SE Wald χ2 P > χ2 Odds Ratio AIC G P R2
Stream-scale model A: Categorized crude gradient 120.57 9.57 0.002 0.13
Constant -0.7730 0.3490 4.9059 0.0268
Categorized crude gradient 1.3548 0.4515 9.0057 0.0027 3.8760
Reach-scale model A: Categorized conductivity and categorized link magnitude 71.51 19.58 <0.0001 0.34
Constant 3.4275 1.0653 10.3525 0.0013
Categorized conductivity -2.7007 0.9384 8.2832 0.004 0.0670
Categorized link magnitude 2.2436 0.8347 7.2241 0.0072 9.4270
Reach-scale model B: Categorized turbidity and categorized perc ent riffle 71.68 9.70 0.0078 0.20
Constant -0.2559 0.4706 0.2958 0.5865
Categorized turbidity 1.4405 0.6407 5.0542 0.0246 4.2230
Categorized percent riffle 1.3605 0.6428 4.4805 0.0343 3.8980
Reach-scale model C: Categorized percent riffle 75.29 4.10 0.0430 0.09
Constant 0.4308 0.3563 1.4621 0.2266
Categorized percent riffle 1.1787 0.6057 3.7861 0.0517 3.2500
Reach-scale model D: Temperature and categorized conductivity 77.43 13.65 0.0011 0.25
Constant 11.1949 4.0611 7.5988 0.0058
Temperature -0.4175 0.2073 4.0558 0.0440 0.6590
Categorized conductivity -1.9965 0.7774 6.5956 0.0102 0.1360
Reach-scale model E: Categorized turbidity and link magnitude 77.82 12.61 0.0018 0.23
Constant 1.2419 0.4954 6.2850 0.0122
Categorized turbidity 1.5569 0.6372 5.9700 0.0146 4.7440
Link magnitude -0.1718 0.0714 5.7819 0.0162 0.8420
Reach-scale model F: Categorized turbidity and temperature 77.95 13.13 0.0014 0.24
Constant 10.7487 4.0671 6.9845 0.0082
Categorized turbidity 1.5175 0.6190 6.0106 0.0142 4.5610
Temperature -0.5531 0.2154 6.5931 0.0102 0.5750
37
T.R. Black, B.K. Jones, and H.T. Mattingly
2013 Southeastern Naturalist Vol. 12, Special Issue 4
Table 1, continued.
Model/Term Coefficient SE Wald χ2 P > χ2 Odds Ratio AIC G P R2
Reach-scale model G: Temperature and link magnitude 79.56 10.87 0.0044 0.20
Constant 10.1498 4.0630 6.2405 0.0125
Temperature -0.4471 0.2095 4.5549 0.0328 0.6390
Link magnitude -0.1357 0.0704 3.7214 0.0537 0.8730
Reach-scale model H: Categorized conductivity 79.90 9.19 0.0024 0.17
Constant 3.5009 0.9303 14.1613 0.0002
Categorized conductivity -2.1741 0.7573 8.2416 0.0041 0.1140
Reach-scale model I: Categorized dissolved oxygen and link magn itude 80.32 10.11 0.0064 0.19
Constant 1.3501 0.4935 7.4838 0.0062
Categorized dissolved oxygen 1.3481 0.7023 3.6839 0.0549 3.8500
Link magnitude -0.1414 0.0712 3.9433 0.0471 0.8680
Reach-scale model J: Categorized turbidity and categorized diss olved oxygen 80.41 10.68 0.0048 0.20
Constant -0.0442 0.4015 0.0121 0.9123
Categorized turbidity 1.3183 0.5868 5.0469 0.0247 3.7370
Categorized dissolved oxygen 1.5130 0.7087 4.5576 0.0328 4.5400
Reach-scale model K: Link magnitude 82.68 5.75 0.0165 0.11
Constant 1.7199 0.4615 13.8904 0.0002
Link magnitude -0.1404 0.0662 4.4982 0.0339 0.8690
Reach-scale model L: Temperature 82.69 6.40 0.0114 0.12
Constant 9.7152 3.7528 6.7020 0.0096
Temperature -0.4631 0.1958 5.5941 0.0180 0.6290
Reach-scale model M: Categorized dissolved oxygen 83.86 5.22 0.0223 0.10
Constant 0.5680 0.3036 3.5006 0.0613
Categorized dissolved oxygen 1.4243 0.6862 4.3079 0.0379 4.1550
Reach-scale model N: Categorized turbidity 83.91 5.17 0.0230 0.10
Constant 0.4055 0.3450 1.3810 0.2399
Categorized turbidity 1.2368 0.5639 4.8104 0.0283 3.4400
T.R. Black, B.K. Jones, and H.T. Mattingly
2013 Southeastern Naturalist
38
Vol. 12, Special Issue 4
Figure 2. Relative frequency histograms depicting turbidities, dissolved oxygen levels,
temperatures, conductivities, percent riffles, and link magnitudes associated with Blackside
Dace presence or absence during model development. Solid bars represent dace
presence and open bars represent dace absence.
39
T.R. Black, B.K. Jones, and H.T. Mattingly
2013 Southeastern Naturalist Vol. 12, Special Issue 4
Table 2. Performance statistics for Blackside Dace logistic regression habitat models during development and validation. C = concordance, S = sensitivity,
and M = misclassification rate.
Model development Model validation
Decision Decision
ID Models AIC ΔAIC threshold κ C threshold S M κ
Stream-scale:
A Categorized crude gradient 120.57 n/a 0.50 0.31 42.7 0.32 0.71 0.48 -0.18
Reach-scale:
A Categorized conductivity and categorized link magnitude 71.51 0.00 0.70 0.31 62.8 0.67 0.85 0.29 0.39
B Categorized turbidity and categorized percent riffle 71.68 -0.17 0.50 0.40 62.2 0.77 0.19 0.49 0.09
C Categorized percent riffle 75.29 -3.78 0.70 0.23 40.1 0.61 0.19 0.49 0.09
D Temperature and categorized conductivity 77.43 -5.93 0.70 0.35 77.1 0.82 0.65 0.30 0.41
E Categorized turbidity and link magnitude 77.82 -6.31 0.60 0.41 71.7 0.89 0.62 0.49 -0.02
F Categorized turbidity and temperature 77.95 -6.44 0.60 0.33 77.8 0.44 0.58 0.47 0.05
G Temperature and link magnitude 79.56 -8.05 0.70 0.30 74.3 0.33 0.88 0.36 0.22
H Categorized conductivity 79.90 -8.39 0.50 0.35 33.0 0.79 0.73 0.34 0.30
I Categorized dissolved oxygen and link magnitude 80.32 -8.81 0.60 0.34 69.5 n/a n/a n/a n/a
J Categorized turbidity and categorized dissolved oxygen 80.41 -8.90 0.60 0.44 62.0 n/a n/a n/a n/a
K Link magnitude 82.68 -11.17 0.70 0.40 62.4 0.81 0.39 0.53 -0.03
L Temperature 82.69 -11.18 0.70 0.26 71.1 0.27 0.85 0.38 0.19
M Categorized dissolved oxygen 83.86 -12.35 0.70 0.19 36.0 n/a n/a n/a n/a
N Categorized turbidity 83.91 -12.40 0.70 0.24 41.7 0.60 0.65 0.55 -0.16
T.R. Black, B.K. Jones, and H.T. Mattingly
2013 Southeastern Naturalist
40
Vol. 12, Special Issue 4
link magnitude (κ = 0.22), categorized conductivity (κ = 0.30), and categorized
conductivity and categorized link magnitude (κ = 0.39). The strongest model
(temperature and categorized conductivity) had a kappa of 0.41, which represents
moderate model performance. The three best-performing models included water
conductivity as a predictor variable.
Five models and one habitat variable were adjusted for final assessment
of model performance. The following models were assessed at the decision
threshold where misclassification rate was minimized: categorized percent riffle,
temperature and categorized conductivity, turbidity and link magnitude, turbidity
and temperature, and link magnitude. Also, models using categorized percent
riffle were initially assessed with two separate data sets (visual estimation and
physical measurements), but performance for both data sets was in the lower
range of the slight performance category. Therefore, only visually estimated data
were retained for final analysis, because original model construction was based
on visual estimation of percent riffle within a reach.
The rank order of regression model performance changed considerably after
model validation. In general, models that included temperature or categorized
conductivity as variables increased in placement, while models that incorporated
turbidity or categorized percent riffle decreased in ranking order (Fig. 3). Turbidity
as a single variable produced the weakest model during development and
again during validation.
Figure 3. Adjusted placement of reach-scale models after validation. Solid bars represent
the 5 strongest performing models, while open bars represent weakest performing
models. Models on Y-axis are listed from strongest (A) to weakest (N) based on Akaike
information criteria generated during development. For example, model D was the fourth
strongest model at development, but upon validation it was adjusted up four places to
become the strongest model.
41
T.R. Black, B.K. Jones, and H.T. Mattingly
2013 Southeastern Naturalist Vol. 12, Special Issue 4
Discussion
Numerous studies have shown that there is value in examining the interactions
between fish species and biotic and abiotic variables on a variety of spatial
scales. Interest in these differing spatial scales arose with the recognition that
events occurring at small scales within a watershed (i.e., in a single reach or
pool) usually do not affect the dynamics of the entire system; however, largescale
effects (i.e., on the entire watershed) could cascade down to the smaller
systems nested within (Frissell et al. 1986). Porter et al. (2000) suggested that
little was gained in terms of prediction from field-based data on smaller (reach,
run-riffle-pool complexes) scales. This, however, was not the case in our study.
Highly fragmented Blackside Dace populations live in an area of heavily and
patchily disturbed habitat. If they are extirpated from a stream or reach, the nearest
population available for recolonization may be prohibitively far away, even
given this species’ ability to move relatively long distances (>1 km) in a year’s
time (Detar and Mattingly 2013 [this issue]). The reason for extirpation is often
unclear, particularly if there are no data associated with the time of population
disappearance to suggest a cause. Furthermore, these small, shallow streams have
far more ephemeral habitat than higher-order streams and rivers; they are more
prone to drought, temperature, and oxygen stress. All of these factors lead to a
habitat that is temporally and spatially heterogeneous. Despite this heterogeneity,
we found Blackside Dace presence at the 200-m reach scale to be fairly predictable
based on as few as three environmental variables.
Our validation of Blackside Dace habitat models provides a good example
of why validation of habitat models for rare species is extremely important for
conservation efforts. The single stream-scale model, crude gradient, had poor
performance after testing with independent data. Although our model construction
phase (O’Bara 1988) provided support that Blackside Dace inhabit streams
with a gradient somewhere between 1% and 6%, this pattern was not especially
apparent during validation. Liang et al. (2012) found that low-gradient segments
of second- and third-order streams were particularly suitable for Blackside Dace
presence in Kentucky. The segment spatial scale is situated between the stream
and reach scales (Frissell et al. 1986), and could represent a better spatial resolution
for modeling the influence of gradient on dace presence-abs ence.
We also observed poor performance for the 3 reach-scale models that included
turbidity and link magnitude individually or jointly. Caution is recommended
when assessing models that include turbidity because dace in reaches with low
abundance could be difficult to detect in turbid waters. After field-testing, it
was found that the model including turbidity could only predict occurrence at a
rate that was equal to chance. Additionally, rain events prior to sampling would
undoubtedly inflate turbidity values above normal circumstances. Therefore,
future efforts to evaluate turbidity should follow strict guidelines for timing of
measurements (e.g., a set number of days after a rain event or after a rain event
of a certain magnitude). Link magnitude as a single variable may have performed
poorly because of variation between model-construction and validation reaches,
T.R. Black, B.K. Jones, and H.T. Mattingly
2013 Southeastern Naturalist
42
Vol. 12, Special Issue 4
or because it is a single factor in a complex ecosystem. Poor performance of these
four models should not imply that the variables are unimportant in this species’
survival. Stream gradient has been associated with keeping substrate free of sediment
(Waters 1995, Wood and Armitage 1997), turbidity is linked to land-use
patterns and increased sedimentation (Waters 1995), and link magnitude may be
related to drought situations when headwater streams lose conne ctivity.
Although Starnes and Starnes (1981) and our model development analysis
suggested that dace occurred more often in streams with a percent riffle less
than 60%, validation of models using percent riffle resulted in low kappa values.
Weak performance of models including percent riffle may have resulted
from inaccurate visual estimates of percent riffle during model development
or differences among survey crews. Therefore, future efforts to model percent
riffle should focus on physical measurements of riffles after electrofishing has
been completed.
Models including temperature tended to have midrange kappa values within
the slight performance category, with the exception of the model containing
temperature and conductivity (see below). Thermal preferences of freshwater
fish are well documented because changes in temperature often limit the
distribution, abundance, and behavior of fishes (Huff et al. 2005, Richardson
et al. 1994). Elevated stream temperatures are often associated with land-use
changes within the watershed, such as riparian-zone vegetation removal due
to logging, mining, or agricultural practices, which increase the amount of
solar radiation entering a waterway. Increased water temperature can cause decreased
dissolved oxygen, which can result in elevated stress levels and lower
competitive ability in fish (Diana 2004, Helfman et al. 1997). Helfman et al.
(1997) suggested that environmental changes cause production of heat-shock
proteins (hsps), which are thought to help fish adapt to stressful situations.
Heat-shock proteins stabilize biochemical functions by reconfiguring other
proteins that have been denatured by high temperatures. Therefore, production
of hsps may explain the continued existence of Blackside Dace in streams that
exceed normal thermal boundaries.
Invasion of Blackside Dace watersheds by Adelges tsugae Annand (Hemlock
Woolly Adelgid) has been discussed by Blomquist et al. (2010) as a threat to
Blackside Dace populations. Tsuga canadensis (L.) Carriere (Eastern Hemlock)
currently serves a vital role by buffering water temperature changes, reducing
fluctuations in stream flow, and decreasing sediment input from surrounding landuse
disturbances, simply due to its abundance and canopy contribution in riparian
areas of many streams occupied by Blackside Dace (Blomquist et al. 2010). Substantial
mortality of Eastern Hemlock due to Hemlock Woolly Adelgid infestations
could further complicate recovery efforts, given the likelihood that summer water
temperatures would be elevated under more open canopies due to solar heating.
A temperature increase of even a few degrees could be detrimental to Blackside
Dace persistence (Fig. 2: lower left panel), especially if other environmental parameters
were also altered in a less-than-optimal direction for this species.
43
T.R. Black, B.K. Jones, and H.T. Mattingly
2013 Southeastern Naturalist Vol. 12, Special Issue 4
The strongest performing models incorporated categorized conductivity as
an indicator variable for Blackside Dace presence/absence. After validation with
independent data, it was apparent that Blackside Dace have an affinity for waters
with conductivities less than 240 μS (Fig. 2; upper right panel). A number of different
land-use activities can result in elevated water conductivity, but mining is
believed to be the primary activity in Blackside Dace streams that has produced
such changes in past and present times (McAbee et al. 2013 [this issue]). Even after
mining activities have ceased, elevated conductivity in streams can persist for long
periods (reviewed by Bernhardt and Palmer 2011). In a West Virginia study, for example,
Bernhardt et al. (2012) reported mean conductivities of 64 μS in reference
streams, 118 μS in unmined streams, and 626 μS in mined streams. These authors
found biological impairment was likely to occur when surface coal mines exceeded
5.4% of their contributing watershed area, or when conductivity exceeded 308 μS,
a value very close to the 300-μS benchmark value recently devel oped for Central
Appalachian ecoregion streams by USEPA (2011).
Physicochemical properties may vary with location in a watershed, which
may also determine the distributional patterns of fishes (Koel and Peterka 2003,
Polivka 1999). Polivka (1999) reported that proportionally more individuals of
Notropis girardi Hubbs and Ortenburger (Arkansas River Shiner) were observed
in a narrow range of conductivities, although seasonal variations were observed.
In Spain, conductivity was the most significant variable that affected the condition
(i.e, weight-length relationship) of Barbus sclateri Günther (Sclater’s
Barbel) (Oliva-Paterna et al. 2003). The abundance of Blackside Dace has also
been known to decline through time as conductivity increased in a stream affected
by mining disturbance (M. Floyd, USFWS, Frankfort, KY, pers. comm.).
Mortality and declines in abundance attributed to high water conductivity may be
due to increased energy usage associated with osmotic ionic regulation and poor
reproductive success (Koel and Peterka 2003, Oliva-Paterna et al. 2003). However,
conductivity may only be a longer-term indicator of population declines, and
the true problem may relate to shorter-term episodic events, such as the release of
metal ions due to decreased pH during a rain event. Finally, temperature and link
magnitude played supportive roles to conductivity in the performance of models
A and D, and the importance of their contribution should not be overlooked because
these variables further refine the predictive ability of t he models.
Overall, most (58%) Blackside Dace habitat models had a kappa value between
0.0–0.4 (slight performance). Manel et al. (2001) recorded high rates of
slight to poor performance for Himalayan river birds, with 76% of models indicating
poor performance (κ < 0.4) based on criteria proposed by Fielding and Bell
(1997). Additionally, Manel et al. (2001) reported that few models were classified
as good (21%) and even fewer cases were identified as having excellent performance
(3%), so it is not surprising that excellent performance was not obtained
during validation with independent data in this study. Nevertheless, our overall
predictive success (i.e., percentage of correctly identified cases) of the top five
performing models exceeded 61% and the overall mean for the top three models
T.R. Black, B.K. Jones, and H.T. Mattingly
2013 Southeastern Naturalist
44
Vol. 12, Special Issue 4
was 69.1% (± 2.8% SD). Given the numerous impacts that could affect Blackside
Dace distribution, being able to correctly predict presence or absence 70% (i.e.,
33 of 47 sites) of the time with only 2 environmental variables is a noteworthy
consideration that merits the attention of resource managers. Holding the decision
threshold constant for model D (categorized conductivity and temperature),
5 more correct predictions (i.e., 38 of 47 sites) would have been needed to elevate
model performance to the substantial category (κ > 0.6) and 10 more correct predictions
(i.e., 43 of 47 sites) would have been required to elevate kappa to almost
perfect (κ > 0.8) model performance.
Although reach-scale models were developed from streams that historically
harbored Blackside Dace, validation was completed using streams with and
without a historical occurrence of dace; however, all surveyed streams were
within watershed systems known to harbor dace. Therefore, we reevaluated all
models using only historical streams to ensure that original performance assessments
were accurate. All models remained in their original classification category
except models B (turbidity and categorized percent riffle) and C (categorized
percent riffle), which decreased from slight to poor performance, and model E
(turbidity and link magnitude), which increased from poor to slight performance.
However, the primary focus of validation was centered on the one stream-scale
model (categorized crude gradient) and the 3 strongest performing models (D, A,
H). The 4 primary focus models remained in the same performance classification
category and the majority (>60%) of the eliminated reaches for the 3 reach-scale
models were correctly classified (i.e., as true positives and true negatives). The
stream-scale model, crude gradient, had a reduced kappa value (-0.18 to -0.19),
and only 40% of the eliminated streams were correctly classified. Model A (categorized
conductivity and categorized link magnitude) also had a reduced kappa
value, which decreased from 0.39 to 0.35. Reach-scale models H and D both
experienced increased kappa values, with model H (categorized conductivity)
increasing from 0.30 to 0.33, and model D (categorized conductivity and temperature)
increasing from 0.41 to 0.49. Overall, only slight variation was observed
when model performance was assessed with the two data sets; therefore, all sites
were retained during validation as reported in the results.
In addition, when models are evaluated, researchers often overlook issues
associated with species prevalence (Manel et al. 2001). Therefore, the use of
evaluation statistics like Cohen’s kappa and normalized mutual information
statistic are better suited for situations where prevalence could influence results.
Furthermore, it is also important to ensure that the performance of all models
exceeds the expectations based on chance (Olden et al. 2002). Performance of all
models in this study exceeded the expectations based on chance, except for model
N, which used turbidity as a single variable.
Management implications
Habitat model validation is an essential process to ensure that models are
reliable and that the appropriate model is selected for management policies.
45
T.R. Black, B.K. Jones, and H.T. Mattingly
2013 Southeastern Naturalist Vol. 12, Special Issue 4
Untested or poorly performing models could lead to wasted resources and efforts
focused on conservation goals that would inevitably fail. After field-testing
habitat models, it is evident that Blackside Dace habitat management could focus
on protecting or restoring stream reaches that meet at least 2 of 3 optimal conditions
(summer conductivity less than 240 μS, temperature less than 18.5 oC, and link magnitude
between 3 and 6). Of course, many other habitat conditions are necessary for
Blackside Dace populations to thrive, and our results merely highlight 3 variables
as the most important habitat features elucidated at a 200-m spatial scale.
Identifying important habitat variables at larger and smaller spatial scales (e.g.,
landscape, pool-riffle, microhabitat) also would be a valuable part of future efforts
to conserve Blackside Dace populations.
Abnormally high conductivity within the upper Cumberland River watershed
is most likely linked to numerous anthropogenic perturbations. This
region is located amidst vast coal, natural gas, and timber reserves where
land-use disturbances are widespread and commonplace. Therefore, continued
monitoring of conductivity should be undertaken to better understand its relationship
to land use and Blackside Dace persistence. Our results clearly showed
conductivity to be a predictable indicator of Blackside Dace presence and persistence
in stream reaches. However, the mechanistic or causal link between
conductivity and the likelihood of Blackside Dace persistence has yet to be determined.
Laboratory experiments on the influence of conductivity on various
life stages of dace could identify tolerance thresholds for each life stage and
provide a better understanding of dace vulnerability to elevated conductivity
and its associated ionic components.
The supportive roles played by temperature and link magnitude also warrant
monitoring and use of best management practices (BMPs) within watersheds inhabited
by Blackside Dace. Maintenance of intact riparian corridors would help
ensure that summer temperatures remain within the optimal range (14.6–18.5
oC), and that flow regimes associated with a link magnitude of 3–6 remain conducive
to dace occupancy. Furthermore, it is widely known that sufficiently robust
riparian buffers provide the added benefit of reducing input of sediment and other
pollutants into a waterway.
Acknowledgments
This research project was supported by the US Fish and Wildlife Service, US Geological
Survey, and the Center for the Management, Utilization, and Protection of
Water Resources and the Department of Biology at Tennessee Technological University
(TTU). Completion of the manuscript was facilitated by a TTU Faculty Non-Instructional
Assignment during 2011–2012. We especially thank Jason Detar, Jason Hunt,
and Anthony Smith for their extensive field assistance, and the numerous private
landowners, Kentucky State Nature Preserves Commission, and the US Department
of Agriculture Forest Service for allowing us to access their properties to conduct surveys.
The manuscript was improved by comments from C.A. Brown, J.B. Layzer, D.D.
Smith, and three anonymous reviewers.
T.R. Black, B.K. Jones, and H.T. Mattingly
2013 Southeastern Naturalist
46
Vol. 12, Special Issue 4
Literature Cited
Bain, M.B. 1999. Substrate. Pp. 95–104, In M.B. Bain and N.J. Stevenson (Eds.). Aquatic
Habitat Assessment: Common Methods. American Fisheries Society, Bethesda, MD.
216 pp.
Black, T.B., J.E. Detar, and H.T. Mattingly. 2013. Population densities of the threatened
Blackside Dace, Chrosomus cumberlandensis, in Kentucky and Tennessee. Southeastern
Naturalist 12(Special Issue 4):6-26.
Bernhardt, E.S., B.D. Lutz, R.S. King, J.P. Fay, C.E. Carter, A.M. Helton, D. Campagna,
and J. Amos. 2012. How many mountains can we mine? Assessing the regional degradation
of Central Appalachian rivers by surface coal mining. Environmental Science
and Technology 46:8115–8122.
Bernhardt, E.S., and M.A. Palmer. 2011. The environmental costs of mountaintop mining
valley-fill operations for aquatic ecosystems of the Central Appalachians. Annals of
the New York Academy of Sciences 1223:39–57.
Blomquist, S.M., T.D. Johnson, D.R. Smith, G.P. Call, B.N. Miller, W.M. Thurman, J.E.
McFadden, M.J. Parkin, and G.S. Boomer. 2010. Structured decision-making and
rapid prototyping to plan a management response to an invasive species. Journal of
Fish and Wildlife Management 1(1):19–32.
Burnham, K.P., and D.R. Anderson. 2002. Model Selection and Inference: A practical Information-
Theoretic Approach, 2nd Edition. Springer-Verlag, New York, NY. 488 pp.
Daubenmire, R. 1959. A canopy-coverage method of vegetational analysis. Northwestern
Science 33:43–64.
Detar, J.E., and H.T. Mattingly. 2013. Movement patterns of the threatened Blackside
Dace, Chrosomus cumberlandensis, in two southeastern Kentucky watersheds. Southeastern
Naturalist 12(Special Issue 4):64-81.
Diana, J.S. 2004. Biology and Ecology of Fishes, 2nd Edition. Cooper, Traverse City, MI.
498 pp.
Eisenhour, D.J., and R.M. Strange. 1998. Threatened fishes of the world: Phoxinus cumberlandensis
Starnes & Starnes, 1978 (Cyprinidae). Environmental Biology of Fishes
51:140.
Etnier, D.A., and W.C. Starnes. 2001. The Fishes of Tennessee, 2nd Printing. The University
of Tennessee Press, Knoxville, TN. 689 pp.
Fairchild, G.W., R.J. Horwitz, D.A. Nieman, M.R. Boyer, and D.F. Knorr. 1998. Spatial
variation and historical change in fish communities of the Schuylkill River drainage,
southeast Pennsylvania. American Midland Naturalist 139:282–295.
Fielding, A.H., and J.F. Bell. 1997. A review of methods for the assessment of prediction
errors in conservation presence/absence models. Environmental Conservation
24:38–49.
Frissel, C.A., W.J. Liss, C.E. Warren, and M.D. Hurley. 1986. A hierarchical framework
for stream habitat classification: Viewing streams in a watershed context. Environmental
Management 10:199–214.
Gallagher, A.S., and N.J. Stevenson. 1999. Substrate. Pp. 149–157, In M.B. Bain and N.J.
Stevenson (Eds.). Aquatic Habitat Assessment: Common Methods. American Fisheries
Society, Bethesda, MD. 216 pp.
Helfman, G.S., B.B. Collette, and D.E. Facey. 1997. The Diversity of Fishes. Blackwell
Science, Malden, MA. 528 pp.
Holm, S. 1979. A simple, sequentially rejective multiple test procedure. Scandinavian
Journal of Statistics 6:65–70.
47
T.R. Black, B.K. Jones, and H.T. Mattingly
2013 Southeastern Naturalist Vol. 12, Special Issue 4
Hosmer, D.W., and S. Lemeshow. 2000. Applied Logistic Regression, 2nd Edition. Wiley-
Interscience, New York, NY. 392 pp.
Huff, D.D., S.L. Hubler, and A.N. Borisenko. 2005. Using field data to estimate the
realized thermal niche of aquatic vertebrates. North American Journal of Fisheries
Management 25:346–360.
Jelks, H.L., S.J. Walsh, N.M. Burkhead, and 13 co-authors. 2008. Conservation status of
imperiled North American freshwater and diadromous fishes. Fisheries 33(8):372–407.
Jones, B.K. 2005. Predictive habitat models for conservation of the threatened Blackside
Dace (Phoxinus cumberlandensis). M.Sc. Thesis. Tennessee Technological University,
Cookeville, TN. 75 pp.
Joy, M.K., and R.G. Death. 2002. Predictive modeling of freshwater fish as a biomonitoring
tool in New Zealand. Freshwater Biology 47:2261–2275.
Kanno, Y., C.U. Schmidt, S.B. Cook, and H.T. Mattingly. 2012. Variation in microhabitat
use of the threatened Spotfin Chub (Erimonax monachus) among stream sites and
seasons. Ecology of Freshwater Fish 21:363–374.
Kentucky Division of Water. 2000. Cumberland River basin and Four Rivers region status
report. Kentucky Division of Water, Frankfort, KY.
Koel, T.M., and J.J. Peterka. 2003. Stream fish communities and environmental correlates
in the Red River of the North, Minnesota and North Dakota. Environmental
Biology of Fishes 67:137–155.
Liang, L., S. Fei, J.B. Ripy, B.L. Blandford, and T. Grossardt. 2012. Stream habitat
modelling for conserving a threatened headwater fish in the upper Cumberland
River, Kentucky. River Research and Applications. Available online at doi: 10.1002/
rra.2605.
Manel, S., H.C. Williams, and S.J. Ormerod. 2001. Evaluating presence-absence models
in ecology: The need to account for prevalence. Journal of Applied Ecology
38:921–931.
Master, L.L., S.R. Flack, and B.A. Stein (Eds.). 1998. Rivers of life: Critical watersheds
for protecting freshwater biodiversity. The Nature Conservancy, Arlington,
VA. 71 pp.
Mattingly, H.T., and D.L. Galat. 2004. Predictive performance of a summer microhabitat
model for the threatened Niangua Darter, Etheostoma nianguae. Journal of Freshwater
Ecology 19:109–114.
McAbee, K.T., N.P. Nibbelink, T.D. Johnson, and H.T. Mattingly. 2013. Informing
recovery management of the threatened Blackside Dace, Chrosomus cumberlandensis,
using a Bayesian-belief network model. Southeastern Naturalist 12(Special
Issue 4):143–161.
Nagelkerke, N.J.D. 1991. A note on a general definition of the coefficient of determination.
Biometrika 78:691–692.
O’Bara, C.J. 1988. Ecological and behavioral characteristics of the Blackside Dace Phoxinus
cumberlandensis. US National Forest Service Report, Winchester, KY. 36 pp.
O’Bara, C.J. 1990. Distribution and ecology of the Blackside Dace, Phoxinus cumberlandensis
(Osteichthyes: Cyprinidae). Brimleyana 16:9–15.
Olden, J.D., D.A. Jackson, and P.R. Peres-Neto. 2002. Predictive models of fish species
distributions: A note on proper validation and chance predictions. Transactions of the
American Fisheries Society 131:329–336.
Oliva-Paterna, F.J., A. Andreu, and M. Torralva. 2003. Water quality affects the condition
of Barbus sclateri Günther, 1868 (Pisces, Cyprinidae) in semi-arid reservoirs from the
Iberian Peninsula. Anales de Biologia 25:3–11.
T.R. Black, B.K. Jones, and H.T. Mattingly
2013 Southeastern Naturalist
48
Vol. 12, Special Issue 4
Polivka, K.M. 1999. The microhabitat distribution of the Arkansas River Shiner, Notropis
girardi: A habitat-mosaic approach. Environmental Biology of Fishes 55:26 5–278.
Porter, M.S., J. Rosenfeld, and E.A. Parkinson. 2000. Predictive models of fish species
distribution in the Blackwater Drainage, British Columbia. North American Journal
of Fisheries Management 20:349–359.
Rice, W.R. 1989. Analyzing tables of statistical tests. Evolution 43:223–225.
Richardson, J., J.A.T. Boubee, and D.W. West. 1994. Thermal tolerance and preference
of some native New Zealand freshwater fish. New Zealand Journal of Marine and
Freshwater Research 28:399–407.
Sheldon, A.L. 1988. Conservation of stream fishes: Patterns of diversity, rarity, and risk.
Conservation Biology 2:149–156.
Starnes, L.B., and W.C. Starnes. 1981. Biology of the Blackside Dace, Phoxinus cumberlandensis.
The American Midland Naturalist 106:360–372.
Starnes, W.C. 1981. Listing package for the Blackside Dace, Phoxinus cumberlandensis.
US Fish and Wildlife Service, Asheville, NC. 77 pp.
Starnes, W.C., and D.A. Etnier. 1986. Drainage evolution and fish biogeography of the
Tennessee and Cumberland rivers drainage realm. Pp. 325–361, In C.H. Hocutt and
E.O. Wiley (Eds.). The Zoogeography of North American Freshwater Fishes. John
Wiley, New York, NY. 866 pp.
Starnes, W.C., and L.B. Starnes. 1978. A new cyprinid of the genus Phoxinus endemic to
the upper Cumberland River drainage. Copeia 1978:508–516.
Strahler, A.N. 1957. Quantitative analysis of watershed geomorphology. Transactions of
the American Geophysical Union 8(6):913–920.
US Environmental Protection Agency. 2011. A field-based aquatic-life benchmark for
conductivity in Central Appalachian streams. Office of Research and Development,
National Center for Environmental Assessment, Washington, DC. EPA/600/R-
10/023F.
US Fish and Wildlife Service (USFWS). 1987. Endangered and threatened wildlife and
plants; determination of threatened species status for the Blackside Dace. Federal
Register 52(113):22,580–22,585.
USFWS. 1988. Recovery plan for Blackside Dace (Phoxinus cumberlandensis). Atlanta,
GA. 23 pp.
Walsh, M.J., N.M. Burkhead, and J.D. Williams. 1995. Southeastern freshwater fishes.
Pp. 144–147, In E.T. Laroe, G.S. Farris, C.E. Puckett, P.D. Doran, and M.J. Mac
(Eds.). Our Living Resources: A Report to the Nation on the Distribution, Abundance,
and Health of US Plants, Animals, and Ecosystems. US Department of the Interior,
Washington, DC. 530 pp.
Warren, M.L., and B.M. Burr. 1994. Status of freshwater fishes of the United States:
Overview of an imperiled fauna. Fisheries 19(1):6–8.
Waters, T.F. 1995. Sediment in Streams: Sources, Biological Effects And Control. American
Fisheries Society, Bethesda, MD. 251 pp.
Wood, P.J., and P.D. Armitage. 1997. Biological effects of fine sediment in the lotic environment.
Environmental Management 21:203–217.


 The Southeastern Naturalist is a peer-reviewed journal that covers all aspects of natural history within the southeastern United States. We welcome research articles, summary review papers, and observational notes.