Journal of the North Atlantic
C.A. Chenery, J.A. Evans, D. Score, A. Boyle, and S.R. Chenery
2014 Special Volume X
1
Introduction
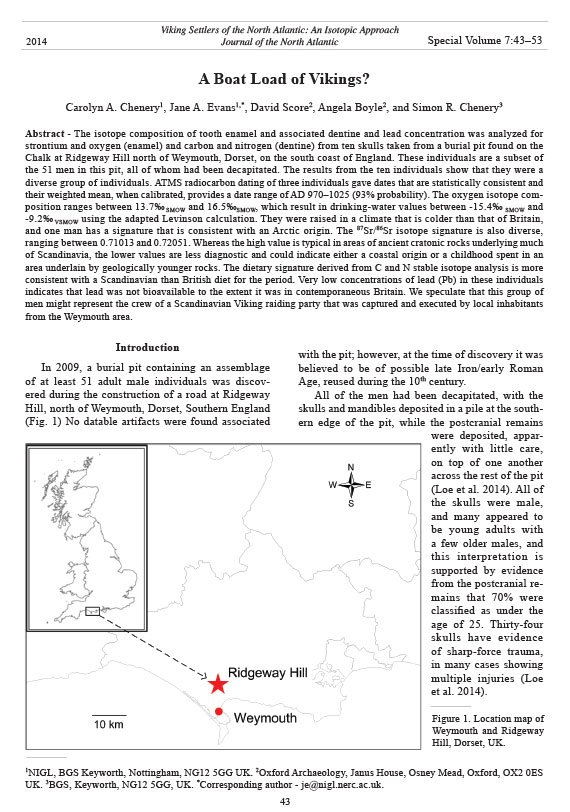
In 2009, a burial pit containing an assemblage
of at least 51 adult male individuals was discovered
during the construction of a road at Ridgeway
Hill, north of Weymouth, Dorset, Southern England
(Fig. 1) No datable artifacts were found associated
with the pit; however, at the time of discovery it was
believed to be of possible late Iron/early Roman
Age, reused during the 10th century.
All of the men had been decapitated, with the
skulls and mandibles deposited in a pile at the southern
edge of the pit, while the postcranial remains
were deposited, apparently
with little care,
on top of one another
across the rest of the pit
(Loe et al. 2014). All of
the skulls were male,
and many appeared to
be young adults with
a few older males, and
this interpretation is
supported by evidence
from the postcranial remains
that 70% were
classified as under the
age of 25. Thirty-four
skulls have evidence
of sharp-force trauma,
in many cases showing
multiple injuries (Loe
et al. 2014).
A Boat Load of Vikings?
Carolyn A. Chenery1, Jane A. Evans1,*, David Score2 , Angela Boyle2 , and Simon R. Chenery3
Abstract - The isotope composition of tooth enamel and associated dentine and lead concentration was analyzed for
strontium and oxygen (enamel) and carbon and nitrogen (dentine) from ten skulls taken from a burial pit found on the
Chalk at Ridgeway Hill north of Weymouth, Dorset, on the south coast of England. These individuals are a subset of
the 51 men in this pit, all of whom had been decapitated. The results from the ten individuals show that they were a
diverse group of individuals. ATMS radiocarbon dating of three individuals gave dates that are statistically consistent and
their weighted mean, when calibrated, provides a date range of AD 970–1025 (93% probability). The oxygen isotope composition
ranges between 13.7‰ SMOW and 16.5‰SMOW, which result in drinking-water values between -15.4‰ SMOW and
-9.2‰ VSMOW using the adapted Levinson calculation. They were raised in a climate that is colder than that of Britain,
and one man has a signature that is consistent with an Arctic origin. The 87Sr/86Sr isotope signature is also diverse,
ranging between 0.71013 and 0.72051. Whereas the high value is typical in areas of ancient cratonic rocks underlying much
of Scandinavia, the lower values are less diagnostic and could indicate either a coastal origin or a childhood spent in an
area underlain by geologically younger rocks. The dietary signature derived from C and N stable isotope analysis is more
consistent with a Scandinavian than British diet for the period. Very low concentrations of lead (Pb) in these individuals
indicates that lead was not bioavailable to the extent it was in contemporaneous Britain. We speculate that this group of
men might represent the crew of a Scandinavian Viking raiding party that was captured and executed by local inhabitants
from the Weymouth area.
Viking Settlers of the North Atlantic: An Isotopic Approach
Journal of the North Atlantic
1NIGL, BGS Keyworth, Nottingham, NG12 5GG UK. 2Oxford Archaeology, Janus House, Osney Mead, Oxford, OX2 0ES
UK. 3BGS, Keyworth, NG12 5GG, UK. *Corresponding author - je@nigl.nerc.ac.uk.
2014 Special Volume X:XX–XX
Figure 1. Location map of
Weymouth and Ridgeway
Hill, Dorset, UK.
Journal of the North Atlantic
C.A. Chenery, J.A. Evans, D. Score, A. Boyle, and S.R. Chenery
2014 Special Volume X
2
The skulls and skeletons exhibit evidence of
multiple blows to the jaw, cranium, and vertebrae
with a large, very sharp weapon such as a sword. The
group is the result of a single execution event during
the time of frequent Viking raids along the south
coast of England (Loe et al. 2014). The skeletal
remains provide an opportunity to examine the lead
concentration and isotope composition and diversity
of this group and assess their origins and perhaps
comment on reasons for their execution.
Isotope background
Strontium, oxygen, and carbon and nitrogen
isotopic systems, reflect local geology (Sr), climate
(O), and diet (C and N), respectively. Oxygen and
strontium isotope compositions are fixed in enamel
biogenic phosphate at the time of tooth formation
(Hillson 1996, Hoppe et al. 2003, Price et al. 2002).
As strontium and oxygen isotopes behave independently
of one another, they provide two variables
for investigating an individual’s place of origin and
migration patterns (Evans et al. 2006). Carbon and
nitrogen isotopes are major constituents of collagen
which is found in bone and dentine. Collagen in
bone turns over at varying rates, depending on the
type of bone and the age of the individual, whereas
the isotope composition of collagen in dentine is
more or less fixed at the time of formation (Sealy et
al. 1995).
Oxygen isotopes
Oxygen isotopes (δ18O) are derived primarily
from ingested fluids and indirectly reflect the isotopic
value of available meteoric/ground/drinking
water (Daux et al. 2008, Levinson et al. 1987).
Drinking water is ultimately derived from meteoric
water, and the oxygen isotope value varies according
to geographical and climatic factors—particularly
temperature, altitude, and distance to the coast
(Dansgaard 1964, Daux et al. 2008, Kohn 1996,
Longinelli 1984, White et al. 1998). The isotopic
value of ground waters varies systematically across
the UK from higher on the west coasts to lower in
the east (Darling et al. 2003). A similar pattern with
more extreme values exists for Western Europe
(IAEA 2006, Lecolle 1985, Longinelli and Selmo
2003), and the Eastern Mediterranean follows a
similar trend (Lykoudis and Argiriou 2007). Oxygen
isotopes (as well as other light, stable isotopes such
as D/H, C, and N) are subject to several stages of
metabolic fractionation, from drinking water to body
fluids and again from body fluids to bio-phosphates
(bone and tooth enamel). This fractionation is fairly
well understood and predictable, thus allowing the
calculation of drinking-water values to assist in determining
an individual’s place of origin (Daux et al.
2008, Levinson et al. 1987, Longinelli 1984).
The overall δ18O isotope range for UK ground/
drinking water ranges between -9.0‰ and -4.5‰SMOW
(Darling et al. 2003). The mean expected value
for the Weymouth area is -6.5‰ and range for
Southern Britain is between -6.0‰ to -7.0‰SMOW.
Proxie drinking-water oxygen isotope values are
not available for the Medieval warm pariod and the
time of the Weymouth burials. However, northern
hemisphere reconstructions by Mann et al. (2008),
Moberg et al. (2005), and Mann and Jones (2003)
indicate that temperatures for the period AD 1000 to
1100 were “... similar to those observed in the twentieth
century before 1990” (Moberg et al. 2005).
Strontium isotopes
Strontium isotopes (87Sr/86Sr) in the body tissues
are derived from food and directly relate to the
geology of the area where the food was produced
(Bentley 2006, Evans et al. 2006, Montgomery et al.
2005). Strontium isotopes, unlike oxygen, carbon,
and nitrogen, are not fractionated by metabolic functions.
The Ridgeway Hill site lies on chalk but is within
7 km of Weymouth centre, which is situated on
London clay. The biosphere map of Britain (Evans
et al. 2010) suggests that individuals raised locally
at Ridgeway Hill will have childhood tooth enamel
values between 0.708–0.709 for anyone raised specifically
on chalk, and between 0.709–0.710 if raised
on the nearby London clay. Hence, the best estimate
of a local signature is between 0.708 and 0.710
based on these two dominant lithologies.
Carbon and nitrogen isotopes
Isotope analysis of carbon (δ13C) and nitrogen
(δ15N) in collagen provide evidence for sources of
dietary intake—plant carbohydrates (fruits, vegetables,
and grains) and animal protein (meat, fish and
milk products), respectively (Sealy 2001). Nitrogen
isotopes primarily provide information about position
in the food chain, as each step up the food chain
(trophic level) entails a fractionation of 3–5‰ from
diet to consumer (Hedges and Reynard 2007). Thus,
in general, the higher the nitrogen isotope values the
greater consumption of animal protein. A significant
consumption of marine protein will be reflected in
higher δ15N values (Fischer et. al. 2007, Müldner and
Richards 2007). Due to different photosynthetic pathways,
different plant types can be distinguished by
their isotope values. C4 plants (usually tropical grasses
such as maize, millet, or sugarcane) have higher
Journal of the North Atlantic
C.A. Chenery, J.A. Evans, D. Score, A. Boyle, and S.R. Chenery
2014 Special Volume X
3
carbon isotope values than C3 plants (almost all other
grains, fruits, and vegetables). A high consumption of
marine foods would also results in higher carbon isotope
values than would be expected from non-marine
consumers from the same location/region.
Materials and Method
For the purpose of identifying childhood place of
origin and evidence of migration, oxygen and strontium
isotopes from the enamel of second adult molars
(M2s) were analyzed for each of the 10 individuals.
The enamel of M2s represent early childhood (3–7
yrs). To assess the childhood diet of these individuals,
carbon and nitrogen isotopes were analyzed in
collagen extracted from the dentine of the same teeth
subjected to oxygen and strontium isotope analysis.
Lead-concentration analyses were carried out on
enamel to determine cultural lead exposure. In addition,
bone from three individuals were sent to the
SUERC Radiocarbon Facility for dating.
Tooth sample preparation
Each tooth was cut in half using a flexible diamond-
edged rotary dental saw. The half selected for
analysis was cleaned ultrasonically for five minutes
in high-purity water and rinsed twice to remove
loosely adhered material. A tungsten carbide dental
burr was used to abrade off the enamel surface to
a depth of >100 microns. Secondary dentine was
removed and discarded, and the enamel and primary
dentine were separated. The dentine was reserved
for carbon and nitrogen analyses, and the enamel
was prepared for oxygen and strontium analysis as
described below.
Strontium isotope analysis
In a clean laboratory, the enamel samples were
washed in acetone and cleaned twice, ultrasonically,
in high-purity water to remove dust and impurities.
They were dried and weighed into pre-cleaned Teflon
beakers. Each sample was mixed with 84Sr tracer
solution and then dissolved in Teflon-distilled 16M
HN03. The sample was then converted to chloride
and taken up in 2.5M HCl. Strontium was collected
using conventional, Dowex® resin ion-exchange
methods.
The Sr isotope composition and concentrations
were determined by thermal ionization mass
spectroscopy (TIMS) using a Thermo Triton multicollector
mass spectrometer. Samples were run at
c 5V using single Re filaments loaded using TaF
following the method of Birck (1986). The international
standard for 87Sr/86Sr, NBS987, gave a value
of 0.710227 ± 0.000007 (1σ, n = 26). All strontium
ratios have been corrected to a value for the standard
of 0.710250. Strontium procedural blanks provided
a negligible contribution.
Lead-concentration analysis
The elemental Pb concentrations of the enamel
samples and quality-control materials were determined
using an Agilent quadropole ICP-MS instrument.
The instrument was calibrated using a series
of synthetic chemical solutions diluted from multielement
stock solutions (SPEX Certprep®), and the
calibration was validated using synthetic chemical
standards from a separate source (Schroeder et al.
2013). The digest solutions were diluted such that
the calcium concentration was between 100 and 200
ppm, optimal for long-term instrument stability, beta
detection limits, and all elements falling within the
defined calibration range. The reproducibility of the
lead-concentration data is ±10% (2σ).
Oxygen isotope analysis
Biogenic phosphate was converted to silver phosphate
(Ag3PO4) using a method based on (O’Neil et
al. 1994) and is briefly summarized here. The core
enamel samples were crushed to a fine powder and
cleaned in hydrogen peroxide for 24 hours to remove
organic material. The peroxide was evaporated to
dryness, and the sample was then dissolved in 2M
HNO3. The sample solutions were transferred to
clean polypropylene test tubes, and each sample was
treated with 2M KOH followed by 2M HF to remove
Ca from the solution by precipitation. The following
day, the samples were centrifuged, and the solution
was added to beakers containing silver amine solution,
and precipitated silver phosphate was filtered,
rinsed, and dried. Approximately 0.36-mg aliquots
of Ag3PO4 were weighed into silver capsules for
analysis.
Analytical measurement was by continuous
flow isotope ratio mass spectrometry (CFIRMS)
using the method of Vennemann et al. (2002). The
instrumentation is comprised of a thermo chemical
elemental analyser (TC/EA) coupled to a Delta Plus
XL isotope ratio mass spectrometer via a ConFlo III
interface, all by Thermo Finnigan.
All reported isotope ratios are expressed using
the delta (δ) notation in parts per thousand (permil:
‰) relative to a standard:
δ(‰) = ([Rsample/Rstandard] - 1) x 1000
The reference material NBS120C, calibrated against
certified reference material NBS127 (assuming δ18O
of NBS127 = +20.3‰ versus Standard Mean Ocean
Journal of the North Atlantic
C.A. Chenery, J.A. Evans, D. Score, A. Boyle, and S.R. Chenery
2014 Special Volume X
4
Water [SMOW]), has an expected value of 21.70‰
(Chenery et. al. 2010). Each sample was analysed in
triplicate. The mean internal mass spectrometry reproducibility
was ± 0.13‰ (1σ, n = 3) for this set of
analyses and 0.21‰ (1σ, n = 3) for the batch control
(external reproducibility of the full chemical procedure).
Throughout this paper, drinking-water values
are derived using the Levinson equation (δ18Ow =
[δ18Op - 19.4] / 0.46; Levinson et al. 1987) modified
to take into account a -1.4 method bias correction between
Ag3PO4 and BiPO4 (see Chenery et al. 2010).
Carbon and Nitrogen analysis of collagen
The samples were prepared following a modified
Longin method (Brown et al. 1988), described
briefly below. Approximately 30–100 mg of dentine
was covered with 8 ml of cold 0.5-M HCl to demineralize.
The remaining solid collagen was rinsed
and solubilized in a solution of pH 3 HCl at 70 ºC
in a hot block for 48 hours. The solutions were then
filtered using an 8-μm Ezze filter to remove solids
before freeze drying. Three 0.6-mg aliquots from
each collagen sample were weighed into small tin
capsules for analysis. Analysis of carbon and nitrogen
isotopes was by CFIRMS. The instrumentation
is comprised of an elemental analyser (Flash/EA)
coupled to a ThermoFinnigan Delta Plus XL isotope
ratio mass spectrometer via a ConFlo III interface.
All reported isotope ratios are expressed using
the delta (δ) notation in parts per thousand (permil:
‰) relative to a standard:
δ(‰) = ([Rsample/Rstandard] - 1) x 1000
Collagen carbon and nitrogen isotopes ratios (δ13C
and δ15N) are reported in per mil (‰) relative to
Vienna Pee Dee Belemnite (vPDB) and ambient inhalable
reservoir (AIR) standards, respectively. δ13C
and δ15N ratios were calibrated using an in-house
reference material M1360p (powdered gelatine from
British Drug Houses) with expected delta values
of -20.32‰ (calibrated against CH7; IAEA 2006)
and +8.12‰ (calibrated against N-1 and N-2; IAEA
2006) for C and N, respectively. The 1σ reproducibility
for mass spectrometry controls were δ15N =
±0.06‰ and δ13C = ±0.06‰ (1σ, n = 15) in this batch
of analysis and δ15N = ±0.10‰ and δ13C = ±0.06‰
(1σ, n = 3) for the batch control (external reproducibility
of the full chemical procedure). All isotope
data are presented in Table 1, and all errors are given
at 1σ except where stated otherwise.
Results
Radiocarbon dating
ATMS radiocarbon dating of three individuals
gave the following results. A right tibia from
a partial skeleton (3698) produced a date of AD
890–1030 (95.4% probability, GU-19115, 1055 ± 40
BP). A midshaft of left fibula (skeleton 3804) produced
a date of AD 970–1050 plus AD 1080–1160
(95.4% probability, SUERC-27335, 1005 ± 30 BP).
A second midshaft of left fibula (skeleton 3763)
produced a date of AD 890–1020 (95.4% probability,
SUERC-27339, 1090 ± 30 BP). The three
dates are statistically consistent, and their weighted
mean when calibrated provides a date range of AD
970–1025 (93% probability). This result places the
age of the pit within the Saxon period broadly in the
reign of Aethelred the Unready (AD 978–1016).
Oxygen isotopes
Oxygen isotope data for each tooth is presented
in Table 1 and plotted against Sr isotope composition
in Figure 2. The δ18Op range for this group is
between +13.7‰ SMOW and +16.6‰ SMOW. The calculation
of drinking-water values for this range of
Table 1. Isotope data from teeth taken from 10 skulls from a burial pit found on the Chalk at Ridgeway Hill north of Weymouth,
Dorset, on the south coast of England. A = adult, YA = young adult.
Sr Pb δ18O PO4‰ δ18O DW‰
Sample Age Tooth (ppm) 87Sr/86Sr (ppm) (SMOW) (Levinson) δ13C‰ δ15N‰
WEY08 SK3704 A URM2 70.4 0.71156 0.11 15.2 -12.2 -20.3 13.4
WEY08 SK3706 A ULM2 84.5 0.71032 0.17 15.9 -10.7 -20.4 10.4
WEY08 SK3707 YA LLM2 82.2 0.71306 0.13 15.1 -12.3 -19.8 13.1
WEY08 SK3710 A URM2 73.5 0.71060 0.09 16.6 -9.1 -21.0 11.7
WEY08 SK3711 A LLM2 95.2 0.71377 0.11 13.7 -15.5 -20.8 10.3
WEY08 SK3720 A LRM2 117.0 0.71294 0.09 15.6 -11.4 -20.8 12.6
WEY08 SK3724 YA LLM2 58.0 0.72051 0.15 15.8 -11.0 -21.1 12.4
WEY08 SK3730 YA? ULM2 97.6 0.71013 0.26 16.1 -10.2 -20.6 11.3
WEY08 SK3739 YA LLM2 61.2 0.71089 0.36 15.4 -11.6 -21.1 12.0
WEY08 SK3744 A LRM2 84.6 0.71072 0.10 15.8 -10.9 -19.9 13.8
Journal of the North Atlantic
C.A. Chenery, J.A. Evans, D. Score, A. Boyle, and S.R. Chenery
2014 Special Volume X
5
values is sensitive to the equation used and varies
between drinking-water (δ18ODW) ranges of -15.5‰
and -9.2‰ using a modified Levinson equation
(Chenery et al. 2010) and -12.6 ‰ to -8.2‰ using
equation 6 from Daux et al. (2008), where δ18Ow =
1.54 x δ18Op - 33.72. When using the latter equation,
some of these individuals fall within the more depleted
range of British values. The calculated δ18ODW
values for the group as a whole are low compared to
those expected for the UK (-5‰ to -9‰; Darling et
al. 2003) and are compatible with colder regions in
Northern Europe such as Norway, Sweden, Finland,
and Russia as well as parts of the Alps (Fig. 3).
The oxygen isotope composition of eight of the
individuals are between +15.1‰ SMOW and +16.1‰
SMOW (δ18ODW =-12.3‰ to -10.3‰) with an outlier
(Wey08-SK3710) at 16.6‰ SMOW (δ18ODW =-9.2‰
SMOW) and an extreme outlier (Wey08-SK3711) at
+13.7‰ SMOW (δ18ODW=-15.5‰ SMOW). This last individual
has the lowest δ18O tooth enamel value yet
found in Britain. Individual Wey08-SK3710 has the
highest δ18O value, which would restrict his origins
within Scandinavia to southern areas of Norway
and Sweden, the Kattegat coast of Denmark, and
southern Baltic countries, but these values are also
consistent with large areas of central Europe. The
origin of individual Wey08-SK3711, with the lowest
δ18O value, is compatible with areas above the Arctic
Circle, or Central Russia.
Strontium isotopes
Strontium isotope data for each tooth is presented
in Table 1 and Figure 2. There is a wide range
of values (0.71013 to 0.72051), which points to a
diversity of origins for these individuals and confirms
that none of them are “local” in the sense of
having been raised in southern England (within the
range 0.708–0.710; Evans et al. 2010). The highest
87Sr/76Sr value of 0.72051 (Wey08-SK3724) is very
rare in the UK (Evans et al. 2010), but is compatible
with the Precambrian geological terrains in Norway
and Sweden. The strontium isotope composition of
the other individuals does not exclude them from
having been raised in Britain, but such values can
equally be found in Scandinavia and the continent
(Evans et al. 2010, Voerkelius et al. 2010).
Norway and Sweden are composed of old rocks
of Palaeozoic and Precambrian age. There is limited
strontium biosphere data available from this
area. High values (>0.72) are recorded for animals
Figure 2. Plot of strontium and oxygen isotope data for Ridgeway Pit individuals, showing the locally expected 87Sr/86Sr range
and UK range for d18O in UK drinking water.
Journal of the North Atlantic
C.A. Chenery, J.A. Evans, D. Score, A. Boyle, and S.R. Chenery
2014 Special Volume X
6
into two phases: 1) the Neolithic to Iron Age when
the only exposure is either natural or minimal, and
2) the last two millennia where lead became a pollutant
resulting in bio-available exposure as soluble
lead compounds. By the 8th–11th centuries AD, the
median lead concentration in tooth enamel in Britain
was 1.93 ppm (Montgomery et al. 2010). The very
low level of lead recorded in this study indicates that
the men came from a society where lead was not
bio-available to the extent that is was in Britain at
the same time, and hence the lead concentration data
would support an origin outside of Britain.
Carbon and nitrogen isotopes
Carbon and nitrogen isotope results for dentine
from each individual can be found in Table 1. The
δ13C values for this group ranges from -21.1‰ to
-19.8‰ with a mean of -20.6 ± 0.5‰ (1σ), and δ15N
values range from 10.3‰ to 13.8‰ with a mean of
12.16 ± 1.2‰ (1σ). These results can be compared
to published data from British, Belgian, and Scandinavian
populations (see Figs. 4, 5). Comparing
our data to British populations (Fig. 4), we find
that the Weymouth δ13C values fall within the range
for British Iron Age to Anglo Saxon populations of
-21.2‰ to -19.1‰, (mean = -23.2‰ ± 0.4‰, 1σ,
n = 192; Jay and Richards 2006, Muldner and Richards
2007, Privat et al. 2007, Richards et al. 1998),
which have been intrepreted as being primarily
terrestrial-based diets. However the majority of the
Weymouth population have significantly higher
and lake waters in Sweden by Aberg et al. (1995).
Samples from 45 rivers plot largely between 0.72
and 0.74 from Sweden and Finland (Aberg and Wickman
1987). Human tooth-enamel data from southern
Sweden records a range between 0.7104 in coastal
Sweden to 0.7295 in more inland areas (Sjögren et al.
2009), which is a close match for the range of values
found in the Weymouth group and suggests that the
lower values may indicate an origin near the coast.
Such lowering of biosphere values in coastal regions
has been demonstrated by Evans et al. (2010). The
geology of Denmark is very different. It comprises
largely young, Cainozoic sediments which give biosphere
values of 0.7096 ± 0.0015 (2σ) for most of the
country (Frei and Frei 2011).
Hence, the Scandinavian countries of Denmark,
Norway, Sweden, and Finland are consistent with
the range of Sr isotope values seen in these samples.
The values over 0.711 are most likely to be from the
Norway, Sweden, and Finland, whereas the values
below 0.711 are much more common in Denmark
and coastal areas.
Lead concentrations in tooth enamel.
The lead concentrations recorded in these 10
tooth-enamel samples are all below 0.4 ppm, and
many are below 0.2 ppm (Table 1). Such low values
correspond to values from “Prehistoric” individuals
in the UK (Montgomery et al. 2010). In Britain, the
changes in lead concentration in tooth enamel are
related to exposure to lead sources and can be split
Figure 3. Isotope map of Scandinavia compiled from IAEA/WMO (2006). IDW long-term annual average precipitation d18O
map.
Journal of the North Atlantic
C.A. Chenery, J.A. Evans, D. Score, A. Boyle, and S.R. Chenery
2014 Special Volume X
7
Figure 4. A comparison of
carbon and nitrogen isotope
composition of the
Ridgeway Pit individuals
with UK data. Data taken
from: 1) Iron Age, Wetwang,
Yorkshire (Jay and
Richards 2006); 2) Iron
Age, Poundbury, Dorset,
UK (Richards et al. 1998);
3) Anglo-Saxon (individuals
greater than 4 years of age),
Berinsfield, Oxfordshire,
UK (Privat et al. 2007); 4)
Anglian (late 8th to early 9th
century), York, UK (Müldner
and Richards 2007);
5) Medieval, Belgium (Polet
and Katzenberg 2003);
6) late 13th century, Warrington,
Cheshire (Müldner
and Richards 2005); 7) late
12th to late 13th century,
Fishergare, York, (Müldner
and Richards 2007); 8) 10th
–16th century, Warram Percy, Yorkshire, UK (Fuller et al. 2003); 9) 12th –15th century, Brompton Bridge, North Yorkshire,
UK(Müldner and Richards 2005); and 10) Weymouth pit burial, this study.
Richards 2007), and 12th–15th-century Brompton
Bridge, North Yorkshire, UK (Müldner and Richards
2005), where diets contained marine and riverine
fish components.
δ15N values than these groups and are more similar
to those found in late-13th-century Warrington,
Cheshire (Müldner and Richards 2005), late-12th- to
late-13th-century Fishergare, York, (Müldner and
Figure 5. A comparison of
carbon and nitrogen isotope
composition of the
Ridgeway Pit individuals
with Scandinavia. Data
taken from: 1) Rossberga,
Sweden, Stone Age, Inland
(Liden 1995); 2, Resmo,
Sweden, Stone Age, Coastal
(Liden 1995); 3) Denmark
Neolithic Inland (Fischer et
al. 2007); 4 Denmark Neolithic
Coastal (Fischer et
al. 2007); 5) Bjarby, 1st–2nd
century Roman Period, Sweden,
M2 data only (Eriksson
et al. 2008); 6) Bjorned, N.
Sweden, Christian,10th –
13th century (Linderholm et
al. 2008b); 7) Sigtuna, Sweden,
Christian, Phase, A.D.
900–1100 (Kjellstrom et al.
2009); 8) Birka, Sweden,
Viking Period, 9th -10th century;
6 (Linderholm et al.
2008a); and 9) Weymouth
pit burial, this study.
Journal of the North Atlantic
C.A. Chenery, J.A. Evans, D. Score, A. Boyle, and S.R. Chenery
2014 Special Volume X
8
In contrast, the Weymouth data lies within the
range for the Scandinavian data (Fig. 5) and in
particular is similar to data from Bjorned, N. Sweden,
Christian, 10th–13th century (Linderholm et al.
2008b) and Birka, Sweden, Viking Period, 9th–10th
century (Linderholm et al. 2008a). The combined
δ13C data for Bjorned and Birka range from -20.2‰
to -19.0‰ (mean = -20.3 ± 0.7‰, 1σ, n = 70) and for
δ15N from 12.5‰ to 16.5‰. These results suggests
that the Weymouth individuals are likely to have had
a diet similar to that of the Bjorned and Birka communities,
which has been interpreted as being terrestrial
with a significant freshwater fish component.
Discussion: Where could this group of men have
originated?
This group of individuals show a diversity of
origins, with two very significant outliers in terms of
oxygen isotope composition (WEY08 SK3711) and
strontium isotope composition (WEY08 SK3724).
At the same time, however, the oxygen isotope data
provides strong evidence that the ten men whose teeth
have been analyzed, and by inference the rest of the
group of 51, were all raised in a climate that was considerably
colder than that of Britain. The majority are
consistent with an origin in much of central Norway,
Sweden, Finland, and parts of western Russia. The
man with the most depleted oxygen isotope signature
is more likely to have had a childhood origin in
arctic Scandinavia or arctic/central Russia. The lead
concentrations indicate that these men had lower
levels of lead exposure than typical for inhabitants
of 8th–11th-century Britain. The carbon and nitrogen
data reflect a Scandinavian diet with a higher nitrogen
isotope value than the equivalent British diet from the
same period. The strontium isotopes are consistent
with a Scandinavia origin. The value of 0.72 (WEY08
SK3724) is entirely consistent with a childhood origin
on old Precambrian cratonic rocks that underlie
most of Norway, Sweden, and Finland in the form of
the Baltic shield. The values near 0.713 (three individuals)
are consistent with areas of Palaeozoic rocks
and the values of 0.710 to 0.711 are more typical of
either areas of younger rocks or coastal areas (Evans
et al. 2010).
The period of 970 and 1025 AD to which these
executed men are dated saw the onset of regular
Viking attacks on England. “A.D. 982. In this year
came up in Dorsetshire three ships of the pirates,
and plundered in Portland. The same year London
was burned” (from Ingram’s [1823] translation of
“The Anglo-Saxon Chronicle”). Ethelred II started
paying Danegeld to try to minimize the attacks on
London during the period A.D. 991–994, and in
1009, Olaf Harrisen destroyed London Bridge and
helped the Danes conquer England. Canute gained
control of England in A.D. 1016 and was crowned
King of England in A.D. 1018.
It is tempting to consider that an event such as a
mass execution might be recorded historically, and
the Anglo Saxon Chronicles do provide descriptions
of such events that might be appropriate. The St.
Brices Day massacre occurred during the appropriate
time period, but this event involved the local
population turning upon resident Viking settlers and
hence the massacre victims might be expected to be
of mixed age and sex and some would likely have
been born in England.
One event that could account for the execution
of 51 men is described below from the Anglo Saxon
chronicles for AD 992:
“A.D. 992. This year the blessed Archbishop
Oswald departed this life, and sought a heavenly
one; and in the same year died Alderman
Ethelwin. Then the king and all his council
resolved, that all the ships that were of any account
should be gathered together at London; and
the king committed the lead of the land-force to
Alderman Elfric, and Earl Thorod, and Bishop
Elfstan, and Bishop Escwy; that they should try
if they could anywhere without entrap the enemy.
Then sent Alderman Elfric, and gave warning to
the enemy; and on the night preceding the day
of battle he sculked away from the army, to his
great disgrace. The enemy then escaped; except
the crew of one ship, who were slain on the spot.
Then met the enemy the ships from East-Anglia,
and from London; and there a great slaughter was
made, and they took the ship in which was the
alderman, all armed and rigged.” (Ingram 1823)
The Anglo Saxon chronicle also refers to frequent
raids on Exmouth and Wiltshire between 1001
and 1003; however, there are no references to Weymouth
or specific mention of locals defeating the
raiding parties.
The slaughter of a ship’s crew would fit well
with the fact that this executed group was all male
and mostly in their twenties suggesting some type
of warring or raiding group of men. Fifty one men
would provide a realistic-sized crew for a Viking
longship and conform to a model of 25 pairs of oarsmen
and one cox from one of the larger boat designs
(Hale 1998). Whether or not we shall ever make a
positive historical identification of this event remains
unknown. What we can take from this discovery is
that the massacre site contains the largest group of
first-generation Scandinavian individuals to be found
within the archaeological record of Britain to date.
Journal of the North Atlantic
C.A. Chenery, J.A. Evans, D. Score, A. Boyle, and S.R. Chenery
2014 Special Volume X
9
Dansgaard, W. 1964. Stable isotopes in precipitation. Tellus
16:171–177.
Darling, W.C., A.H. Bath, and J.C.Talbot. 2003. The O &
H stable isotopic composition of fresh waters in the
British Isles: 2, Surface waters and groundwater. Hydrology
and Earth System Sciences 7:183-195.
Daux, V., C. Lecuyer, M. A. Heran, R. Amiot, L. Simon,
F. Fourel, F. Martineau, N. Lynnerup, H. Reychler,
and G. Escarguel. 2008. Oxygen isotope fractionation
between human phosphate and water revisited. Journal
of Human Evolution 55:1138–1147.
Eriksson, G., A. Linderholm, E. Fornander, M.Kanstrup,
P.Schoultz, H. Olofsson, and K. Liden. 2008. Same
island, different diet: Cultural evolution of food practice
on Oland, Sweden, from the Mesolithic to the Roman
Period. Journal of Anthropological Archaeology
27:520–543.
Evans, J., N. Stoodley, and C. Chenery. 2006. A strontium
and oxygen isotope assessment of a possible fourthcentury
immigrant population in a Hampshire cemetery,
southern England. Journal of Archaeological
Science 33:265–272.
Evans, J.A., J. Montgomery, G. Wildmanand, and N.
Boulton. 2010. Spatial variations in biosphere 87Sr/86Sr
in Britain. Journal of the Geological Society 167:1–4.
Fischer, A., M. Richards, J. Olsen, D.E. Robinson, P.
Bennike, L. Kubiak-Martens, and J. Heinemeier.
2007. The composition of mesolithic food: Evidence
from the submerged settlement on the Argus Bank,
Denmark. Acta Archaeologica 78:163–180.
Frei, K.M., and R. Frei. 2011. The geographic distribution
of strontium isotopes in Danish surface waters: A base
for provenance studies in archaeology, hydrology, and
agriculture. Applied Geochemistry 26:325–340.
Fuller, B.T., M.P. Richards, and S. Mays. 2003. Stable
carbon and nitrogen isotope variations in tooth dentine
serial sections from Wharram Percy. Journal of
Archaeological Science 30:1673–1684.
Hale, J.R. 1998. The Viking Long Ship. Scientific American
278:46–63.
Hedges, R.E.M., and L.M. Reynard. 2007. Nitrogen isotopes
and the trophic level of humans in archaeology.
Journal of Archaeological Science 34:1240–1251.
Hillson, S. 1996. Dental Anthropology. Cambridge University
Press, Cambridge, UK.
Hoppe, K.A., P.L. Koch, and T.T. Furutani. 2003. Assessing
the preservation of biogenic strontium in fossil
bones and tooth enamel. International Journal of Osteoarchaeology
13:20–28.
International Atomic Energy Agency (IAEA). 2006.
Global network of isotope precipitation. Available
online at http://www-naweb.iaea.org/napc/ih/IHS_resources_
gnip.html. Accessed 9 October 2014.
Ingram, Rev. J. 1823. Anglo Saxon Chronicles. London,
1823. Published in “The Anglo-Saxon Chronicle”,
Everyman Press, London, UK, 1912. Available on
line at http://omacl.org/Anglo/part3.html. Accessed 9
October 2014.
Jay, M., and M.P. Richards. 2006. Diet in the iron age
cemetery population at Wetwang Slack, East Yorkshire,
UK: Carbon and nitrogen stable isotope evidence.
Journal of Archaeological Science 33:653–662.
Conclusions
1. The oxygen isotope composition of the tooth
enamel of these individuals is beyond the range of
UK values and consistent with an origin in a colder
climate.
2. The calculated drinking water oxygen isotope
composition is consistent with an origin in Scandinavian
countries. One individual (Wey08-3724) is
compatible only with an origin north of the arctic
circle in the most northerly areas of Scandinavia or
central Russia.
3. The strontium supports the “non local” origin for
the individuals insofar as none were raised on the
local chalk in Britain.
4. The lead concentrations are low, 0.09–0.36 ppm,
and are not typical of individuals from 8th–11thcentury
A.D. Britain.
5. The range of both strontium and oxygen isotope
values shows that this is a group of people who do
not have a common geographic origin.
6. The carbon and nitrogen isotope data most closely
match populations from Scandinavian Roman and
Viking periods, which is typified by a high-protein
diet.
7. The data are consistent with this being a group of
“Viking” raiding/pirating men who originated from
a variety of places within Scandinavia.
Acknowledgments
We thank Dorset County Council for their permission
to work on this material.
Literature Cited
Aberg, F., and F.E. Wickman. 1987. Variations in 87Sr/86Sr
in water from streams discharging into the Bothnian,
Bay, Baltic sea. Nordic Hydrology 18:33–42.
Aberg, G., T. Wickman, and H. Mutvei. 1995. Strontium
isotope ratios in mussel shells as indicators of acidification.
Ambio 24:265–268.
Bentley, R.A., 2006. Strontium isotopes from the earth to
the archaeological skeleton: A review. Journal of Archaeological
Method and Theory 13:135–187.
Birck, J.L. 1986. Precision K-Rb-Sr isotopic analysis:
Application to Rb-Sr chronology. Chemical Geology
56:73–83.
Brown, T.A., D.E.Nelson, J.S Vogel, and J.R. Southon.
1988. Improved collagen extraction by modified Longin
method. Radiocarbon 30:171–177.
Chenery, C., G. Müldner, J.A. Evans, H. Eckardt, and M.
Lewis. 2010. Strontium and stable isotope evidence
for diet and mobility in Roman Gloucester, UK. Journal
of Archaeological Science 37:150–163.
Journal of the North Atlantic
C.A. Chenery, J.A. Evans, D. Score, A. Boyle, and S.R. Chenery
2014 Special Volume X
10
Pp. 204–226, In H. Eckardt (Ed.). Roman Diasporas:
Archaeological Approaches to Mobility and Diversity
in the Roman Empire. Journal of Roman Archaeology
Supplement, Portsmouth, RI, USA.
Müldner, G., and M.P. Richards. 2005. Fast or feast: Reconstructing
diet in later medieval England by stable
isotope analysis. Journal of Archaeological Science
32:39–48.
Muldner, G., and M.P. Richards. 2007. Diet and diversity at
later medieval fishergate: The isotopic evidence. American
Journal of Physical Anthropology 134:162–174.
O’Neil, J.R., L.J. Roe, L. Reinhard, and R.E. Blake. 1994.
A rapid and precise method of oxygen isotope analysis
of biogenic phosphate. Israel Journal of Earth Science
43:203–212.
Polet, C., and M.A. Katzenberg. 2003. Reconstruction of
the diet in a mediaeval monastic community from the
coast of Belgium. Journal of Archaeological Science
30:525–533.
Price, T.D., J.H. Burtonand, R.A. Bentley. 2002. The
characterization of biologically available strontium
isotope ratios for the study of prehistoric migration.
Archaeometry 44:117–135.
Privat, K.L., T.C. O’Connell, and R.E. M Hedges. 2007.
The distinction between freshwater- and terrestrialbased
diets: Methodological concerns and archaeological
applications of sulphur stable isotope analysis.
Journal of Archaeological Science 34:1197–1204.
Richards, M.P., R.E.M Hedges, T.I. Molleson, and J.C.
Vogel. 1998. Stable isotope analysis reveals variations
in human diet at the Poundbury Camp cemetery site.
Journal of Archaeological Science 25:1247–1252.
Schroeder, H., K.A. Shuler, and S.R. Chenery. 2013.
Childhood lead exposure in an enslaved African community
in Barbados: Implications for birthplace and
health status. American Journal of Physical Anthropology
150:203–209.
Sealy, J. 2001. Handbook of Archaeological Sciences.
Wiley, London, UK.
Sealy, J., R. Armstrong, and C. Schrire. 1995. Beyond
lifetime averages: Tracing life histories thougth isotopic
analysis of different tissues from archaeological
human skeletons. Antiquity 69:290–300.
Sjögren, K.G., T.D. Price, and T. Ahlstrom. 2009. Megaliths
and mobility in southwestern Sweden. Investigating
relationships between a local society and its
neighbours using strontium isotopes. Journal of Anthropological
Archaeology 28:85–101.
Vennemann, T.W., H.C. Fricke, R.E. Blake, J.R. O’Neil,
and A. Colman. 2002. Oxygen isotope analysis of
phosphates: A comparison of techniques for analysis
of Ag3PO4. Chemical Geology 185:321–336.
Voerkelius, S., G.D. Lorenz, S. Rummel, C.R. Quétel,
G. Heiss, M.C. Baxter, B.-P.P. Deters-Itzelsberger,
S. Hoelzl, J. Hoogewerff, E. Ponzevera, M.V. Bocxstaele,
and H. Ueckermann. 2010. Strontium isotopic
signatures of natural mineral waters, the reference to a
simple geological map, and its potential for authentication
of food. Food Chemistry 118:933–940.
White, C.D., M.W. Spence, H.L.Q Stuart-Williams, and
H.P. Schwarcz. 1998. Oxygen isotopes and the identi-
Kjellstrom, A., J. Stora, G. Possnert, and A. Linderholm.
2009. Dietary patterns and social structures in medieval
Sigtuna, Sweden, as reflected in stable isotope
values in human skeletal remains. Journal of Archaeological
Science 36:2689–2699.
Kohn, M.J. 1996. Predicting animal delta O-18: Accounting
for diet and physiological adaptation. Geochimica
Et Cosmochimica Acta 60:4811–4829.
Lecolle, P., 1985. The oxygen isotope composition of
landsnail shells as a climatic indicator: Applications
to hydrogeology and palaeoclimatology. Chemical
Geology 58:157–181.
Levinson, A.A., B. Luz, and Y. Kolodny. 1987. Variations
in oxygen isotope compositions of human teeth and
urinary stones. Applied Geochemistry 2:367–371.
Liden, K. 1995. Megaliths, agriculture, and social
complexity: A diet study of two Swedish megalith
populations. Journal of Anthropological Archaeology
14:404–417.
Linderholm, A., K. Andersson, C.-M. Mörth, L. Grundberg,
B. Hårding, and K. Liden. 2008a. An early
Christian cemetery at Björned in northern Sweden.
Stable isotope analyses of skeletal material. Fornvännen
103:176–189.
Linderholm, A., C.H Jonson, O. Svensk, and K. Liden.
2008b. Diet and status in Birka: Stable isotopes and
grave goods compared. Antiquity 82:446–461.
Longinelli, A., 1984. Oxygen isotopes in mammal bone
phosphate: A new tool for palaeohydrological and
palaeoclimatological research. Geochimica Et Cosmochimica
Acta 48:385–390.
Longinelli, A., and E. Selmo. 2003. Isotopic composition
of precipitation in Italy: A first overall map. Journal of
Hydrology 270:75–88.
Lykoudis, S.P., and A.A. Argiriou. 2007. Gridded data
set of the stable isotopic composition of precipitation
over the eastern and central Mediterranean. Journal of
Geophysical Research 112:1–10.
Mann, M.E., and P.D. Jones 2003. Global surface temperatures
over the past two millennia. Geophysical
Research Letters 30(15):1820–1823.
Mann, M.E., Z.H. Zhang, et al. 2008. Proxy-based reconstructions
of hemispheric and global surface
temperature variations over the past two millennia.
Proceedings of the National Academy of Sciences of
the United States of America 105(36):13252–13257
Moberg, A., D.M. Sonechkin, H. Kolmgren, N.M. Datsenko,
and W. Karlén. 2005. Highly variable Northern
Hemisphere temperatures reconstructed from lowand
high-resolution proxy data. Nature 433(7026):
613–617.
Montgomery, J., J.A. Evans, D. Powlesland, and C.A.
Roberts. 2005. Continuity or colonization in Anglo-
Saxon England? Isotope evidence for mobility, subsistence
practice, and status at West Heslerton. American
Journal of Physical Anthropology 126:123–138.
Montgomery, J., J.A. Evans, S.R. Chenery, V. Pashley,
and K. Killgrove. 2010. “Gleaming, white and
deadly”: The use of lead to track human exposure and
geographic origins in the Roman period in Britain.
Journal of the North Atlantic
C.A. Chenery, J.A. Evans, D. Score, A. Boyle, and S.R. Chenery
2014 Special Volume X
11
fication of geographical origins: The Valley of Oaxaca
versus the Valley of Mexico. Journal of Archaeological
Science 25:643–655.