2007 NORTHEASTERN NATURALIST 14(4):643–650
An Assessment of Impervious Surface Areas in
Rhode Island
Yuyu Zhou1 and Y.Q. Wang1,*
Abstract - Impervious surface area (ISA) has emerged as a key indicator to explain and
predict ecosystem health in relationship to watershed development. In this study, we extracted
the information of ISA for the state of Rhode Island using 1-m spatial resolution
true-color digital orthophotography data. We employed an object-oriented algorithm of
multiple-agent segmentation and classifi cation (MASC) that we developed for ISA information
extraction. The result indicates that, as of 2004, 10% of the state land has been
covered by ISA. The major population centers and historical cities, such as Providence,
Woonsocket, and Newport, have ISA over 30%. The heavily settled suburban communities
have ISA between 10 and 30%. Only 17 out of 39 towns in the state have less than
10% ISA. The average ISA for the coastal towns is 14%. Because most stream-quality
indicators are predicted to decline when watershed ISA exceeds 10%, the results from
this study serve as an alarming indicator for managing the state’s watershed and coastal
ecosystems. The tested MASC model could be extended to coastal Massachusetts and
Connecticut to provide a more comprehensive indication of the impacts of humaninduced
land-cover change on southern New England’s coast.
Introduction
Impervious surface area (ISA) has emerged as a key indicator to explain
and predict ecosystem health in relationship to watershed development. By
defi nition, urban pavements, such as rooftops, roads, sidewalks, parking lots,
driveways, and other manmade concrete surfaces, are among impervious surface
types. ISA has been considered a key environmental indicator due to its
impacts on aquatic systems and its role in transportation and concentration of
pollutants (Arnold and Gibbons 1996). Urban runoff, mostly over impervious
surface, is the leading source of pollution in US estuaries, lakes, and rivers
(Arnold and Gibbons 1996, Booth and Jackson 1997). A recently published watershed-
planning model predicts that most water-quality indicators for streams
decline when the watershed ISA exceeds 10% (Schueler 2003).
Bordered by Connecticut in the west and Massachusetts in the north,
Rhode Island is a heavily settled coastal state. Narragansett Bay extends into
the capital city of Providence and connects the developed coastal shoreline
with the open ocean. The landscape of Rhode Island is typical of a developed
southern New England state. As a result of urban development, Rhode Island
experiences problems caused by urban runoff. For example, on August 21,
2003, over one million fi sh as well as other marine organisms in Greenwich
Bay were killed due to low oxygen in the water (RIDEM 2003). ISA along
the coastal zone was considered as one of the possible factors that triggered
this incident.
1Department of Natural Resources Science, University of Rhode Island, 1 Greenhouse
Road, Kingston, RI 02881-0804. *Corresponding author - yqwang@uri.edu.
644 Northeastern Naturalist Vol. 14, No. 4
Assessment of the quantity of ISA in landscapes has become increasingly
important with growing concern of its impact on the environment (Civco et
al. 2002, Dougherty et al. 2004, Wang and Zhang 2004, Weng 2001). ISA for
the state of Rhode Island can be extracted from an existing dataset derived
from classifi cation of Landsat images at 30-m spatial resolution (Novak and
Wang 2004). However, there is lack of information at fi ner spatial resolution
for more precise measurements of ISA distribution in the state.
Using the most recent airborne digital orthophotos available at the
Statewide Planning Program, we employed a multiple-agent segmentation
and classifi cation (MASC) algorithm (Zhou and Wang, in press) to extract
high spatial resolution ISA for the state. The MASC algorithm includes submodels
of segmentation, shadow-effect, multivariate analysis of variance
(MANOVA)-based classifi cation, and post-classifi cation. Riparian zones are
important in hydrology, ecology, and environmental management because
of their relationship with soil conservation, biodiversity, and water quality.
With urban development, ISA along and near the riparian zones has been
increasing quickly. Also ISA along transportation lines has greater environmental
impacts than isolated ISA (Brabec et al. 2002). Therefore, we created
fi ve buffer zones along the major rivers and roads to summarize the spatial
distribution and patterns of ISA in the state.
Methods
Data preparation
The Rhode Island Statewide Planning Program acquired a set of true-color
digital orthophotographs between 2003 and 2004 through the National Agricultural
Imagery Program (NAIP). This ortho-rectifi ed imagery dataset with 1-m
ground sample distance has a horizontal accuracy of within ± 3 m of reference
digital ortho quarter quads (DOQQS) from the National Digital Ortho Program.
The ortho images are projected into Rhode Island State Plane Coordinate System
with zone 3800 in US survey feet. The resulting spatial resolution of the
dataset is 1 m (3.28 feet). The dataset has spectral bands of red, green, and blue
light and is distributed in GeoTIFF format (Fig. 1a). As texture information can
be helpful for spatial-information defi nition, we used a 3-x-3 pixel window to
extract the variance as one of the features in the image-segmentation process.
MASC algorithm for ISA extraction
The MASC algorithm includes submodels of segmentation, shadoweffect,
MANOVA-based classifi cation, and post-classifi cation (Zhou and
Wang, in press). Segmentation defi nes regions in an image corresponding
to objects in a ground scene. Successful image segmentation is the most
important prerequisite in object-oriented classifi cation (Baatz and Schäpe
2000). In the segmentation submodel, the added shape information enhanced
the performance of the multiple-pass segmentation algorithm that has been
used in object-oriented classifi cations (Woodcock and Harward 1992). It is
typical that tall objects such as buildings and trees cause shadowing effects
in high spatial resolution remotely sensed images. Therefore, the shadoweffect
submodel used a split-and-merge process to separate shadows and the
2007 Y. Zhou and Y.Q. Wang 645
objects that cause the shadows. In order to conduct an information-enhanced
image classifi cation, the MASC imbedded a MANOVA-based classifi cation
submodel to incorporate the relationship between spectral bands and the
variability in the training objects and the objects to be classifi ed. Different
types of ISAs were treated as corresponding objects. In the fi nal class map,
we focused only on two categories: ISA and non-ISA. For suburban areas,
dense tree canopies unavoidably cover some ISAs such as the road segments
in orthophotos, which makes direct extraction of ISA impossible. With a
GIS-supported post-classifi cation process, we employed the 1995 transportation
data from the Rhode Island Geographic Information System (RIGIS)
to recover missing segments of ISA caused by the shadows.
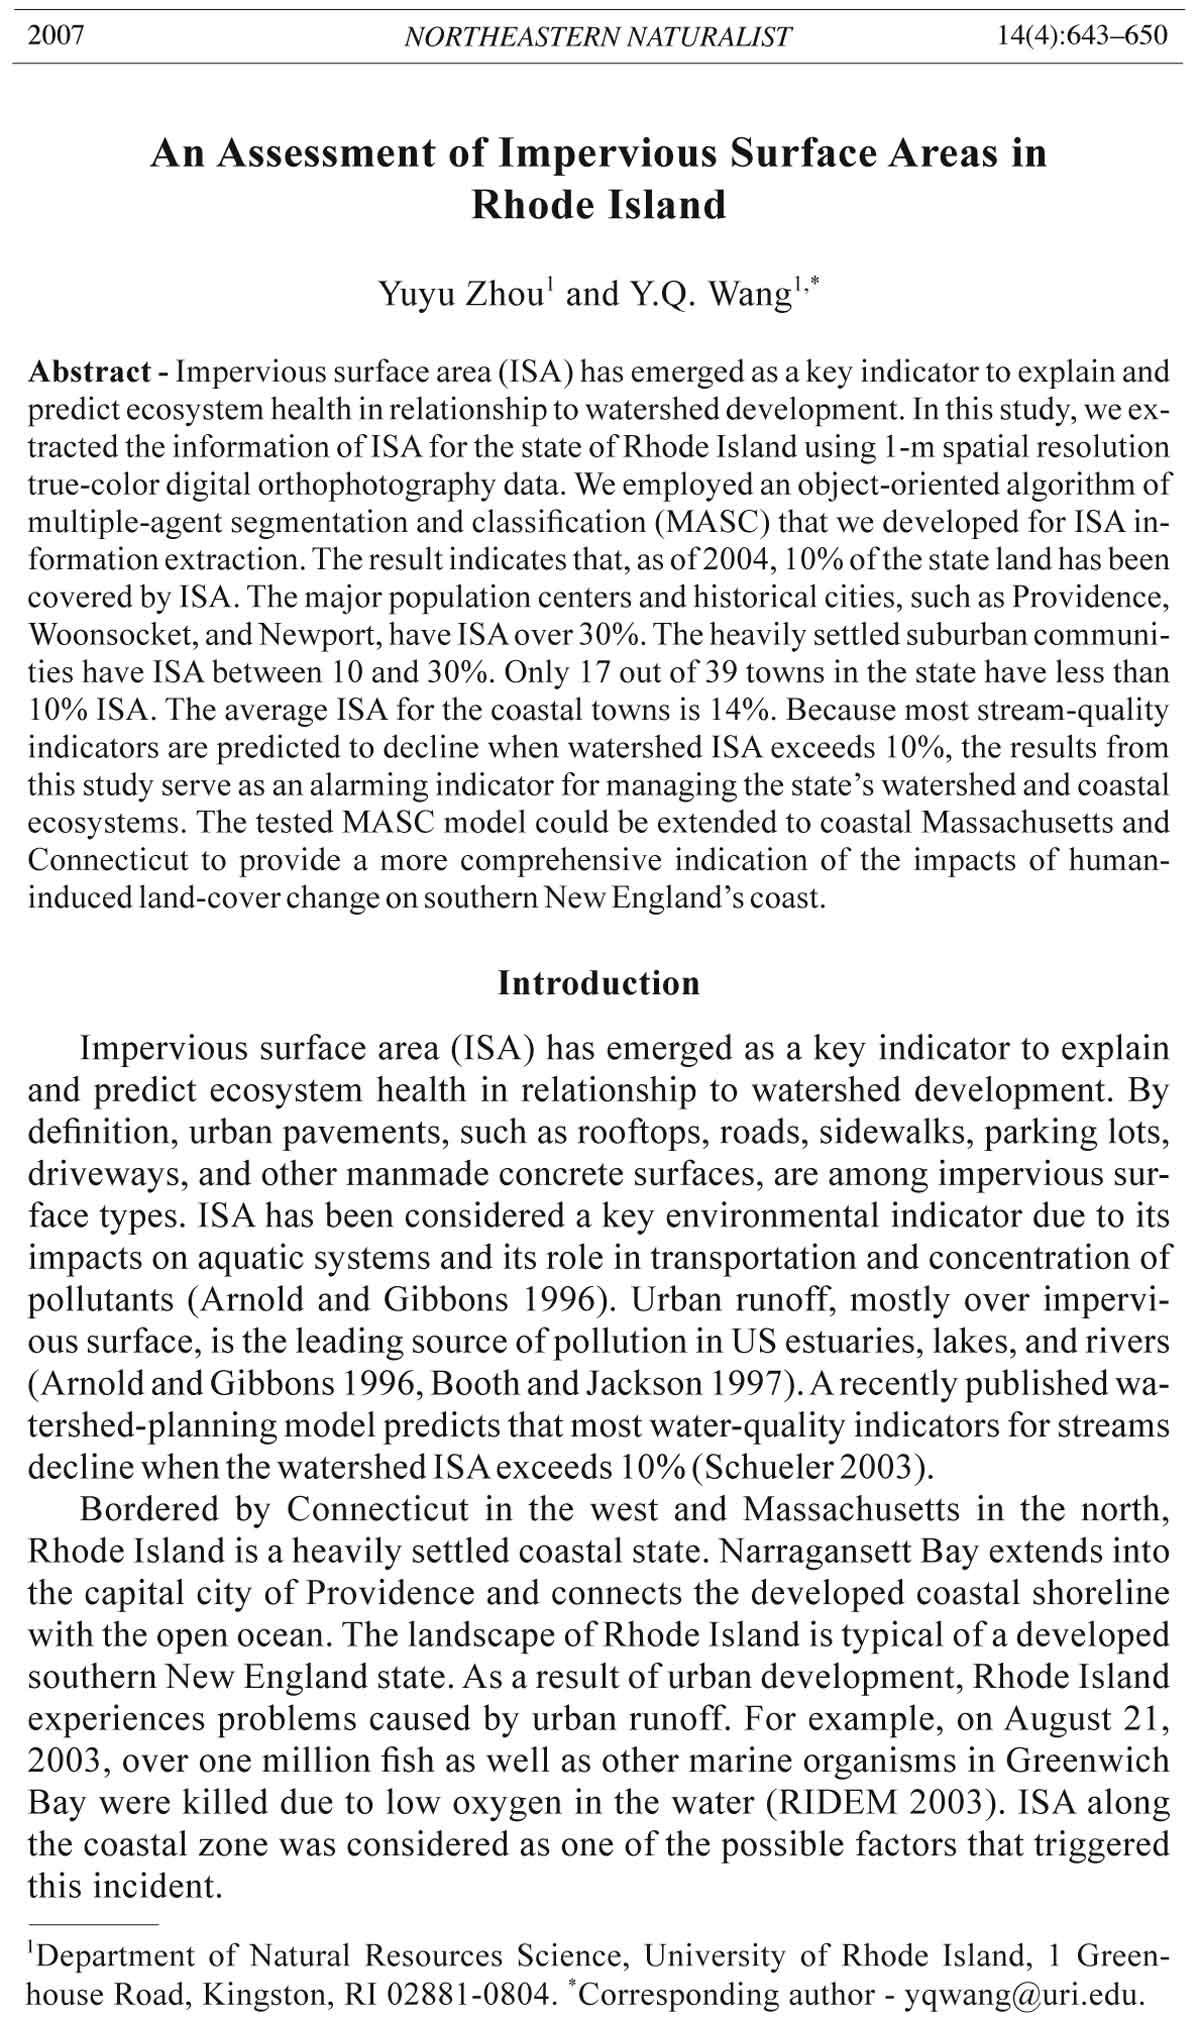
Figure 1. (a) The true-color digital orthophoto with 1-m spatial resolution for the
state of Rhode Island, (b) the spatial distributions of ISA, (c) the enlarged orthophoto
data for Westerly, and (d) the spatial distribution of ISA in Westerly.
646 Northeastern Naturalist Vol. 14, No. 4
It took 113 scenes of orthophotos to cover the entire state of Rhode Island
excluding Block Island (Fig. 1a). The 113-scene dataset covers 38 of the 39
towns of the state, with the exception being the township of New Shoreham
on the Block Island. In order to extract the ISA for the state effi ciently, we
developed a batch-process algorithm and applied it on the segmentation and
classifi cation process. First, the algorithm segmented these image scenes using
a set of the parameters. Second, we performed a pre-classifi cation stratifi cation
according to the 1995 land-cover and land-use data from the RIGIS and
selected the training objects of certain land-cover types for each subset from
the pre-classifi cation stratifi cation. The training samples included 5 main categories:
ISA, forest, grassland, bare soil, and water. Each category has several
subcategories. For example, black asphalt cover and concrete pavement with
different spectral features were treated as subcategories of ISA. We compared
and checked these training data according to the covariance matrix of each
object and used the samples with smaller covariance. Upon fi nishing classifi -
cation, we recoded the results of categories into ISA and non-ISA. Finally, we
applied the post-classifi cation submodel to integrate GIS data and the classifi -
cation result to obtain the high spatial resolution ISA cover for the state.
Pattern analysis
In order to evaluate the spatial unevenness of ISA distribution, we calculated
the ISA percentage in the coastal towns (i.e., the towns with coastal
shorelines) and inland towns separately using the ratio of ISA areas and total
areas of coastal towns and inland towns (Fig. 1a). To understand the spatial
patterns of ISA in riparian zones and on road sides, we built fi ve buffers of
Table 1. Percentage of ISA for inland and coastal towns in Rhode Island.
Inland Coastal
No. Name Area (ha) ISA (%) No. Name Area (ha) ISA (%)
1 Exeter 15,130 3 1 Little Compton 5854 6
2 Foster 13,466 3 2 Charlestown 9900 6
3 Glocester 14,726 4 3 South Kingstown 15,880 7
4 Scituate 14,201 4 4 Tiverton 7863 8
5 West Greenwich 13,271 5 5 Jamestown 2505 9
6 Hopkinton 11,437 5 6 East Greenwich 4226 11
7 Burrillville 14,760 5 7 Narragansett 3691 12
8 Richmond 10,556 6 8 Portsmouth 6115 13
9 Coventry 16,183 8 9 North Kingstown 11,444 14
10 North Smithfi eld 6448 9 10 Barrington 2227 14
11 Smithfi eld 7154 9 11 Westerly 7962 16
12 Cumberland 7319 13 12 Warren 1619 16
13 Johnston 6305 15 13 Middletown 3420 18
14 Lincoln 4915 16 14 Cranston 7492 19
15 West Warwick 2096 26 15 Bristol 2559 20
16 North Providence 1501 31 16 East Providence 3625 20
17 Central Falls 334 38 17 Warwick 9300 24
18 Woonsocket 2044 40 18 Pawtucket 2296 26
Average 7 19 Newport 2096 30
20 Providence 4873 37
Average 14
2007 Y. Zhou and Y.Q. Wang 647
Table 2. The error matrix of extracted ISA in Rhode Island.
Reference Classifi ed Number Producer’s User’s
totals totals correct accuracy (%) accuracy (%)
ISA 96 85 83 86.5 97.7
Non-ISA 104 115 102 98.1 88.7
Totals 200 200 185 92.5
Kappa value = 0.85.
Overall accuracy = 92.5%.
15, 60, 120, 300, and 600 m along the major rivers and roads, respectively,
for the coastal towns based on RIGIS data. We compared the percentage of
ISA within different buffer zones along major rivers for 17 out of the 20
coastal towns. The 3 excluded coastal towns have no major rivers.
Results
ISA in Rhode Island
The results indicate that among the 38 townships in Rhode Island that
the digital orthophoto covered, the 5 towns of Central Falls, Newport, North
Providence, Providence, and Woonsocket have ISA ≥30%. The 5 towns of
Bristol, East Providence, Pawtucket, Warwick, and West Warwick have ISA
between 20% and 29%. Twelve towns have ISA between 10% and 19%.
Even without orthophoto data, fi eld knowledge suggests that New Shoreham
on Block Island has less than 10% ISA cover. Therefore, only 17 towns in the
state have ISA less than 10% (Table 1). Overall, 10% of the land in Rhode
Island is covered by ISA (Fig. 1b). Enlarged examples of the orthophoto and
extracted ISA for the town of Westerly illustrate in detail the spatial distributions
of ISA (Figs. 1c and 1d).
We used a random-point sampling method to evaluate the classifi cation
accuracies. We selected 200 samples in Rhode Island and examined the classifi
cation accuracies for the ISA and non-ISA only. The overall accuracy for
the correctness of extracted ISA is 92.5%, and the Kappa coeffi cient is 0.85
(Table 2). We also examined the producer’s and user’s accuracy, which are
defi ned as the ratio of numbers of pixels correctly classifi ed for a certain category
and total numbers of ground-reference pixels for that category, and the
ratio of numbers of pixels correctly classifi ed for a certain category and total
numbers of pixels classifi ed at that category, respectively. The results show
that producer’s and user’s accuracies are, respectively, 86.5% and 97.7% for
the ISA, and 98.1% and 88.7% for the non-ISA categories.
Pattern of ISA distribution
The results show that ISA distributions are spatially uneven in the state.
ISA is more extensive along the coastal areas than that in the interior areas
(Fig. 1b). The areas of major population centers and historical cities, such as
Providence, Woonsocket, and Newport, have the highest percentage of ISA.
The heavily settled suburban communities have ISA between 10 to 30%.
Comparisons of the percentage of ISA in inland areas and coastal areas
along the eastern and southern coast zones (Fig. 1a) reveal the spatial
648 Northeastern Naturalist Vol. 14, No. 4
patterns of ISA cover in these areas. The average ISA for the coastal and
inland towns is 14% and 7%, respectively (Table 1).
Calculated ISA percentage increases with buffer areas from 15 m to
600 m along the major rivers (Fig. 2). The exception is the town of Westerly
(No. 11 in Fig. 2), where the ISA shows a decreasing trend with increased
buffer sizes. This is because Westerly has only a very limited area covered
by buffers along rivers. The decreasing trend should not refl ect the real pattern
of ISA cover within the entire township. The result illustrates that, in
general, areas closer to rivers are less covered by ISA and may indicate that
Figure 2. The variation of ISA percentage within 5 buffer zones in the coastal towns
along major rivers.
Figure 3. The variation of ISA percentage within 5 buffer zones in the coastal towns
along major roads.
2007 Y. Zhou and Y.Q. Wang 649
fl oodplains and other riparian environments have received some protection
from zoning and wetland regulations.
Unlike the patterns observed for the riparian zones, the percentage of ISA
along the major roads shows a decreasing trend with the increasing buffered
areas from 15 to 600 m (Fig. 3). This result indicates that most of the ISA is distributed
along the road networks. Furthermore, ISA percentage decreased to the
average level within the entire township as the buffer size increased to 600 m.
Discussion
Impervious surface area has been used as an indicator for environmental
impacts of urbanization by a variety of research and education programs in the
southern New England region. ISA impacts in watersheds can become very
costly in terms of water quality and quantity. The National Nonpoint Education
for Municipal Offi cials (NEMO) project and the Watershed Watching
programs in Rhode Island, among others, all rely on information of ISA and its
relationship to water systems to inform better community planning.
Previous studies in Rhode Island and Connecticut employed Landsat TM
and ETM satellite remote-sensing data at a 30-m spatial resolution to quantify
ISA. The results indicated an increasing trend in ISA cover in southern
New England coastal areas (Center for Land-use Education and Research
2003, Novak and Wang 2004). In Rhode Island, ISA increased 43% between
1972 and 1999, six times faster than population growth (Rhode Island Economic
Policy Council 2006). The increase of ISA consumed large areas of
forests, which are critical to the health of watersheds. The forests curb the
effects of soil erosion and fl oods, purify the air, and help moderate changes
in climate. The increase of ISA caused forest fragmentation as well. It is a
concern because larger forests often provide the greatest environmental benefi
t. While Rhode Island lost 18,000 acres of forest land from 1972 to 1999,
the remaining forests are being increasingly fragmented due to increase of
ISA (Rhode Island Economic Policy Council 2006).
Riparian zones are important in hydrology, ecology, and environmental
management. The results from buffer analysis indicate that ISA percentage
increases with increasing buffer sizes along the major rivers. Road networks
are major factors in contributions of urban runoff and associated pollutants.
As further evidence for the impacts of roads on adjacent ecosystems, the
results indicate that the percentages of ISA are the highest within the nearest
buffer along road networks.
Although middle spatial resolution ISA information in New England
states are available, ecosystem modeling and management decision making
require more precise information on ISA distribution. The research
described in this paper provided the precise spatial distribution and quantifi -
cation. This study developed a high spatial resolution ISA dataset for Rhode
Island, which is valuable for land management, planning, and for ecological
and hydrological modeling to determine the effects of urban development
on coastal environments and watersheds. Because true-color orthophoto data
are becoming more common among state agencies and are being widely used
650 Northeastern Naturalist Vol. 14, No. 4
by the general public, the modeling approach used in this study can be extended
to the coastal areas of Massachusetts and Connecticut and provide a
more comprehensive indication of the impacts of human-induced land-cover
change on the southern New England coast.
Acknowledgments
We thank guest editor, Stephen Trombulak and anonymous reviewers for their
suggestions and comments, which improved this manuscript. This research was funded
by the Rhode Island Agricultural Experimental Station (Project No. RI00H330).
Literature Cited
Arnold, C.A., Jr., and C.J. Gibbons. 1996. Impervious surface coverage: The emergence
of a key urban environmental indicator. Journal of the American Planning
Association 62:243–258.
Baatz, M., and A. Schäpe. 2000. Multiresolution segmentation: An optimization approach
for high-quality multi-scale image segmentation. Pp. 12–23, In J. Strobl
and T. Blaschke (Eds.). Angewandte Geographische Informationsverarbeitung
XII. Wichmann-Verlag, Heidelberg, Germany. 542 pp.
Brabec, E., S. Schulte, and P.L. Richards. 2002. Impervious surfaces and water quality:
A review of current literature and its implications for watershed planning.
Journal of Planning Literature 16:499–514.
Booth, D.B., and C.R. Jackson. 1997. Urbanization of aquatic systems: Degradation
thresholds, stormwater detection, and the limits of mitigation. Journal of American
Water Resources Association 35:1077–1090.
Center for Land-use Education and Research. 2003. Connecticut’s changing landscape.
Available online at http://clear.uconn.edu/projects/landscape/index.htm.
Accessed April 2007.
Civco, D.L., J.D. Hurd, E.H. Wilson, C.L. Arnold, and S. Prisloe. 2002. Quantifying
and describing urbanizing landscapes in the Northeast United States. Photogrammetric
Engineering and Remote Sensing 68:1083–1090.
Dougherty, M., L.D. Randel, J.G. Scott, A.J. Claire, and G. Normand. 2004.
Evaluation of impervious surface estimates in a rapidly urbanizing watershed.
Photogrammetric Engineering and Remote Sensing 70:1275–1284.
Novak, A., and Y. Wang. 2004. Effects of suburban sprawl on Rhode Island’s forest:
A Landsat view from 1972 to 1999. Northeastern Naturalist 11:67–74.
Rhode Island Department of Environmental Management (RIDEM). 2003. The Greenwich
Bay fi sh kill—August 2003: Causes, impacts and responses. RIDEM.
Rhode Island Economic Policy Council. 2006. Community development scorecard.
Available online at http://www.ripolicy.org/2010. Accessed April 2007.
Schueler, T. 2003. Impacts of impervious cover on aquatic systems. Center for Watershed
Protection (CWP), Ellicott City, MD. 142 pp.
Wang, Y., and X. Zhang. 2004. A SPLIT model for extraction of subpixel impervious
surface information. Photogrammetric Engineering and Remote Sensing
70:821–828.
Weng, Q.H. 2001. Modeling urban-growth effects on surface runoff with the integration
of remote sensing and GIS. Environmental Management 28:737–748.
Woodcock, C.E., and V.J. Harward. 1992. Nested-hierarchical scene models and image
segmentation. International Journal of Remote Sensing 13:3167–3187.
Zhou, Y., and Y. Wang. In press. Extraction of impervious surface areas from high
spatial resolution imageries by multiple-agent segmentation and classifi cation.
Photogrammetric Engineering and Remote Sensing.