2009 NORTHEASTERN NATURALIST 16(4):563–576
Communal Nesting and Reproduction of the Southern
Flying Squirrel in Montane Virginia
Richard J. Reynolds1,*, Michael L. Fies1, and John F. Pagels2
Abstract - We used nest boxes to study communal nesting and breeding habits
of Glaucomys volans (Southern Flying Squirrel) at high elevations over a wide
geographic range in western Virginia from 1985 to 1996. Of 320 occupied nest
boxes, 19.1% contained litters, 20.3% contained solitary adults, 45.9% had adult
aggregations, and 14.7% contained individuals or aggregations of unknown age.
Aggregation size ranged from 2–12 individuals. Group size appeared larger during
winter months, while the greatest number of aggregations peaked between June and
August; however, neither trend was significant. Females were significantly more
numerous than males in mixed-age aggregations, while males were significantly
more abundant than females in adult aggregations. The breeding season, from first
conception to last weaning, lasted 46–48 weeks, from the fourth week of January
through the second week of December. Two distinct parturition peaks were evident
in late March to mid-April and mid-August to mid-September. Our data support the
hypothesis that reproductive activity of Southern Flying Squirrels varies by latitude
and is primarily determined by photoperiod length, at least in temperate areas.
Introduction
Latitudinal, seasonal, and habitat effects on aggregative behavior, reproduction,
and nesting of Glaucomys volans L. (Southern Flying Squirrel)
have been studied in many parts of its range (Goertz et al. 1975, Layne and
Raymond 1994, Linzey and Linzey 1979, Muul 1974, Raymond and Layne
1988, Sonenshine et al. 1979, Stapp and Mautz 1991). Benefits of communal
nesting have been reported to include thermoregulation (Merritt et al. 2001),
social contact (Koprowski 1998), predator defense, increased success in
finding mates, and increased foraging success (Layne and Raymond 1994).
Potential disadvantages of communal nesting include increased transmission
of disease and parasites and higher levels of intraspecific aggression (Layne
and Raymond 1994). Heidt (1977) suggested that aggregations were smaller
in southern latitudes with warmer climates, an observation supported by others
(Gilmore and Gates 1985; Goertz et al. 1975; Muul 1969, 1974; Sawyer
and Rose 1985; Sonenshine et al. 1979). However, Layne and Raymond
(1994) reported aggregations as large as 25 individuals in Florida. Several
researchers have reported decreased use of nest boxes during warmer months
(Goertz et al. 1975, Layne and Raymond 1994, Sonenshine et al. 1979, Stone
et al. 1996). Most of these studies were conducted at low elevations or in
southern portions of the geographic range.
1Virginia Department of Game and Inland Fisheries, PO Box 996, Verona, VA 24482.
2Department of Biology, Virginia Commonwealth University, Richmond, VA 23284.
*Corresponding author - rick.reynolds@dgif.virginia.gov.
564 Northeastern Naturalist Vol. 16, No. 4
Raymond and Layne (1988) tested the hypothesis that breeding begins
and ends earlier in northern populations (spring to late summer) than in
southern populations (late summer to late winter), a hypothesis supported by
results from other studies (Hibbard 1935, Linzey and Linzey 1979, Sawyer
and Rose 1985). Goertz et al. (1975) suggested that litter size decreases with
decreasing latitude. Although some studies support this idea (Heidt 1977,
Jordon 1956), results from other studies do not (Linzey and Linzey 1979,
Raymond and Layne 1988, Stapp and Mautz 1991).
Published studies of the Southern Flying Squirrel are often limited in
temporal coverage or have small data sets, making comparisons among
studies difficult. Differences in study design, sampling periods, trapping
effort, and population densities also complicate efforts to compare research
results. As part of a 12-year study of two subspecies of the federally endangered
Glaucomys sabrinus (Shaw) (Northern Flying Squirrel), we also
had the opportunity to study the Southern Flying Squirrel in a broad area
of the southern Appalachian Mountains in western Virginia (Fig. 1). The
high-elevation sites we surveyed were generally characterized by biotic and
abiotic features typical of areas farther north than sites previously studied in
the southeastern United States. We present the results of 12 years of observations
on communal nesting and reproduction of the Southern Flying Squirrel
from boreal habitats near the latitudinal center of the species’ range, providing
further insight into the biology of this wide-ranging species.
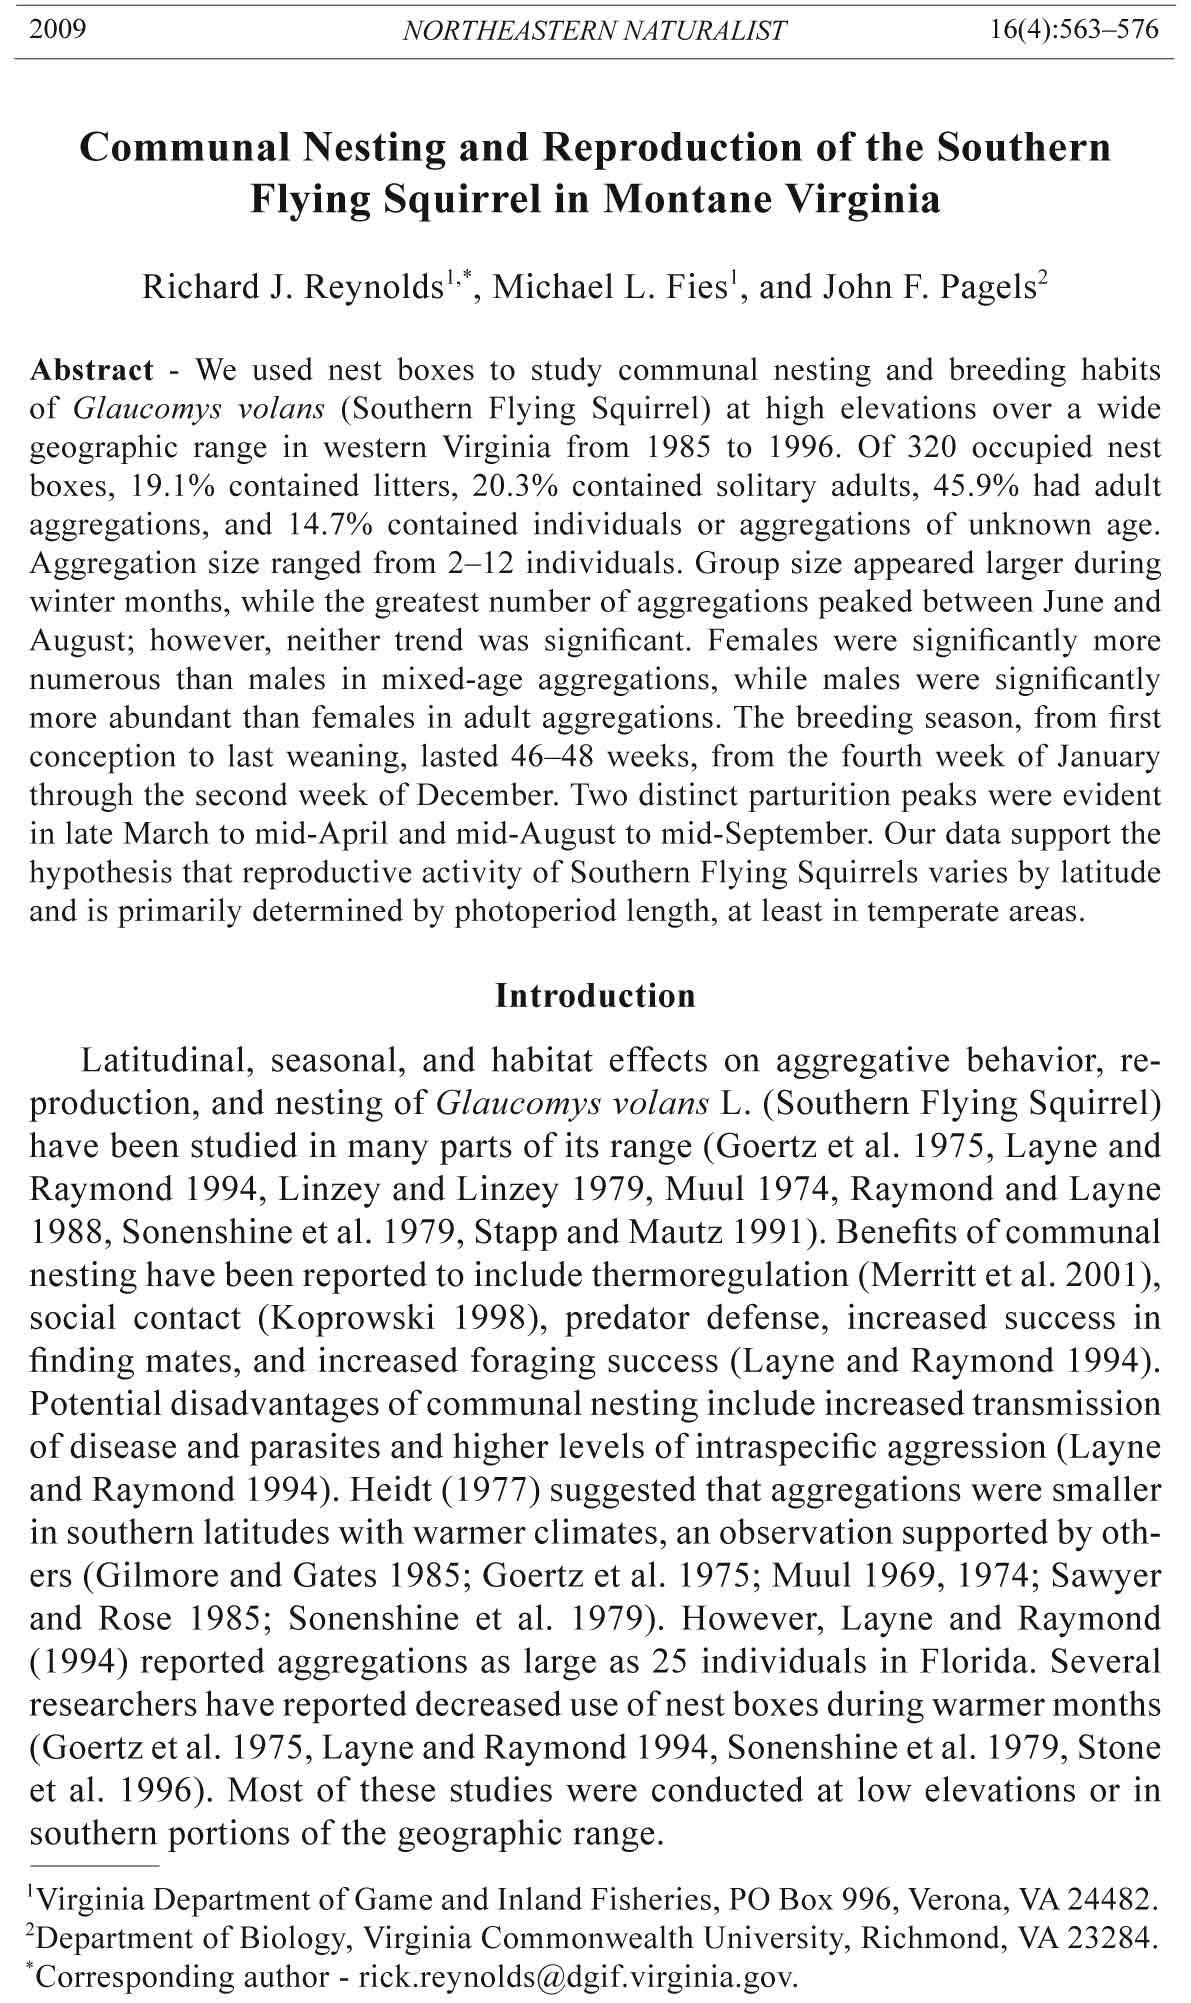
Figure 1. Locations of areas sampled for G. volans (Southern Flying Squirrel) in
Virginia. Each number can represent more than one sample site where sites were in
close proximity. Numbers correspond to sites in Appendix 1.
2009 R.J. Reynolds, M.L. Fies, and J.F. Pagels 565
Methods
We monitored each of 349 nest boxes multiple times, for a total of 7215
inspections at 26 sites in western Virginia from 1985 to 1996 (Pagels et al.
1990, Reynolds et al. 1999). Nest-box design and placement on trees are
described in Reynolds et al. (1999). We selected sites with features and
vegetation suggestive of Northern Flying Squirrel habitat, and most sites
were characterized by Picea rubens Sarg. (Red Spruce), Tsuga canadensis
(L.) Carr. (Eastern Hemlock), Red Spruce-Abies balsamea (Balsam Fir), or
northern hardwoods (Payne et al. 1989). Northern hardwood stands were
usually dominated by Quercus rubra L. (Northern Red Oak), Acer saccharum
Marsh (Sugar Maple), or Betula alleghaniensis Britt. (Yellow Birch).
Depending on habitat area, we installed 6–20 nest boxes approximately 50 m
apart at each site. Nest boxes were checked 3–4 times during the year at most
sites (Appendix 1).
Nest boxes were checked during daylight hours by closing the nest box
entrance and opening a hinged front door. If Glaucomys was present, the
age, mass, and reproductive condition were recorded. Squirrels were marked
with Monel ear tags (size 1, National Band and Tag Co., Newport, KY) and
released at the capture site.
We estimated conception and parturition dates using the criteria of Linzey
and Linzey (1979) and Stapp and Mautz (1991). Although both studies
report growth data to estimate age of juveniles, we used data from Stapp
and Mautz (1991) because breeding dates in New Hampshire more closely
resembled our breeding periods in western Virginia. Age was determined
by using the mass of the smallest young in the litter and applying this value
to the published growth curve of Stapp and Mautz (1991). Parturition dates
were estimated to the nearest week by backdating the age of each litter from
the capture date. Conception dates were estimated to the nearest week by
backdating 40 days for gestation (Sollberger 1943) from the estimated parturition
date.
We defined three age classes based on body mass for each of the two peak
breeding periods (winter–spring and summer–autumn) following the growth
curves of Stapp and Mautz (1991). Age classes defined for the winter–spring
breeding period included: nestlings (≤25.0 g), subadults (25.1–41.0 g), and
adults (>41.0 g). Age classes for the summer–fall breeding period were defined as: nestlings (≤32.0 g), subadults (32.1–52.0 g), and adults (>52.0 g).
Estimated age of squirrels in each size class was ≤4 weeks, 5–8 weeks, and
>8 weeks, respectively, for each breeding period (Stapp and Mautz 1991).
The upper mass values for nestlings and subadults approximated the mass
at weaning and at sexual maturity, respectively. We also categorized litters
as either young (an adult female with nestlings) or old (an adult female and
subadults assumed to be a family group), according to Raymond and Layne
(1988). We define aggregations as any group of squirrels (including litters)
greater than 1.
566 Northeastern Naturalist Vol. 16, No. 4
We used chi-square procedures to test for differences in sex ratios for
aggregations, litters, and total captures. We used the Mann-Whitney Rank
test to compare litter size by breeding period and age and to compare size
of mixed-age aggregations by sex and breeding period. The Kruskal Wallis
one-way ANOVA on ranks test was used to test aggregation size by season.
A significance level of α = 0.05 was used for all tests. Means are reported
± standard error. All statistical procedures were calculated using SPSS SigmaStat
for Windows v.3.00 (SPSS 2003).
Results
Captures
From May 1985 to May 1996, we found 1012 (465 males, 452 females,
95 unknown sex) Southern Flying Squirrels in nest boxes. This total included
770 adults (381 males, 383 females, 6 unknown sex), 128 subadults (69
males, 52 females, 7 unknown sex), and 39 nestlings (11 males, 11 females,
17 unknown sex); 75 (4 males, 6 females, 65 unknown sex) squirrels were
not aged or escaped prior to being aged. The overall sex ratio was 1.0 male
per female. The sex ratio of recaptured squirrels was 0.8 male:female, but
this ratio was not significantly different from 1:1 (χ2 = 2.0, df = 1, P = 0.16).
Flying squirrels occupied 320 of 7215 nest boxes checked (Table 1) for an
occupancy rate of 4.4%. The percentage of occupied boxes varied widely
among sites, ranging from 0–23.3%.
Solitary adults were found in 65 (20.3%) of the 320 occupied boxes. The
number of boxes containing single adults was lowest during February and
highest between June (mean = 2.2 per 100 boxes) and September (mean = 2.1
per 100 boxes). Solitary males per 100 boxes were fewest in January, February,
and April (0.0) and highest in June (1.8), whereas the number of solitary
Table 1. Seasonal variation in nest-box use for Glaucomys volans (Southern Flying Squirrel)
in western Virginia.
Total # % unoccupied % occupied
Season checked boxes boxes % Solitary % Aggregations
Winter 1488 96.2 3.8 1.1 2.8
Spring 3624 96.4 3.6 0.8 2.8
Summer 459 88.9 11.1 2.0 9.2
Autumn 1644 95.0 5.0 1.6 3.5
Totals 7215 95.6 4.4 1.1 3.3
Table 2. Monthly variation in the number of solitary adult males, adult females, and total
adult individuals per 100 nest boxes checked for Glaucomys volans (Southern Flying Squirrel)
in western Virginia.
Jan. Feb. Mar. Apr. May June July Aug. Sep. Oct. Nov. Dec.
Males 0.0 0.0 0.3 0.0 0.5 1.8 0.8 0.9 0.4 0.4 0.4 0.7
Females 0.8 0.0 0.4 0.5 0.3 0.4 0.8 0.9 1.7 0.6 0.0 0.2
Total 0.8 0.0 0.7 0.5 0.8 2.2 1.6 1.8 2.1 1.0 0.4 0.9
2009 R.J. Reynolds, M.L. Fies, and J.F. Pagels 567
females per 100 boxes was lowest in November, December, and February
(0.0–0.02) and highest in September (1.7) (Table 2).
Aggregations
Aggregations were observed in 240 of 320 (75.0%) occupied boxes. This
total included 147 adult, 61 mixed-age (11 nestlings, 50 sub-adult), and 32
unknown-age aggregations (Table 3). Aggregation size ranged from 2–12
individuals, with a mean of 3.7 ± 0.1 SE for adult aggregations and 3.9 ± 0.2
SE for mixed-age aggregations. Mean aggregation size did not differ signifi-
cantly (Kruskal-Wallis one-way ANOVA on ranks: H = 7.1, df = 3, P = 0.07)
among winter (4.8 ± 0.4 SE), spring (3.7 ± 0.2 SE), summer (3.6 ± 0.3 SE),
and autumn (3.6 ± 0.2 SE) (Table 4). The number of aggregations per 100
boxes appeared greater in summer (mean = 9.2), but were not significantly
different (χ2 = 6.3, df = 3, P = 0.10) than autumn (mean = 3.5), winter (mean
= 2.8) or spring (mean = 2.8) (Table 1).
Mean aggregation size for adults ranged from 2.9 ± 0.3 SE in September
to 4.5 ± 0.5 SE in April. Despite the mean number of adult aggregations
in summer (mean = 7.0; Fig. 2) being more than three times greater
Table 3. Seasonal variation in nest-box use by unknown age, mixed age, and adult male, female, and
mixed-sex aggregations of Glaucomys volans (Southern Flying Squirrel) in western Virginia.
Adult aggregations
Total % unknown % mixed % Mixed
Season aggregations age age % Male % Female Sex
Winter 41 21.9 9.8 7.3 9.8 51.2
Spring 100A 12.0 39.0 12.0 6.0 29.0
Summer 42 16.7 7.1 19.1 9.5 47.6
Autumn 57 7.0 26.3 14.0 10.5 42.1
Totals 240 13.3 25.4 12.9 8.3 39.2
AIncludes 2 adult aggregations of unknown sex.
Figure 2. Monthly variation in the number of mixed age, adult, unknown age, and
total number of aggregations per 100 nest boxes checked for Glaucomys volans
(Southern Flying Squirrel) in western Virginia.
568 Northeastern Naturalist Vol. 16, No. 4
than that of other seasons—autumn (mean = 2.3), winter (mean = 1.9),
or spring (mean = 1.3)—aggregation size did not differ among seasons
(χ2 = 6.6, df = 3, P = 0.09). Among adult aggregations, 63.9% included
both sexes, 21.1% had only males, and 13.6% had only females. We found
single-sex aggregations for both males and females throughout most of the
year. Aggregations of adult males (mean = 3.1 ± 0.2 SE, n = 31) were similar
in size to those of adult females (mean = 2.6 ± 0.2 SE, n = 21) (t = 419.5,
P = 0.07).
The number of mixed-age aggregations paralleled the parturition peaks
in winter–spring and summer–autumn (Fig. 2). The mean number of squirrels
in mixed-age groups for the late (mean = 4.2 ± 0.3 SE) parturition period
did not differ from that of winter–spring (mean = 3.8 ± 0.2 SE) (t = 537.5,
P = 0.14). Most mixed-age groups were comprised of a single adult female
with young (nestlings or sub-adults). Multiple adults with young were observed
on three occasions, including one box with seven adults (4 males, 3
females) and 3 sub-adults (2 males, 1 female).
The sex ratio for all aggregations was 1.0 male:female. Females were
significantly more numerous than males (0.7 male:female) in mixed-age aggregations
(χ2 = 8.4, df = 1, P = 0.004) and males were significantly more
abundant than females (1.2 male:female) in adult aggregations (χ2 = 4.0,
df = 1, P = 0.05) (Table 4).
Breeding Season
We observed two distinct periods of parturition, from the first week of
March through the first week of May, and from the last week of July through
October. Parturition peaks were evident in late March to mid-April and mid-
August to mid-September (Fig. 3). Adding 40 days for gestation and 6–8
weeks for weaning (Sollberger 1943), the breeding season (conception
through weaning) for Southern Flying Squirrels in western Virginia was
46–48 weeks, extending from the fourth week in January through early to
mid-December.
Litters
Litters were present in 61 of the 320 (19.1%) occupied boxes. This total
included 50 (81.9%) subadult and 11 (19.1%) neonate litters. Mean litter size
was 2.7 ± 0.1 and ranged from 1–5 young. Mean size of neonate litters (mean
Table 4. Seasonal variation in aggregation size and sex ratios of aggregations of Glaucomys
volans (Southern Flying Squirrel) in western Virginia.
Aggregation size Sex ratio in aggregations (males/female)
Season n Mean SE All Mixed age Adult Unknown age
Winter 41 4.8 0.4 89:92 7:9 62:63 20:20
Spring 100 3.7 0.2 165:166 50:77 103:78 12:11
Summer 42 3.6 0.3 78:59 2:6 67:46 9:7
Autumn 57 3.6 0.2 99:101 25:35 66:63 8:3
Total 240 3.9 0.1 431:418 84:127 298:250 49:41
2009 R.J. Reynolds, M.L. Fies, and J.F. Pagels 569
= 3.3 ± 0.3 SE, n = 12) and subadult litters (mean = 2.6 ± 0.1 SE, n = 49) were
not significantly different (t = 475.0, P = 0.06). Winter–spring litters (mean
= 2.5 ± 0.1 SE, n = 41) appeared smaller, but were not significantly different
(t = 744.0, P = 0.06) than summer–autumn litters (mean = 3.2 ± 0.1 SE, n =
20). After adjusting for number of litters/100 adult females, the number of
females with litters in winter–spring (20.5) was not significantly different
than in summer–autumn (11.0) (χ2 = 2.8, df = 1, P = 0.09).
Of 167 young squirrels in litters, 80 (47.9%) were males, 63 (37.7%)
were females, and 24 (14.4%) were of undetermined sex. The sex ratio
of young in all litters, 1.3 male:female in both breeding seasons, was not
significantly different from 1:1 (χ2 = 2.0, df = 1, P = 0.16). Sex ratios of
neonate (1.0 male:female) and subadult (1.3 males:female) litters were not
significantly different from 1:1 (χ2 = 0.0, df = 1, P > 0.99; χ2 = 2.2, df = 1,
P = 0.14), respectively.
Discussion
Captures
Our overall nest-box occupancy rate (percentage of boxes occupied) of
4.4% was lower than that reported by other authors. Layne and Raymond
(1994) reported a 24% occupancy rate over a five-year study in Florida, and
Goertz et al. (1975) reported a 22% occupancy rate over a one-year study in
Louisiana. While the Layne and Raymond multi-year study may account for
Figure 3. Estimated parturition dates by week of Glaucomys volans (Southern Flying
Squirrel) litters in nest boxes in western Virginia.
570 Northeastern Naturalist Vol. 16, No. 4
annual variation, both their study and Goertz et al. were limited to a single
site. The range of occupancy rates we observed (0–23.2%) demonstrates the
variability among sites that may be a reflection of population density, availability
of natural cavities, annual variation, or sampling effort including
frequency and time of year.
Capture rates (number of squirrels per 100 boxes checked) can represent
a standardized index of relative number of squirrels in an area. In our study,
we observed 14.0 squirrels/100 boxes compared to 73.8 in Florida (Layne
and Raymond 1994), 8.4 in Louisiana (Gilmore and Gates 1985), and 1.3
in New Hampshire (Fridell and Litvaitis 1991). However, comparing these
rates is complicated by the duration and area of study as well as environmental
factors (e.g., availability of cavities, habitat type). For example, our study
covered a 12-year period, compared to 5 years for Layne and Raymond
(1994), 1 year for Gilmore and Gates (1985), and 1 month for Fridell and
Litvaitis (1991).
Sollberger (1943) suggested that the average life span for the Southern
Flying Squirrel is approximately five years. Schwartz and Schwartz (1981)
noted that Southern Flying Squirrels are known to have lived 10 years in
captivity. In our study, an adult male was captured in December, 1986 and
later recaptured in October, 1991. Applying the growth curves of Stapp and
Mautz (1991), we calculated this animal to be a minimum of 9 weeks of age
when first captured and a minimum of 4 years and 11 months of age when
last captured.
Sex ratios
While previous studies have reported a male-biased sex ratio in nest
boxes (Gilmore and Gates 1985, Heidt 1977, Layne and Raymond 1994,
Sawyer and Rose 1985), we observed an overall parity in the sex ratio for
all captures in our study. Layne and Raymond (1994) suggested that sex
ratios may at least partly reflect the actual sex ratio of the population as they
observed a male-biased sex ratio in both nestlings and adults. However, they
also note that seasonal changes in sex ratios of aggregations could complicate
estimation of an overall sex ratio. While our observed sex ratio of 1.3
male:female of young in litters appeared to be male-biased, it was not statistically
significant. Our observed parity in sex ratios with young in litters and
adult aggregations support the concept that sex ratios observed in nest boxes
reflects the actual population ratio; however, we believe many factors affect
sex ratios, including predation, seasonal distribution of sampling, and home
ranges.
Aggregations
Although not statistically significant, we observed almost three times as
many aggregations per 100 boxes during the summer months compared to
other seasons, the opposite trend to that reported by other authors. Gilmore
and Gates (1985), Goertz et al. (1975), Heidt (1977), Layne and Raymond
(1994), Sonenshine et al. (1979), and Stone et al. (1996) report the total
2009 R.J. Reynolds, M.L. Fies, and J.F. Pagels 571
number of aggregations to peak during the coldest months of the year and
to decline through the spring and summer. However, climatic differences
may explain the year-round use of nest boxes in our study. All but one of
our study sites was located above 900 m in elevation, and most sites were
situated in riparian areas (Appendix 1). These high mountain sites typically
have their own microclimate characterized by cooler temperatures, higher
rainfalls, and a shorter growing season. All but one of the sites (Gilmore and
Gates 1985) reporting decreased summer use were located at lower elevations
in southern latitudes. Several factors, including availability of natural
cavities and population density, presumably affect nest-box use.
Layne and Raymond (1994) summarized published aggregation sizes
for Southern Flying Squirrels (Table 5), showing larger aggregations in the
north than in the south. However, their multi-year study reported the highest
means for both the cool (mean = 8.2) and the warm season (mean = 4.5) as
well as the maximum number (25) in a box. They suggested that the north–
south trend was based on few data points and small samples and that local
factors other than major climatic conditions could influence communal nesting
behavior and thus complicate the evaluation of latitudinal effects. For
example, Muul (1969) noted that aggregation sizes in Michigan were largely
dependent on local population density. Availability of cavities might also affect
aggregative behavior. Although we did not measure population density,
our observations from a large data set compiled over 12 years support the
hypothesis of a north–south cline in aggregative behavior.
Breeding season
Our high-elevation (mean = 1205 m) populations showed two distinct parturition
peaks in late March to mid-April and mid-August to mid-September,
with an overall breeding season extending from late January through early to
mid-December. Muul (1969) noted that photoperiod was the primary factor
Table 5. Means and maximum numbers of Glaucomys volans (Southern Flying Squirrel) in nest
boxes or natural nests at different latitudes during cool and warm seasons. Table modified from
Layne and Raymond (1994).
Latitude Cool season Warm season
Locality (oN) Months Mean Months Mean Max. Reference
MI-MA 42 Nov.–Mar. 5.7A Apr.–Oct. 1.3 19 Muul 1968
MD 39 Nov.–Mar. 5.0 Apr.–Oct. 2.6 17 Muul 1974
MD 39 Nov. 3.2B 10 Gilmore and Gates 1985
VA 38 Jan. 3.5B 13 Sonenshine et al. 1979
VA 37 Oct.–Mar. 11 Sawyer and Rose 1985
VA 36–38 Nov.–Mar. 4.2 Apr.–Oct. 3.6 12 Present study
AR 35 Sept.–May 3.9 Jun.–Aug. 0.0 12 Heidt 1977
LA 32 Nov.–Apr. 3.2 May–Oct. 2.1 10 Goertz et al. 1975
fl30 Nov.–Mar. 2.3C Apr.–Oct. 1.0 3 Muul 1974
fl27 Nov.–Mar. 8.2 Apr.–Oct. 4.5 25 Layne and Raymond 1994
AData from nest boxes and natural nest sites.
BMaximum monthly mean.
CData from natural nest sites.
572 Northeastern Naturalist Vol. 16, No. 4
influencing the timing of spring reproduction in Southern Flying Squirrels
because that part of the year is a time of low food resources. In northern
latitudes (Michigan), Muul (1969) believed ovulation to be triggered as the
photoperiod increases from 11 to 15 hours, and also until it decreases to 14
hours, but no later. The influence of photoperiod regulating seasonal breeding
has been demonstrated in other rodents (Dark et al. 1983, Lynch et al.
1981). Lynch et al. (1981) believe that photoperiod is used by more northerly
populations of Peromyscus leucopus Rafinesque (White-footed Mouse)
to predict the onset of winter and regulate seasonal breeding. They further
suggest that populations from southern states with more severe winters,
such as in the mountainous areas of western VA, should make greater use of
photoperiod to cue seasonal breeding than conspecific populations at lower
altitudes. The two breeding peaks and overall breeding season we observed
are similar to those reported for piedmont Virginia (Sonenshine et al. 1979)
and in other states at latitudes close to Virginia (Gilmore and Gates 1985,
Pitts 1992). Sonenshine et al. (1979) reported two peak periods of estrous/
pregnant females in Hanover and Caroline counties, VA: one in late winter–
early spring (February–March) and a second in later summer–early autumn
(July–September). These populations occur at low elevations (mean = 61 m)
in the piedmont physiographic province, where low temperatures average
-2.2 ºC and snowfall averages 42.9 cm compared to average low temperatures
of -7.4 ºC and average snowfall of 99.1 cm in the mountains. However,
the piedmont sites and mountain sites have similar photoperiod lengths. The
similarity in breeding seasons for populations from areas having different
altitudes and climatic conditions but similar photoperiod lengths supports
Muul’s (1969) hypothesis that photoperiod is the primary factor determining
the timing of reproductive activity in the Southern Flying Squirrel, at least
in temperate areas.
The two breeding peaks we observed support the hypothesis of a latitudinal
shift in breeding seasons from spring and autumn in northern latitudes
to late summer through winter for southern latitudes. Raymond and Layne
(1988) compiled parturition periods from studies at different latitudes in a
figure that demonstrates the shift in breeding periods for the Southern Flying
Squirrel. Our data fit the figure Raymond and Layne compiled and support
the hypothesis of a latitudinal shift in breeding seasons.
Sonenshine et al. (1979) noted that reproduction could occur in female
flying squirrels during their first year. They reported that most females
(94.2%) became pregnant within 6–8 months after birth. Stapp and Mautz
(1991) observed a similar trend in New Hampshire, where young females
bred for the first time at approximately 10–11 months. Over our 12-year
study period, we found no evidence that spring-born females bred during the
autumn or that autumn-born females bred the following spring.
Litter size
Our observation of larger summer–autumn litters than winter–spring
litters has been reported in other studies (Goertz et al. 1975, Hibbard 1935,
2009 R.J. Reynolds, M.L. Fies, and J.F. Pagels 573
Linzey and Linzey 1979, Raymond and Layne 1988, Sollberger 1943, Stapp
and Mautz 1991, Uhlig 1956). Raymond and Layne (1988) suggested that
the size difference between young (neonate) and old (sub-adult) litters, the
latter being smaller, might be one reason for the difference between the size
of summer–autumn and winter–spring litters. They found a larger percentage
(63%) of older litters (six or more weeks of age) during winter–spring
compared to 11% in the summer–autumn breeding season. Raymond and
Layne also observed that the seasonal trend in litter size was still evident
when young and old litters were considered separately, suggesting that other
factors also affect litter size. We also observed a difference between mean
young (3.3 ± 0.3 SE) and old litters (2.6 ± 0.1 SE) similar to Raymond and
Layne (1988; 3.5 and 2.8, respectively) and a larger percentage of older litters
in summer–fall (85.0%) compared to winter–spring (68.3%). We also
did not find a significant difference (t = 437.0, P = 0.29) in mean litter size
for litters greater than six weeks of age between the winter–spring (mean =
2.6 ± 0.2 SE) and summer–autumn (mean = 3.0 ± 0.2 SE) breeding seasons.
Even without the influence of older litters, our mean sizes for summer–
autumn (3.2 ± 0.2 SE) and winter–spring (2.5 ± 0.1 SE) litters correspond
to those observed by Raymond and Layne (1988; 3.3 and 2.3, respectively).
These data suggest that other factors (availability of food, weather, seasonal
health, or age at breeding), in addition to the percentage of older litters in a
sample, influence observed litter size and add to the difficulty in comparing
litter sizes among seasons, years, and studies. Although many factors can influence litter size, a common pattern across the range of the Southern Flying
Squirrel is for larger litters in the summer–autumn than in winter–spring.
Conclusion
Our data from high-elevation sites in the latitudinal center of the species’
range adds to our understanding of the ecology of this wide-ranging flying
squirrel. While not statistically different, we found the greatest number of
aggregations to peak in the summer months, compared to winter as reported
by other authors. Our data support the hypothesis of a north–south cline in
aggregative behavior. The two distinct parturition peaks and overall breeding
season are similar to those reported in other states at latitudes close to
Virginia and support the hypothesis of a latitudinal shift in breeding seasons.
The seasonal trend of larger litters in summer–autumn than in winter–spring
is similar to that reported by other authors.
Acknowledgments
We thank S.Y. Erdle, J.E. Pagels, S.C. Rinehart, and K.L. Uthus of Virginia Commonwealth
University; J.R. Baker, W.H. Bassinger, O. Burkholder, J.D. Haulsee, D.
Lovelace, and R. Swartz of the Virginia Department of Game and Inland Fisheries;
and T.H. Blevins, R. Glasgow, J.L. Overcash, and C. Thomas of the US Forest Service
for assisting with data collection. The Anderson, Brody, and McBride families
graciously provided us access to their properties in Highland County. Funding was
provided by the Pittman-Robertson Federal Aid to Wildlife Restoration Project574
Northeastern Naturalist Vol. 16, No. 4
WE99R and the Virginia Department of Game and Inland Fisheries Nongame Program.
In addition, we thank the managers of the George Washington and Jefferson
National Forests for their cooperative efforts in supporting this project.
Literature Cited
Dark, J., P.G. Johnston, M. Healy, and I. Zucker. 1983. Latitude of origin influences
photoperiodic control of reproduction of Deer Mice (Peromyscus maniculatus).
Biology of Reproduction 28:213–220.
Fridell, R.A., and J.A. Litvaitis. 1991. Influence of resource distribution and abundance
on home-range characteristics of Southern Flying Squirrels. Canadian
Journal of Zoology 69:2589–2593.
Gilmore, R.M., and J.E. Gates. 1985. Habitat use by the Southern Flying Squirrel
at a hemlock-northern hardwood ecotone. Journal of Wildlife Management
49:703–710.
Goertz, J.W., R.M. Dawson, and E.E. Mowbray. 1975. Response to nest boxes and
reproduction by Glaucomys volans in northern Louisiana. Journal of Mammalogy
56:933–939.
Heidt, G.A. 1977. Utilization of nest boxes by the Southern Flying Squirrel Glaucomys
volans in central Arkansas. Proceedings of the Arkansas Academy of Sciences
31:55–57.
Hibbard, C.W. 1935. Breeding seasons of Gray and flying squirrels. Journal of Mammalogy
16:325–326.
Jordon, J.S. 1956. Notes on a population of Eastern Flying Squirrels. Journal of
Mammalogy 37:294–295.
Koprowski, J.L. 1998. Conflict between the sexes: A review of social and mating
systems of three tree squirrels. Pp. 33–41, In M.A. Steele, J.F. Merrit, and D.A.
Zegers (Eds.). 1998. Ecology and Evolutionary Biology of Tree Squirrels. Virginia
Museum of Natural History, Martinsville, VA. Special Publication 6.
Layne, J.N., and M.A.V. Raymond. 1994. Communal nesting of Southern Flying
Squirrels in Florida. Journal of Mammalogy 75:110–120.
Linzey, D.W., and A.V. Linzey. 1979. Growth and development of the Southern Flying
Squirrel (Glaucomys volans volans). Journal of Mammalogy 60:615–620.
Lynch, G.R., H.W. Heath, and C.M. Johnston. 1981. Effect of geographical origin on
the photoperiodic control of reproduction in the White-footed Mouse, Peromyscus
leucopus Biology of Reproduction 25:475–480.
Merritt, J.F., D.A. Zegers, and L.R. Rose. 2001. Seasonal thermogenesis of Southern
Flying Squirrels (Glaucomys volans). Journal of Mammalogy 82:51–64.
Muul, I. 1968. Behavioral and physiological influences on the distribution of the
flying squirrel Glaucomys volans. Miscellaneous Publications of the Museum of
Zoology, University of Michigan 134:1–66.
Muul, I. 1969. Photoperiod and reproduction in flying squirrels, Glaucomys volans.
Journal of Mammalogy 50:542–549.
Muul, I. 1974. Geographic variation in the nesting habits of Glaucomys volans. Journal
of Mammalogy 55:840.
Pagels, J.F., R.P. Eckerlin, J.R. Baker, and M.L. Fies. 1990. New records of the distribution
and the intestinal parasites of the endangered Northern Flying Squirrel
Glaucomys sabrinus (Mammalia: Sciuridae). Brimleyana 16:73–78.
Payne, J.L., D.R. Young, and J.F. Pagels. 1989. Habitat variation among montane
island populations of the flying squirrel, Glaucomys sabrinus, in the southern
Appalachians, USA. American Midland Naturalist 121:285–292.
2009 R.J. Reynolds, M.L. Fies, and J.F. Pagels 575
Pitts, T.D. 1992. Reproduction of Southern Flying Squirrels (Glaucomys volans)
in Weakley County, Tennessee. Journal of the Tennessee Academy of Science
67:81–83.
Raymond, M.A.V., and J.N. Layne. 1988. Aspects of reproduction in the Southern
Flying Squirrel in Florida. Acta Theriologica 33:505–518.
Reynolds, R.J., J.F. Pagels, and M.L. Fies. 1999. Demography of Northern Flying
Squirrels in Virginia. Proceedings of the Annual Conference of the Southeastern
Association of Fish and Wildlife Agencies 53:340–349.
Sawyer, S.L., and R.K. Rose. 1985. Homing in and ecology of the Southern Flying
Squirrel Glaucomys volans in southeastern Virginia. American Midland Naturalist
113:238–244.
Schwartz, W.W., and E.R. Schwartz. 1981. The Wild Mammals of Missouri. University
Missouri Press and Missouri Department of Conservation, Columbia, MO.
356 pp.
Sollberger, D.E. 1943. Notes on the breeding habits of the Eastern Flying Squirrel
(Glaucomys volans volans). Journal of Mammalogy 24:163–173.
Sonenshine, D.E., D.M. Lauer, T.C. Walker, and B.L. Elisberg. 1979. The ecology of
Glaucomys volans (Linnaeus, 1758) in Virginia. Acta Theriologica 24:363–377.
SPSS, Inc., 2003. SPSS SigmaStat User’s Guide. Version 3.0 ed. SPSS Inc. Headquarters.
Chicago, IL. 851 pp.
Stapp, P., and W.W. Mautz. 1991. Breeding habits and postnatal growth of the Southern
Flying Squirrel (Glaucomys volans) in New Hampshire. American Midland
Naturalist 126:203–208.
Stone, K.D., G.A. Heidt, W.H. Baltosser, and P.T. Caster. 1996. Factors affecting
nest-box use by Southern Flying Squirrels (Glaucomys volans) and Gray Squirrels
(Sciurus carolinensis). American Midland Naturalist 135:9.
Uhlig, H.G. 1956. Reproduction in the Eastern Flying Squirrel in West Virginia.
Journal of Mammalogy 37:295.
576 Northeastern Naturalist Vol. 16, No. 4
Appendix 1. Site reference, elevation, latitude, survey months, number of boxes checked, number of captures, and major habitat type for each
Glaucomys volans (Southern Flying Squirrel) sample site in western Virginia.
SiteA Elevation (m) Latitude Survey months # boxes checked # captured Habitat
2 1067 38o37' Jan, Apr, May, Oct, Nov, Dec 192 21 Spruce-birch
4 1128 38o35' Jan, Mar, Apr, May, Jun, Oct, Dec 176 15 Spruce-birch
4 1128 38o35' Jan, Mar, Apr, May, Jun, Aug, Oct, Nov, Dec 505 58 Spruce-birch
4 1128 38o34' Jan, Mar, Apr, May, Jun, Aug, Sep, Oct, Nov, Dec 500 143 Spruce-birch
1 975 38o34' Jan, Mar, Apr, May, Jun, Oct, Nov, Dec 266 3 Hemlock
4 1097 38o32' Jan, Mar, Apr, May, Jun, Aug, Sep, Oct, Nov, Dec 484 18 Spruce-birch
3 1067 38o32' Jan, Mar, Apr, May, Sep, Oct, Dec 307 10 Hemlock
6 1300 38o29' Jan, Feb, Mar, Apr, May, Jun, Aug, Sep, Oct, Dec 242 8 Spruce
6 1311 38o27' Jan, Feb, Mar, Apr, May, Jun, Aug, Sep, Oct, Dec 326 20 Spruce-birch
6 1219 38o27' Jan, Feb, Mar, Apr, May, Jun, Aug, Sep, Oct, Dec 185 9 Spruce-birch
6 1189 38o26' Jan, Feb, Mar, Apr, May, Jun, Jul, Aug, Sep, Oct, Dec 581 159 Spruce-birch
5 900 38o21' Mar, May, Jun, Aug, Oct, 36 15 Hemlock
5 1250 38o21' Jan, Mar, Apr, May, Jun, Aug, Oct, Dec 91 29 Spruce
7 1097 38o15' Feb, Mar, Apr, May, Jun, Aug, Oct, Nov, Dec 190 34 Spruce-birch
8 1341 38o10' Jan, Mar, Apr, May, Jun, Sep, Oct, Dec 102 21 Spruce
9 1067 37o47' Jan, Mar, Apr, May, Jul, Sep, Oct, Nov, Dec 149 27 Hemlock
10 1006 37o47' Jan, Mar, Apr, May, Jul, Sep, Oct, Nov, Dec 150 63 Hemlock
10 610 37o15' Jan, Mar, Apr, May, Jun, Jul, Aug, Sep, Nov 259 104 Hemlock
11 1400 37o05' Mar, May, Oct, Dec 181 0 Spruce-birch
12 1097 36o57' Mar, May, Jun, Sep, Oct, Nov, Dec 185 174 Hemlock
12 1402 36o56' Mar, May, Jul, Sep, Oct, Dec 297 46 Spruce-birch
13 1433 36o40' Mar, May, Jul, Sep, Oct, Nov, Dec 411 11 Spruce
13 1463 36o40' Apr, Jun, Dec 94 5 Spruce
13 1494 36o39' Mar, Apr, May, Jul, Sep, Oct, Nov, Dec 638 1 Spruce-fir-birch
13 1463 36o38' Mar, Apr, May, Dec 85 11 Spruce
13 1646 36o38' Mar, Apr, May, Jul, Aug, Sep, Oct, Nov, Dec 583 7 Spruce
ASite numbers depicted in Figure 1.