2011 NORTHEASTERN NATURALIST 18(1):115–122
Ozone-induced Leaf Symptoms on Vegetation in the Mingo
National Wildlife Refuge, Missouri
Donald D. Davis*
Abstract - Field surveys were conducted during 1998, 2000, 2003, and 2004 within
the Mingo National Wildlife Refuge in southeastern Missouri to determine if ambient
ground-level ozone was impacting ozone-sensitive refuge vegetation. Ozone-induced
leaf symptoms (stipple) were observed within the refuge during each survey year. Percentage
of bioindicator plants exhibiting stipple were wild grape (16.1%) > Common
Milkweed (16.0%) > ash (7.5%) > Black Cherry (6.7%) > Flowering Dogwood (4.9%)
> Sassafras (2.3%) > Sweetgum (1.2%). By year, the incidence of symptomatic plants
were 1998 (22.8%) > 2003 (3.9%) > 2000 (3.4%) > 2004 (2.5%). Cumulative ambient
ozone levels (SUM60, ppb.hrs) monitored at the closest EPA monitor (Bonne Terre, MO)
at time of survey were 1998 (44,886) > 2000 (39,611) > 2003 (38,465) > 2004 (15,147).
The cumulative SUM60 threshold value of ozone needed to cause foliar symptoms on
ozone-sensitive plants within the refuge appears to be ca. 10,000 ppb.hrs. Ozone injury is
likely to occur on ozone-sensitive plant species within the refuge during most years.
Introduction
The Mingo National Wildlife Refuge (Mingo NWR), located in southeastern
Missouri, was established in 1945 as a resting and wintering area for migratory
waterfowl. The Mingo NWR contains 8772 ha within a former Mississippi River
channel. The refuge is predominantly a bottomland-hardwood swamp, bordered
on the west by the Ozark Uplift foothills and on the east by Crowley’s Ridge.
Ridgetops are 123 m above mean sea level (MSL) and the basin floor is 103 m
above MSL (unpublished US Fish and Wildlife Service brochures).
In 1978, approximately 3000 ha of the refuge was designated the Mingo Wilderness
Area, which included a Class I air quality area, giving the refuge stringent
protection under the Clean Air Act as amended in 1977 (US Congress 1977). The
amended act gave federal land managers of Class I areas the responsibility to protect
air quality related values (AQRVs), including vegetation, wildlife, water, soils,
visibility, and cultural resources. Despite protection, wilderness areas have been
adversely impacted by ground-level ozone (Chappelka et al. 2003; Davis 2007a, b;
Lefohn and Manning 1995; Manning et al. 1996, Neufeld et. al. 1992) and may be
at risk from ambient ozone (Kohut 2007). In addition, AQRVs in Class I areas are to
be protected by federal law from deterioration over time. However, in order to assess
temporal deterioration, baseline values of AQRVs, such as vegetation health,
must be determined to detect future changes (Shaver et al. 1995).
The objectives of this survey were to: 1) determine if vegetation within the
refuge was exhibiting foliar stipple induced by ambient ozone and 2) determine
*Department of Plant Pathology and Penn State Institutes of Energy and the Environment,
Pennsylvania State University, University Park, PA 16802; ddd2@psu.edu.
116 Northeastern Naturalist Vol. 18, No. 1
the incidence (percentage) of ozone-sensitive bioindicator plants exhibiting
stipple. This paper is the fifth in a series dealing with ozone injury to vegetation
within US National Wildlife Refuges (Davis 2007a, 2007b, 2009; Davis and
Orendovici 2006).
Methods
Thompson (1980) published a list of woody flora assumed to occur within
the Mingo NWR, based on plant distributions in Missouri compiled by Steyermark
(1963). The author was furnished the list of potential refuge flora prior
to the initial 1998 field survey. From this list, the author identified the following
potential ozone-sensitive bioindicator plants (later summarized in USDOI
2003): Asclepias syriaca L. (Common Milkweed), Cercis canadensis L. (Redbud),
Cornus florida L. (Flowering Dogwood), Fraxinus sp. (ash), Liquidambar
styraciflua L. (Sweetgum), Prunus serotina Ehrh. (Black Cherry), Rhus aromatica
Ait. (Fragrant Sumac), Rhus copallina L. var. latifolia Engl. (Winged
Sumac), Sambucus canadensis L. (Black Elderberry), Sassafras albidum (Nutt.)
Nees. (Sassafras), and Vitis sp. (wild grape). Ozone bioindicators are broadleaved,
ozone-sensitive plants that respond to ambient ozone by producing
characteristic, diagnostic adaxial “stipple” as first described by Richards et al.
(1958) and later illustrated by Skelly (2000). More bioindicator species were
listed as occuring within the Mingo NWR than were found at other National
Wildlife Refuges surveyed by the author (Davis 2007a, 2007b, 2009; Davis and
Orendovici 2006). The high number of plant species in general, as well as bioindicator
species, is likely related to the refuge being located on the boundaries
of several floristic provinces (Steyermark 1963, Thompson 1980).
The closest EPA ozone-monitoring site to the Mingo NWR was located at
Bonne Terre, MO (EPA AIRS Site #29-186-0005), approximately 130 km north
(downwind) of the refuge. Ambient ground-level concentrations of ozone have
been monitored at this EPA site since 1996. Prior to the first survey, the author examined
ozone datasets for 1996 and 1997, and considered ozone concentrations
to be great enough to induce foliar symptoms. This information, along with the
presence of many species of ozone-sensitive plants within the refuge, provided
impetus for these surveys. Vegetation within the refuge was surveyed during late
summer 1998, 2000, 2003, and 2004 on dates listed in Table 1.
Survey methods were similar to those used in other wildlife refuges (Davis
2007a, 2007b, 2009; Davis and Orendovici 2006). The author conducted preliminary
field visits to locate survey sites that contained at least 10 individuals
of each potential bioindicator species growing in open areas with unrestricted
air movement and sunlight (Anderson et al. 1989). These criteria resulted in 10
potential survey sites being selected (Fig. 1), although all bioindicator species
were not present at all sites. In addition, some ozone-sensitive species occurred
only as scattered individuals, or were present in very few numbers. Bioindicator
species present in sufficient numbers were ash (Green and White Ash were not
distinguished), Black Cherry, Common Milkweed, Flowering Dogwood, Sassafras,
Sweetgum, and wild grape. At each survey area, the author counted the total
2011 D.D. Davis 117
number of individual plants of each bioindicator species and tallied the number
of plants exhibiting adaxial stipple. Stipple was noted as present or absent and
percentage (incidence) of plants exhibiting stipple was calculated for each bioindicator
species. Severity (percent symptomatic leaf tissue) was not evaluated.
A total of 1241 plants were evaluated during the 4 years of survey. Occasionally,
foliage on individual plants could not be evaluated due to severe insect injury,
defoliation, or discoloration.
Plant species, ozone concentration, and drought stress all influence amount
of ozone-induced stipple (Showman 1991, US DOI 2003, Yuska et al. 2003).
The author attempted to determine the relationship between these factors and
incidence of stipple using a binary logistic model, as had been utilized in previous
surveys (Davis 2007a, 2007b, 2009; Davis and Orendovici 2006). However,
the Pearson’s (chi-square) goodness-of-fit statistic was not significant (Minitab
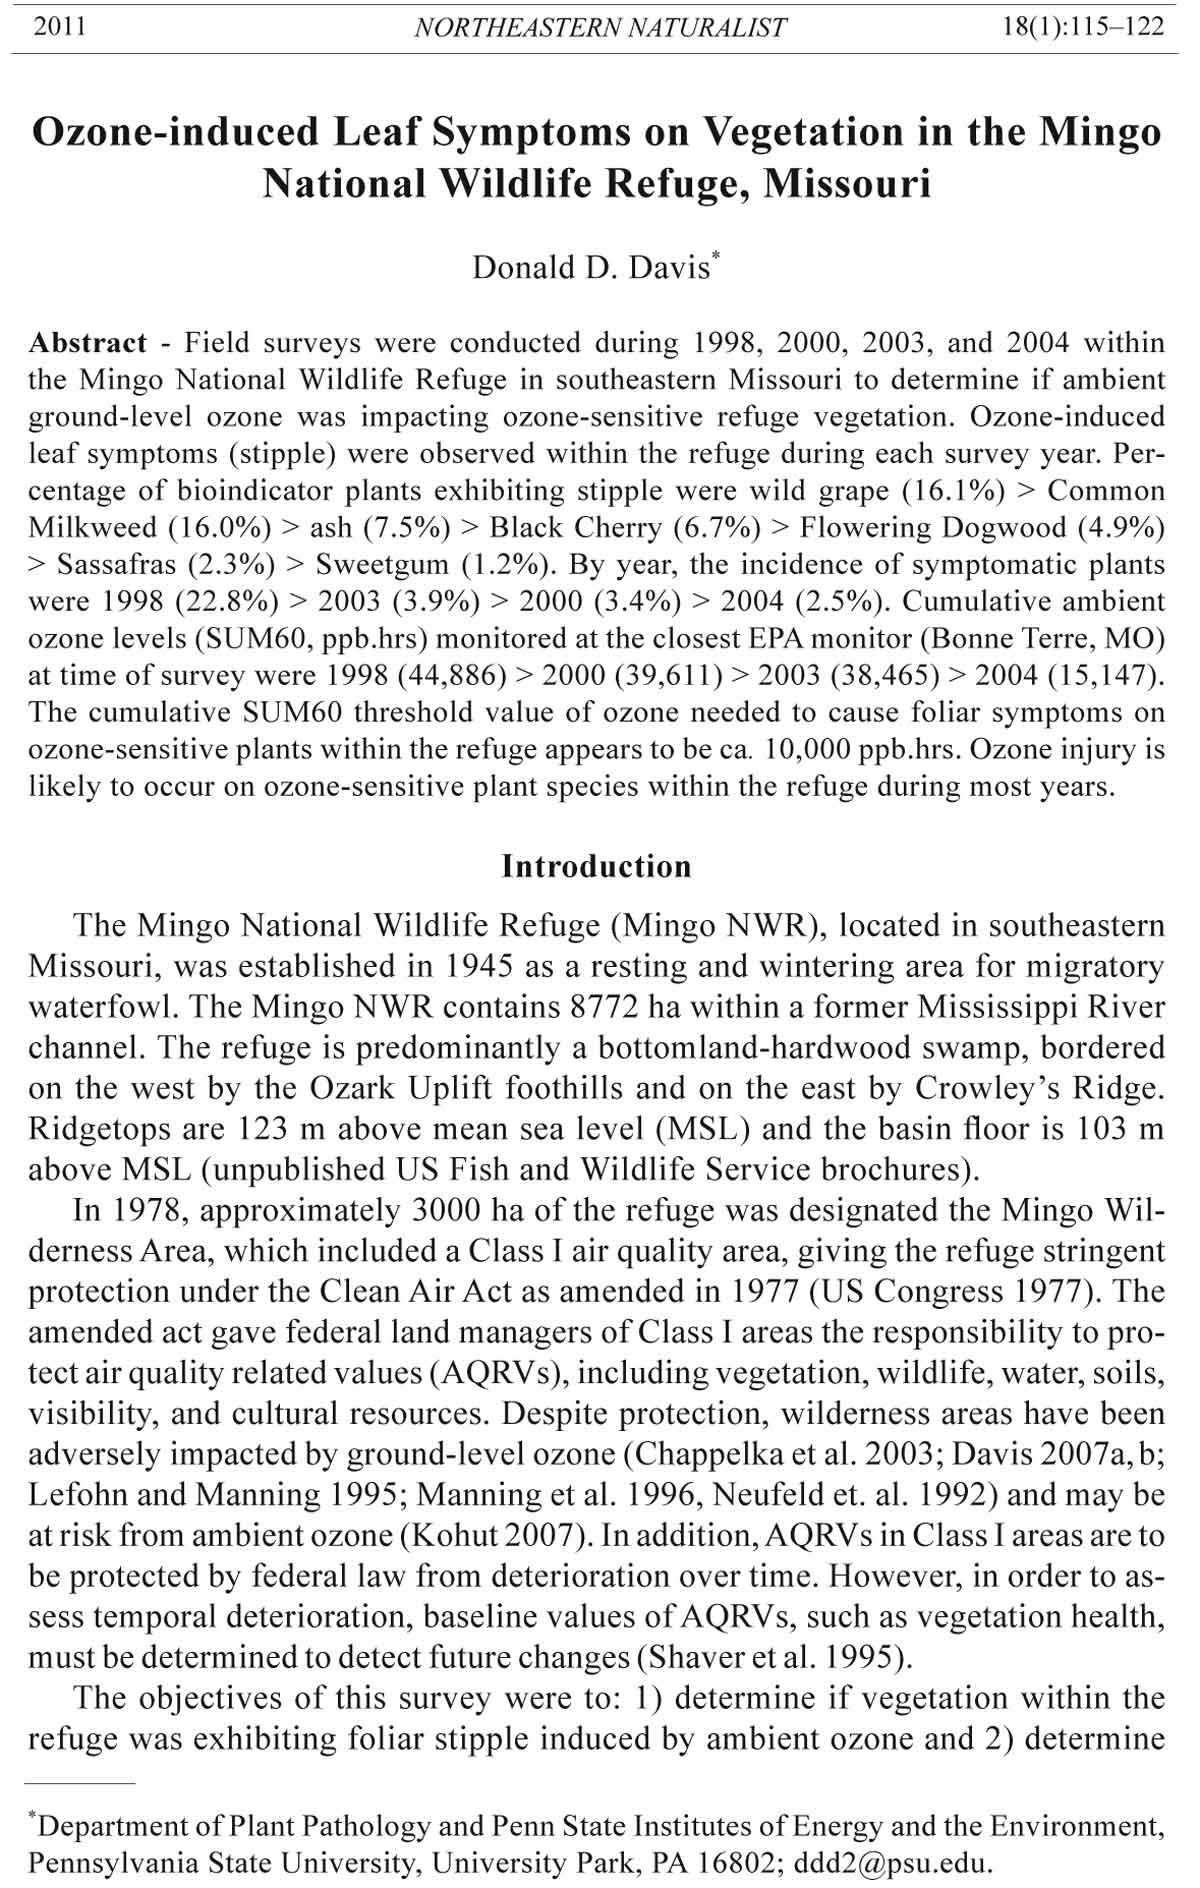
Figure 1. Location of 10 survey sites (circles with site numbers) in the Mingo NWR in
southeastern Missouri (Base map courtesy US Fish and Wildlife Service).
118 Northeastern Naturalist Vol. 18, No. 1
2003), and the model could not be utilized. Therefore, incidence of plants exhibiting
foliar stipple is simply presented in tabular format (Table 1), and SUM60
ozone levels for April through September of each survey year are graphed to illustrate
temporal ozone patterns during the growing season (Fig. 2).
Results and Discussion
Bioindicators
Symptomatic ash, Black Cherry, Common Milkweed, Flowering Dogwood,
Sassafras, Sweetgum, and wild grape exhibited classic, adaxial, ozone-induced
stipple (Richards et al. 1958, Skelly 2000). These seven species had the most
complete datasets, which were used in data summarization (Table 1). Across all 4
survey years and the seven species, 102 individuals out of 1241 (8.22%) exhibited
stipple. Incidence was greatest on wild grape (16.1%) and Common Milkweed
(16.0%), with percentage affected considerably greater than for the other species.
Across all species, the greatest incidence of symptomatic plants within a year occurred
in 1998 (23.0%), followed by 2003 (4.6%), 2004 (3.0%), and 2000 (2.7%).
However, incidence values for Black Cherry (n = 30) and Flowering Dogwood (n =
41) were based on small samples and must be interpreted with caution.
The author has utilized some of these bioindicator species during similar
surveys within other national wildlife refuges. Wild grape was used to evaluate
ozone-induced leaf stipple in the Edwin B. Forsythe NWR in New Jersey (Davis
and Orendovici 2006) and the Cape Romain NWR in South Carolina (Davis
Table 1. Summary of observations made during 1998, 2000, 2003, and 2004 surveys at the Mingo
NWR. Numbers in table refer to number of plants exhibiting ozone-induced leaf stipple as compared
to total number of plants evaluated for each bioindicator species; data also expressed as
percentages. A = ash sp., Ch = Cherry, CM = Common Milkweed, FD = Flowering Dogwood, WS
= Wild Sassafras, Sw = Sweetgum, Gr = wild grape sp.
Weighted
Survey date A Ch CM FD WS Sw Gr Mean
1998 (Sept. 4–7)
Number plants examined 137 7 51 10 39 22 30
Number plants injured 25 2 30 1 3 1 6
Percentage 18.2 28.6 58.8 10.0 7.7 4.5 20.0 23.0
2000 (Sept. 9–11)
Number plants examined 114 10 10 10 28 90 31
Number plants injured 3 0 0 0 0 1 4
Percentage 2.6 0.0 0.0 0.0 0.0 1.1 12.9 2.7
2003 (Sept. 12–14)
Number plants examined 180 7 100 11 35 34 22
Number plants injured 13 0 0 1 0 0 4
Percentage 7.2 0.0 0.0 9.1 0.0 0.0 18.2 4.6
2004 (Sept 3–5)
Number plants examined 113 6 39 10 30 24 41
Number plants injured 0 0 2 0 0 0 6
Percentage 0.0 0.0 5.1 0.0 0.0 0.0 14.6 3.0
Weighted mean (%) 7.5 6.7 16.0 4.9 2.3 1.2 16.1 8.2
2011 D.D. Davis 119
2009). Because of their widespread range, wild grapes are valuable bioindicators
to detect ozone-induced symptoms over wide geographic areas. However, grape
leaves may suffer from late-summer insect infestations that mask stipple and
complicate symptom evaluation. Common Milkweed is also very sensitive to
ambient ozone (Duchelle and Skelly 1981) and was used successfully as a bioindicator
within the Edwin B. Forsythe NWR in New Jersey (Davis and Orendovici
2006) and in the Seney NWR in Michigan (Davis 2007b). The author considers
Common Milkweed and wild grape among the most valuable ozone-sensitive
bioindicators for use in such refuge surveys.
Ambient ozone
Ambient ozone concentrations impinging on vegetation within the Mingo
NWR were approximated from the closest EPA monitoring site, located at Bonne
Terre, MO, approximately 130 km north (directly downwind during the ozone
season) of the refuge. It is unknown if ambient ozone levels monitored at Bonne
Terre accurately reflect ambient ozone levels within the refuge, and caution must
be exercised when relating ambient ozone data from Bonne Terre with ozoneinduced
vegetation symptoms within the Mingo NWR. Nevertheless, SUM60
(ppb.hrs) ozone levels at Bonne Terre as of the first day of survey in each year
were 44,886 ppb.hrs (1998), 39,611 ppb.hrs (2000), 38,465 ppb.hrs (2003), and
15,147 ppb.hrs (2004). The relatively high ambient ozone levels monitored during
1998, 2000, and 2003 were comparable to levels monitored at the Edwin B.
Figure 2. Cumulative sum of hourly ozone concentrations ≥60 ppb (SUM60, ppb.hrs)
at EPA AIRS Site # 29-186-0005, Bonne Terre, MO. The Bonne Terre monitoring site is
located approximately 130 km north of the Mingo NWR, directly downwind during the
ozone season.
120 Northeastern Naturalist Vol. 18, No. 1
Forsythe NWR in New Jersey, a refuge having high ambient ozone and signifi-
cant ozone-induced plant symptoms (Davis and Orendovici 2006). Ozone levels
at Bonne Terre were slightly greater than those monitored at the Moosehorn
NWR in Maine (Davis 2007a) and Cape Romain in South Carolina (Davis 2009),
but much greater than that monitored in the remote Seney NWR in the Upper
Peninsula of northern Michigan (Davis 2007b); plant injury due to ambient ozone
has been found in all of these refuges.
As expected, seasonal ozone concentrations at Bonne Terre gradually increased
from April to the end of summer (Fig. 2). However, ozone concentrations
continued to rise throughout the fall (data not shown) and did not level off as
had occurred in other refuges (Davis 2007a, 2007b, 2009; Davis and Orendovici
2006). In fact, during the non-survey year of 1999, the SUM60 ozone levels at
Bonne Terre ultimately reached approximately 80,000 ppb.hrs in November (data
not shown), an extremely high level of ozone. The possible impact of this high,
late-season ozone on refuge vegetation, or other refuge biota, is unknown.
Conclusions
If the ambient ozone concentrations monitored at the EPA site at Bonne Terre
reflect those at the Mingo NWR, the threshold value of SUM60 ozone needed
to cause foliar symptoms on ozone-sensitive plants within the Mingo NWR was
likely ca. ≤10,000 ppb.hrs (Fig. 1, Table 1), similar to the value estimated for the
Moosehorn NWR in Maine (Davis 2007a). In addition, phytotoxic concentrations
of ozone may occur by early June within the Mingo NWR (Fig. 2), revealing that
ozone stress may occur on late-spring or early-summer ephemeral plants (Barbo
et al. 1998, Davis and Orendovici 2006). Ozone injury that occurs on these early
season plants would not be detected during routine annual ozone injury surveys,
which are normally conducted in late summer (i.e., August). By August, new
growth might obscure ozone-induced symptoms formed during the spring, and/or
injured leaves may have excised by late summer. Manning (2003) cautioned that
use of cumulative ozone data as threshold values for predicting ozone injury to
plants should take into account biological and environmental factors that affect
ozone uptake via stomata. For example, soil moisture stress can induce stomatal
closure, which limits ozone uptake, thereby reducing or eliminating subsequent
ozone injury even in years of high ambient ozone concentrations (Showman
1991, Yuska et al. 2003).
In summary, foliar symptoms induced by ambient ground-level ozone were
observed on ozone-sensitive bioindicator plants within the Mingo NWR, which
includes a Class I air quality area. Ozone-induced stipple was observed during
each survey year, and likely occurs annually within the refuge. The highest
incidence of stipple was recorded during 1998, a year of relatively high ozone
concentrations. It is likely that environmental conditions for gas (ozone) uptake
and expression of foliar symptoms were also ideal during this year. Future surveys
to evaluate ozone-induced symptoms in the Mingo NWR should be conducted
in August, and should emphasize use of Common Milkweed and wild grape as
bioindicators. The US Fish and Wildlife Service should consider results of this
and similar surveys when making air quality management decisions, including
2011 D.D. Davis 121
review of Prevention of Significant Deterioration permits, regarding the Mingo
NWR. In addition, an ozone monitor should be located within the refuge, in or
near the Class I Wilderness Area.
Acknowledgments
The author gratefully acknowledges receiving financial support from the US Fish and
Wildlife Service, Air Quality Branch, Denver and The Pennsylvania Department of Environmental
Protection, Bureau of Air Quality, Harrisburg. The author also thanks David
Joseph, National Park Service, Air Resources Division, Lakewood, CO, for supplying the
EPA ozone data sets.
Literature Cited
Anderson, R.L., C.M. Huber, R.P. Belanger, J. Knighten, T. McCartney, and B. Book.
1989. Recommended survey procedures for assessing ozone injury on bioindicator
plants in Region 8 Class 1 Wilderness areas. USDA Forest Service, Forest Pest Management,
Asheville Field Office, NC. Report 89-1-36.
Barbo, D.N., A.H. Chappelka, G.L. Somers, M.S. Miller-Goodman, and K. Stolte. 1998.
Diversity of an early successional plant community as influenced by ozone. New
Phytologist 138:653–662.
Chappelka, A.H., H.S. Neufeld, A.W. Davidson, G.L. Romers, and J.R. Renfro. 2003.
Ozone injury on Cutleaf Coneflower (Rudbeckia laciniata) and Crown-beard (Verbesina
occidentalis) in Great Smoky Mountains National Park. Environmental Pollution
125:53–59.
Davis, D.D. 2007a. Ozone-induced symptoms on vegetation within the Moosehorn National
Wildlife Refuge in Maine. Northeastern Naturalist 14:403–414.
Davis, D.D. 2007b. Ozone injury to plants within the Seney National Wildlife Refuge in
northern Michigan. Northeastern Naturalist 14:415–424.
Davis, D.D. 2009. Ozone-induced stipple on plants in the Cape Romain National Wildlife
Refuge, South Carolina. Southeastern Naturalist 8:471–478.
Davis, D.D., and T. Orendovici. 2006. Incidence of ozone symptoms on vegetation
within a National Wildlife Refuge in New Jersey, USA. Environmental Pollution
143:555–564.
Duchelle, S.F., and J.M. Skelly. 1981. Response of Common Milkweed to oxidant air
pollution in the Shenandoah National Park in Virginia. Plant Disease 65:661–663.
Kohut, R. 2007. Assessing the risk of foliar injury from ozone on vegetation in parks
in the US National Park Service’s Vital Signs Network. Environmental Pollution
149:348–357.
Lefohn, A.S., and W.J. Manning. 1995. Ozone exposures near Class I wilderness areas in
New Hampshire and Vermont. Atmospheric Environment 29:601–606.
Manning, W.J. 2003. Detecting plant effects is necessary to give biological significance
to ambient ozone monitoring data and predictive ozone standards. Environmental
Pollution 126:375–379.
Manning, W.J., S.V. Krupa, C.J. Bergweiler, and K.I. Nelson. 1996. Ambient ozone (O3)
in three Class I wilderness areas in northeastern USA: Measurements with Ogawa
passive samplers. Environmental Pollution 91:399–403.
Minitab, Inc. 2003. MINITAB Statistical Software, Release 14 for Windows. State College,
PA, State College, PA.
122 Northeastern Naturalist Vol. 18, No. 1
Neufeld, H.S., J.R. Renfro, W.D. Hacker, and D. Silsbee. 1992. Ozone in Great Smoky
Mountains National Park. Pp. 594–617, In R.D. Berglund (Ed.). Tropospheric Ozone
and the Environment II. Air and Waste Management Association, Pittsburgh, PA.
Richards, B.L., J.T. Middleton, and W.B. Hewitt. 1958. Air pollution with relation to
agronomic crops. V. Oxidant stipple of grape. Agronomy Journal 50:559–561.
Shaver, C.L., K.A. Tonnessen, and T.G. Maniero. 1995. Clearing the air at Great Smoky
Mountains National Park. Ecological Applications 4:690–701.
Showman, R.E. 1991. A comparison of ozone injury to vegetation during moist and
drought years. Journal of the Air and Waste Management Association 41:63–64.
Skelly, J.M. 2000. Tropospheric ozone and its importance to forests and natural plant
communities of the northeastern United States. Northeastern Naturalist 7:221–236.
Steyermark, J.A. 1963. Flora of Missouri. Iowa State University Press, Ames, IA.
Thompson, R.L. 1980. Woody vegetation and floristic affinities of Mingo wilderness area,
a northern terminus of southern floodplain forest, Missouri. Castanea 45:194–212.
United States Congress (US Congress). 1977. The Clean Air Act as amended August
1977. P.L. 95-95. US Government Printing Office, Washington, DC.
United States Department of the Interior (US DOI). 2003. Ozone sensitive plant species
on National Park Service and US Fish and Wildlife Service lands: Results of a June
24–25, 2003 workshop, Baltimore, MD. Natural Resource Report NPS/NRARD/
NRR-2003/01.
Yuska, D.E., J.M. Skelly, J.A. Ferdinand, R.E. Stevenson, J.E. Savage, J.D. Mulik, and
A. Hines. 2003. Use of bioindicators and passive sampling devices to evaluate ambient
ozone concentrations in north-central Pennsylvania. Environmental Pollution
125:71–80.