Effects of Twenty Years of Deer Exclusion on Woody
Vegetation at Three Life-History Stages in a Mid-Atlantic
Temperate Deciduous Forest
Jennifer C. McGarvey, Norman A. Bourg, Jonathan R. Thompson,
William J. McShea, and Xiaoli Shen
Northeastern Naturalist, Volume 20, Issue 3 (2013): 451–468
Full-text pdf (Accessible only to subscribers. To subscribe click here.)
Access Journal Content
Open access browsing of table of contents and abstract pages. Full text pdfs available for download for subscribers.
Current Issue: Vol. 30 (3)

Check out NENA's latest Monograph:
Monograph 22


2013 NORTHEASTERN NATURALIST 20(3):451–468
Effects of Twenty Years of Deer Exclusion on Woody
Vegetation at Three Life-History Stages in a Mid-Atlantic
Temperate Deciduous Forest
Jennifer C. McGarvey1,2, Norman A. Bourg1, Jonathan R. Thompson1,*,
William J. McShea1, and Xiaoli Shen1
Abstract - Chronic browsing by Odocoileus virginianus (White-tailed Deer) has potential
to alter the life history of trees within Mid-Atlantic forests, including seedling size
and abundance in the short term to overstory composition in the long term. Most studies
quantify the effects of deer browse using small plots (<1 ha) and short time frames (<10
years), which may misrepresent larger-scale and longer-term impacts. We maintained a
4-ha deer exclusion plot for 20 years in a mesic northern Virginia temperate deciduous
forest to examine the impacts of browsing on forest trees at multiple life-history stages.
We compared the abundance and species composition, as well as seedling height, of
woody stems across the seedling, small-sapling, and large-sapling size classes inside
the deer exclosure and within an adjacent reference area. There were no significant differences
in seedling abundance or community composition, but seedling height was on
average 2.25 times greater in the exclosure than the reference plot. Small-sapling (1–5 cm
DBH) stem count was 4.1 times greater inside the exclosure, with all species more abundant
in the exclosure except Asimina triloba (Pawpaw) and Carya tomentosa (Mockernut
Hickory). Differences were smaller in the large-sapling size class (5–10 cm DBH), with
relative total large-sapling stem count only 1.25 times greater in the exclosure. Browsing
pressure appeared to influence the composition and size structure of smaller stems
in the past 20 years, but has had little effect on larger stems. While the lack of replication
limited the scope of inference of our study, our findings suggest that natural delays
in mature tree recruitment in a closed-canopy forest may mask the full impact of deer
herbivory for decades.
Introduction
In many temperate forests of the eastern United States, populations of Odocoileus
virginianus Zimmermann (White-tailed Deer) have increased dramatically
over the past 50 years (McShea et al. 1997). Suggested reasons for their population
growth include hunting restrictions, a decline in the number of hunters due
to social, ecological, and political challenges associated with deer population
management, reduced predator populations, and improved habitat (Brown et al.
2000, Côté et al. 2004, Rooney 2001). High White-tailed Deer densities have
been shown to affect short-term vegetation dynamics in deciduous forests of the
eastern United States by manipulating nutrient cycles and availability (Hobbs
1996), facilitating the spread of exotic species (Eschtruth and Battles 2009), and
reducing understory and woody species abundance (Rooney and Dress 1997).
1Smithsonian Institution, Smithsonian Conservation Biology Institute, 1500 Remount
Road, Front Royal, VA 22630. 2Department of Environmental Sciences, University of
Virginia, Clark Hall, Charlottesville, VA. *Corresponding author - thompsonjr@si.edu.
J.C. McGarvey, N.A. Bourg, J.R. Thompson, W.J. McShea, and X. Shen
2013 Northeastern Naturalist Vol. 20, No. 3
452
Short-term effects of deer browsing on woody vegetation may compound over
time, eventually causing alternate stable states in woody vegetation communities
(Stromayer and Warren 1997) and re-directing successional trends (Liang and
Seagle 2002).
The vast majority of stems regenerating under a closed canopy fail to reach the
overstory due to insufficient light, water, or nutrients (Mladenoff and Stearns 1993,
Peet and Christensen 1987). In addition, intense browsing by deer has the potential
to influence long-term successional dynamics by limiting seedling survival
and sapling growth. At an individual level, browsing of leaves and shoots delays
aboveground growth of seedlings, consequently reducing seedling survival rates
and densities (Dzieciolowski 1980, Gill and Beardall 2001, Healy 1997, Konig
1976, Putman et al. 1989). High deer densities may further inhibit seedling survival
and growth by facilitating invasion of weedy forbs and grasses that compete with
native seedlings (Horsley and Marquis 1983). Deer browsing has a similarly direct
effect on small-sapling growth and survival by reducing photosynthetic capability,
increasing mortality risk (Tripler et al. 2002), and inhibiting vertical recruitment
(Liang and Seagle 2002). Selective browsing on palatable species at these two
life-history stages potentially influences successional dynamics by altering the
composition, density, and diversity of the understory layer (Horsley et al. 2003,
Matonis et al. 2011, Rooney and Waller 2003, Stoeckeler et al. 1957). Healy (1997)
predicted that loss of Quercus spp. (oak) seedlings due to chronic deer browsing
in an oak-dominated forest in central Massachusetts eventually would cause the
elimination of oaks from the overstory. Intense browsing on seedlings and small
saplings may further impact successional status by changing stand structure to one
where large saplings and mature trees are disproportionately represented (Anderson
and Loucks 1979, Côté et al. 2004, Potvin et al. 2003, Stromayer and Warren
1997, Tilghman 1989). Finally, deer browsing may accelerate the rate of change
to late-successional species. For example, Liang and Seagle (2002) predicted that
the increased mortality of shade-intolerant Liriodendron tulipifera L. (Tulip Poplar)
due to browsing by deer would cause stands in a riparian forest in Maryland to
more quickly succeed to the shade-tolerant Fagus grandifolia Ehrh. (American
Beech). Overall, deer may inhibit colonization, growth, and survival of seedlings
and saplings, to eventually alter forest succession (Côté et al. 2004, Hobbs 1996,
Ritchie et al. 1998).
Other exclosure studies indicate the challenge of detecting the long-term
effects of chronic deer browsing within the constraints of short-term study durations.
Apsley and McCarthy (2004) observed a significant increase in woody stem
height following the exclusion of deer for two years after harvest in southern
Ohio mixed oak forests, but no difference in community composition or density,
suggesting it was too early to detect a significant effect of deer browsing on
woody vegetation regeneration. After twelve years of deer exclusion, hemlock
seedlings were able to re-establish in a northern Wisconsin forest, but there
were no detectable changes in sapling regeneration (Anderson and Katz 1993).
Similarly, following eighteen years of deer exclusion in a mixed-oak forest in
Pennsylvania, Abrams and Johnson (2012) observed an increase in tree seedling
453
J.C. McGarvey, N.A. Bourg, J.R. Thompson, W.J. McShea, and X. Shen
2013 Northeastern Naturalist Vol. 20, No. 3
number, but no stimulation of oak regeneration and sapling recruitment. Overall,
the long-term influence of persistent deer browsing on forest stand dynamics is
not well understood, as previous studies typically have been spatially and temporally
limited with deer exclosures smaller than 1 ha or experiments often lasting
less than ten years (Bowersox et al. 1995, Long et al. 2007, Rossell et al. 2005,
Sage et al. 2003, Tilghman 1989).
We quantified the impacts of intense deer browsing on tree composition and
structure by contrasting a 20-year, 4-ha deer exclosure with a comparable forest
area within the same stand of a Mid-Atlantic temperate deciduous forest
subjected to persistently high deer densities. Specifically we asked: Do woody
seedling species abundance, height, and composition differ between the deerexcluded
and reference areas? Also, does the composition of small and large
saplings differ between the treatment and reference areas?
Site Description
The 4-ha deer exclosure was erected in 1990. It is located within a 25.6-ha
Smithsonian Institute Global Earth Observatory (SIGEO; www.si.sigeo.edu) forest
dynamics plot at the Smithsonian Conservation Biology Institute (SCBI), a
1295-ha research facility located 3 km SE of Front Royal, VA (38°54N, 78°09W).
A 2.4-m wire fence surrounds the exclosure. The fence is maintained through
regular inspections for fallen tree limbs or trunks. Any deer that gain entry into
the exclosure are pushed out through a southwest-facing gate. The SIGEO plot is
located in a mature secondary mixed deciduous forest, with overstory tree ages
ranging from 84 to 124 years (J.R. Thompson and J.C. McGarvey, unpubl. data).
The canopy is dominated by Tulip Poplar, Quercus alba L. (White Oak), Q. rubra
L. (Northern Red Oak), Q. prinus L. (Chestnut Oak), Q. velutina Lam. (Black
Oak), Fraxinus americana L. (White Ash), Carya glabra Mill. (Pignut Hickory),
C. tomentosa (Lam. ex Pior.) Nutt. (Mockernut Hickory), and Nyssa sylvatica
Marsh. (Blackgum). Prominent understory components include Lindera benzoin
L. (Spicebush), Asimina triloba L. (Pawpaw), Carpinus caroliniana Walter
(American Hornbeam/Ironwood), Cercis canadensis L. (Eastern Redbud), and
Cornus florida L. (Flowering Dogwood). The plot is composed primarily of Myersville
and Montalto series soils, which are stony, steep, and well-drained. The
mean annual temperature for the area based on a nearby site is 12.7 ± 0.66 °C and
the mean annual cumulative precipitation is 96.2 ± 15.8 cm (D.E. Carr, University
of Virginia, Charlottesville, VA, 2011 unpubl. data). Elevation ranges from
273 to 338 m. The deer exclosure is on an average slope of 10° (range = 4–17°)
with a western aspect (average = 267°, range = 228–332°). Since the exclosure
was constructed, estimates of deer density in the entirety of SCBI have fluctuated
at around 30 to 40 deer/km2 (Heckel et al. 2010, McShea 2000, McShea and
Schwede 1993) based on distance sampling methods and match estimates for the
past 20 years.
In January 2011, we identified a similarly sized area subjected to deer browse
to compare to the exclosure. We selected this “reference plot” on the criteria that
it was within the SIGEO plot, and had similar: (1) size, (2) overstory composition,
J.C. McGarvey, N.A. Bourg, J.R. Thompson, W.J. McShea, and X. Shen
2013 Northeastern Naturalist Vol. 20, No. 3
454
and (3) topographic setting to the exclosure. To objectively make this selection,
we classified each of the six hundred forty 20- x 20-m (400-m2) quadrats that form
the SIGEO plot to a group based on its overstory composition (i.e., basal area by
species) following Ward’s method of hierarchical cluster analysis with a Euclidian
distance matrix using the vegan library (Oksanen et al. 2011) within the R
statistical language (R Development Core Team 2010). Ward’s method minimizes
group sites by reducing the distance from each site to the centroid of the group
and is a robust method of classifying ecological community data (McCune and
Medford 1999). While Sørensen is a preferred measure of compositional dissimilarity
(and is what we used elsewhere in our analysis), it is incompatible with
Ward’s method; Euclidean distance, in contrast, is reliable and effective for use
in clustering (McCune et al. 2000). By examining the resulting dendrogram and
the percentage of information remaining after the formation of each cluster, we
settled on eight groups and mapped them on the SIGEO plot. We then identified the
proportion of quadrats assigned to each group within the deer exclosure and found
an approximately equal-sized area with the most similar overstory compositional
distribution. The identified site was 4 ha, and closely matched the exclosure in
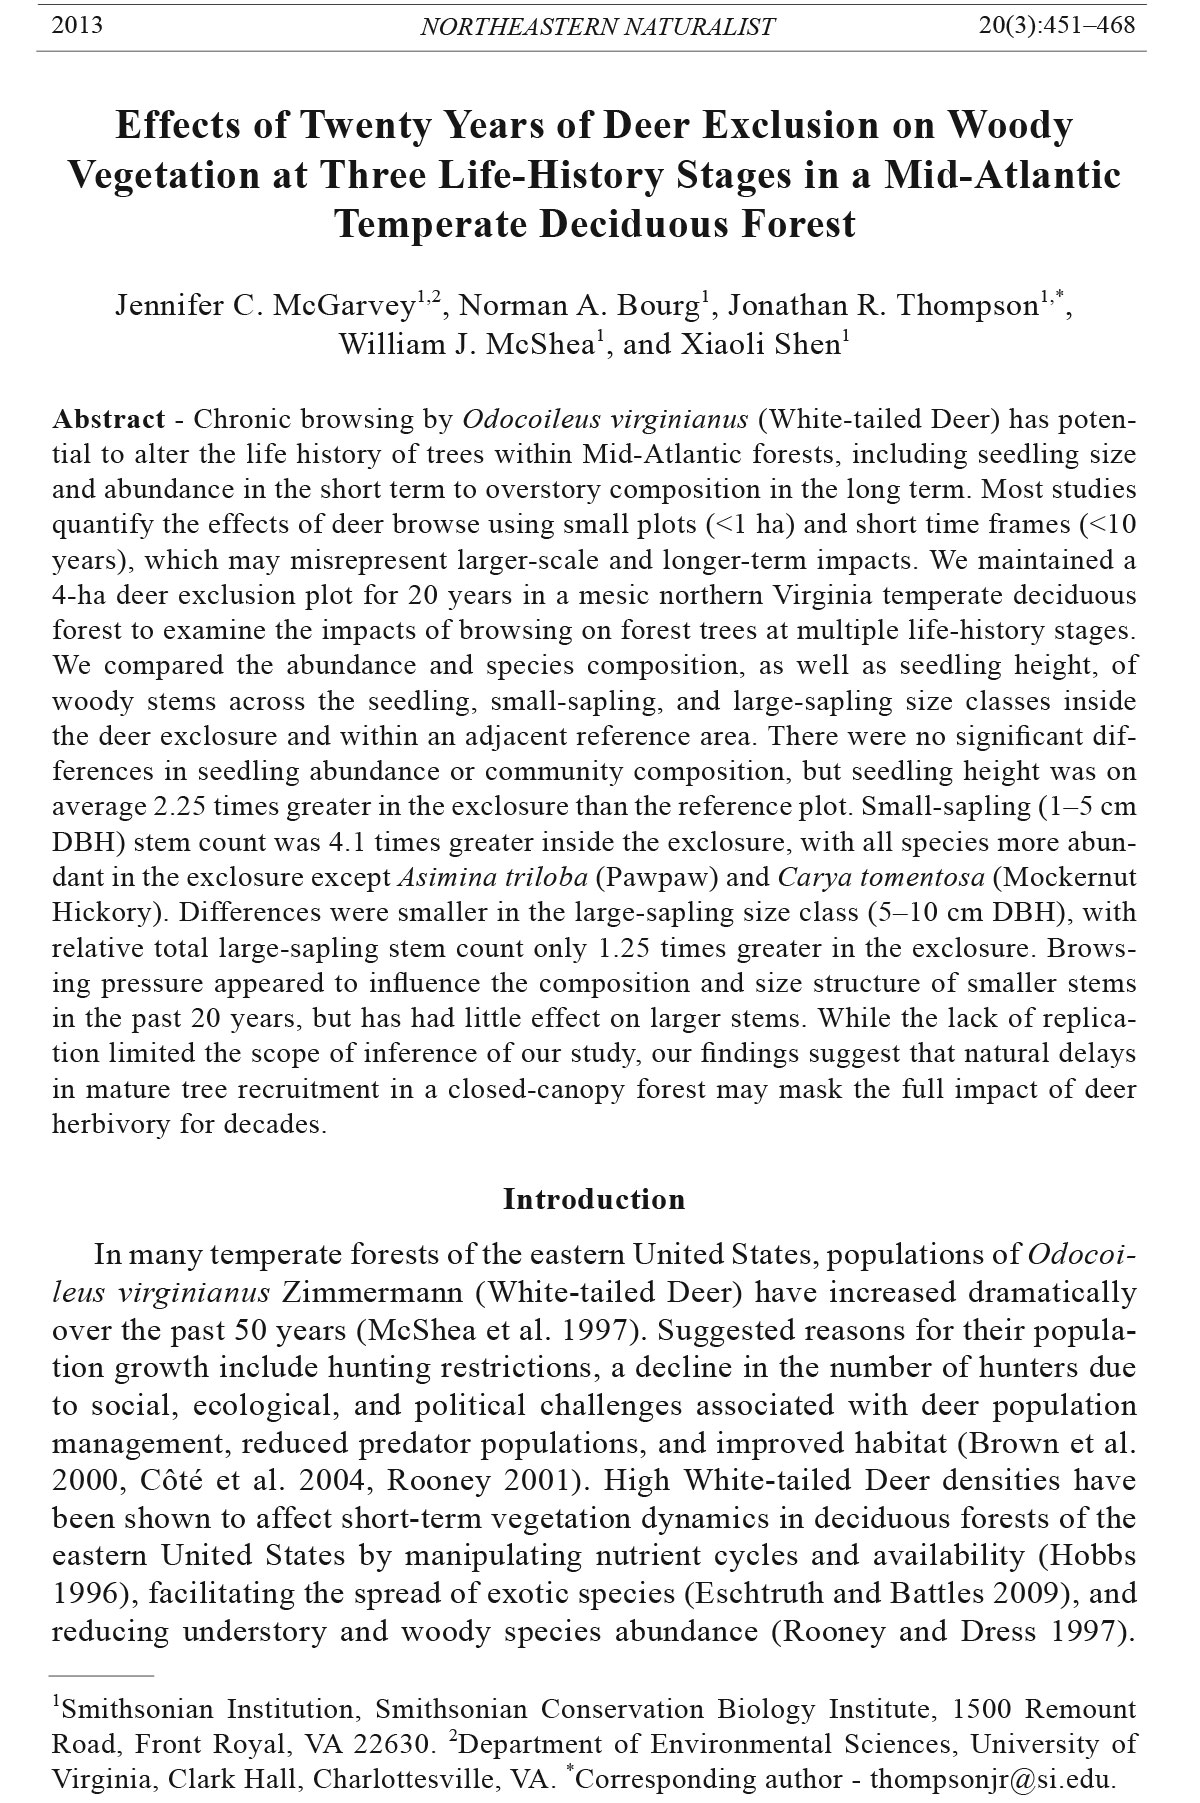
terms of overstory composition (Fig. 1), land-use history, slope (mean = 11°, range
= 1–20°), and aspect (mean = 260°, range = 4–360°).
Neither the deer exclosure nor the reference area was replicated. Therefore,
our samples of seed rain and our seedling plots that were randomly distributed
throughout the two areas (as described below) were pseudoreplicates (sensu
Hurlbert 1984). Similarly, our analyses of the small and large saplings (1–10 cm
DBH [diameter-at-breast-height; also described below]) is based on a complete
census of the areas and no greater inference is implied or warranted.
Methods
We examined seed rain composition within the exclosure and reference area
to further evaluate our rationale for comparing the two sites (i.e., that similar
overstory would result in similar seed production and, in turn, similar regeneration
potential). Seed rain was monitored from April 2009 to April 2011 in
randomly placed 0.5-m2 traps with a minimum of 20-m between each trap. Traps
were distributed based on habitat types, with a set number of traps in each type.
Samples were collected biweekly from the traps within the exclosure (n = 38)
and the reference plot (n = 32), with the exception of monthly collections from
December 2010 to March 2011 and no collections from January to April 2010 due
to heavy snow accumulations. Sampling efforts varied between collection dates
due to trap damage, and so relative annual seed abundances (seeds/total seeds/m2/
year) rather than total seed counts (seeds/m2/year) were used in the analysis to account
for variability. Traps were elevated off the ground and frequently sampled
to reduce risk of seed predation. All seeds and fruits collected were identified to
species whenever possible. Counts of individuals per species during each sampling
period were categorized into four bins: 1, 2–5, 5–20, and >21 individuals.
The mid-point values for each of the first three bins, and the minimum value for
the fourth bin, were then used to estimate abundance for each species. Because
455
J.C. McGarvey, N.A. Bourg, J.R. Thompson, W.J. McShea, and X. Shen
2013 Northeastern Naturalist Vol. 20, No. 3
seeds still attached to multi-seeded fruits were not physically removed and
counted, fruits and seeds were considered equivalent during analysis. We tested
for differences in overall community composition between the exclosure and the
reference using a permutation-based MANOVA (i.e., PerMANOVA; Anderson
2001), with a Sørensen’s distance matrix and 9999 permutations as implemented
in the adonis() function of the Vegan library (Oksanen et al. 2011) within the R
statistical language (R Development Core Team 2010). In addition, we compared
absolute and relative (seeds/m2/basal area m2/yr) seed abundance by species between
the exclosure and the reference area by identifying any overlap in the 95%
confidence intervals of the means based on the Student’ s t-distribution.
We surveyed seedlings from July to August 2010, and re-surveyed from June
to August 2011. Seedlings were defined as woody tree stems <1 cm DBH. We
identified to species and measured the height of all seedlings in three 1-m2 subplots
placed 2 m away to the east, west, and south of randomly-selected seed rain
traps within the exclosure (n = 30) and the reference area (n = 17). The proximity
of the seedling plots to the seed traps allowed for accurate evaluation of seed-toseedling
transitions. Data from the three sub-plots at each seed trap were pooled
Figure 1. The relative proportion of each cluster group in the exclosure and the reference
plot. The numbers refer to overstory community types using a cluster analysis based on
basal area of the ten dominant tree species in each unit. Each community type is described
here based on the species that make up approximately 80% of the basal area in that group,
where 1 = Fraxinus americana, Liriodendron tulipifera, Quercus prinus, and Carya glabra;
2 = L. tulipifera; 3 = L. tulipifera, Q. velutina, C. glabra, and C. tomentosa; 4 = Q.
rubra, L. tulipifera, Q. velutina, and C. glabra; 5 = Acer rubrum, Nyssa sylvatica, and Q.
prinus; 6 = Q. alba, L. tulipifera, Q. rubra, and Q. velutina; 7 = Q. velutina, L. tulipifera,
and Q. alba; 8 = variable.
J.C. McGarvey, N.A. Bourg, J.R. Thompson, W.J. McShea, and X. Shen
2013 Northeastern Naturalist Vol. 20, No. 3
456
together and averaged across the two sampling years to calculate species abundance.
While woody shrubs and to a lesser extent vines were both components
of the understory vegetation, our analyses focused on the understory and canopy
tree species that had the physiological potential to grow into the large-sapling
size class. We compared average relative seedling abundance (seedlings/m2/
year), average seedling height, and small- and large-sapling density of the twenty
most abundant tree species relative to their size class for the reference area and
the exclosure by identifying any overlap in the 95% confidence intervals around
the means (using the Student’s t-distribution). We compared overall seedling
community composition between the exclosure and reference area, again using a
PerMANOVA and a Sørenson distance matrix.
The seed rain and seedling surveys were part of larger-scale studies conducted
throughout the SIGEO plot. As a result, differences in sampling efforts between
the reference plot and the exclosure reflect the sampling design of the largerscale
studies. Specifically, seedling plots were randomly stratified to adequately
sample stream courses in the plot and the exclosure, resulting in a greater sampling
effort in the exclosure than the reference area. The 95% confidence interval
estimates for seed rain and seedling abundance and the subsequent analysis may
reflect differences in sampling effort, as well as variability within the sample.
From June to December 2008, a census of all woody stems ≥1 cm DBH was
completed in the SIGEO plot using the methodology of Condit (1998). All stems
were identified to species, measured for DBH, tagged and mapped on a global
x, y-coordinate system where any given stem was measured in meters relative
to the southwest corner of the SIGEO plot. Stems ranging from 1 to 5 cm DBH
were classified as small saplings, and stems ranging from 5.1 to 10 cm DBH were
classified as large saplings for our analysis. Because we had a complete census of
all saplings, no statistical tests were needed to compare differences between the
exclosure and reference areas.
Results
There was no significant difference between the exclosure and the reference
site in overall community composition of the seed rain, whether scaled by basal
area or not (df = 70, P = 0.09 and 0.95, respectively). Of the twenty most abundant
tree species, average yearly relative seed rain abundance was significantly
different for only Platanus occidentalis L. (American Sycamore) and White
Oak. American Sycamore was significantly more abundant inside the exclosure
(exclosure = 0.07 ± 0.011 seeds/total seeds/m2/year, reference = 0.030 ± 0.007
seeds/total seeds/m2/year) and in the reference for White Oak (exclosure = 0.001
± 0.001 seeds/total seeds/m2/year, reference = 0.015 ± 0.012 seeds/total seeds/m2/
year) (Fig. 2). Only two species had significantly different average relative seed
Figure 2 (opposite page). Mean annual relative seed abundance of the 20 most abundant
tree species (top) and with LITU removed to show minor species (bottom). In
both graphs, error bars represent 95% confidence intervals around the mean based on
t-distribution. See Appendix A for definitions of species codes.
457
J.C. McGarvey, N.A. Bourg, J.R. Thompson, W.J. McShea, and X. Shen
2013 Northeastern Naturalist Vol. 20, No. 3
J.C. McGarvey, N.A. Bourg, J.R. Thompson, W.J. McShea, and X. Shen
2013 Northeastern Naturalist Vol. 20, No. 3
458
production, with Acer negundo L. (Box Elder) (exclosure = 0.029 ± 0.020 seeds/
m2/basal area m2/yr, reference = 0.0 seeds/m2/basal area m2/yr) and Ailanthus
altissima Mill. (Tree-of-heaven) (exclosure = 0.124 ± 0.042 seeds/m2/basal area
m2/yr, reference = 0.0 seeds/m2/basal area m2/yr) having greater relative seed
production in the exclosure than the reference (Fig. 3). Notably, while seed rain
overall was an accurate predictor of canopy composition, a major portion of the
American Sycamore and Tree-of-Heaven seeds likely came from off the plots, as
there are few American Sycamores and no mature Tree-of-Heaven individuals in
either the exclosure or the reference plots.
Mean seedling height was nearly 2.25 times greater in the exclosure than in
the reference area (exclosure = 18.0 ± 1.0 cm, reference = 8.76 ± 0.39 cm). In
contrast, there were few differences in seedling abundances. Specifically, there
were no differences in species-level abundance, and the rank abundance for the
top ten species were the same in the exclosure and reference area (Fig. 4). The
tests for difference in overall community change were insignificant with a marginal
P-value (df = 69, P = 0.06).
In the census of the twenty most abundant small tree saplings (1–5 cm DBH),
total stem count for all species was 4.1 times greater in the exclosure than the
reference area. With the exception of Pawpaw and Mockernut Hickory, all species
were more abundant in the exclosure (Fig. 5A). There was a less notable
difference in large-sapling (5.1–10 cm DBH) abundance than small-sapling
abundance. Stem count was only 1.25 times greater for large tree saplings. Only
eighteen species occurred in this size class in both the exclosure and the reference
area, and seven of these species were more abundant in the exclosure (Fig. 5B).
Discussion
Of the four life-history stages examined, seedling height and small-sapling
abundance were most notably reduced by deer browsing. Seedling height was
over twice that in the exclosure than in the reference plot. Previous studies have
observed similar effects of deer browsing on seedlings. Apsley and McCarthy
(2004) found no differences in the seedling densities of ten hardwood species
(with the exception of Blackgum) in southern Ohio mixed oak forests following
two years of deer exclusion, but seedlings were on average approximately 16.1%
shorter in the non-excluded areas. This effect of deer browsing on seedling height
in the SIGEO plot and at other deciduous forest sites also has been documented
for herbaceous species (Anderson 1994, Fletcher et al. 2001, Goetsch et al. 2011,
Heckel et al. 2010). Inhibiting stem growth at this stage has the potential to alter
species composition and stand structure. Limiting seedling height may increase
mortality risk through competition with other understory vegetation, thereby
Figure 3 (opposite page). Mean annual relative seed production of the 20 most abundant
tree species scaled by basal area of tree species (top) and with LITU removed to show
minor species (bottom). In both graphs, error bars represent 95% confidence intervals
around the mean based on t-distribution. See Appendix A for definitions of species codes.
459
J.C. McGarvey, N.A. Bourg, J.R. Thompson, W.J. McShea, and X. Shen
2013 Northeastern Naturalist Vol. 20, No. 3
J.C. McGarvey, N.A. Bourg, J.R. Thompson, W.J. McShea, and X. Shen
2013 Northeastern Naturalist Vol. 20, No. 3
460
461
J.C. McGarvey, N.A. Bourg, J.R. Thompson, W.J. McShea, and X. Shen
2013 Northeastern Naturalist Vol. 20, No. 3
altering future species composition (Tilghman 1989). While these implications
are compelling, greater seedling height in the exclosure will only be advantageous,
in successional terms, if other resources (i.e., water, light, and nutrients)
are also available to the seedling.
Similar seedling abundances suggest that factors other than deer browsing
determine seedling establishment and short-term survival. Two possible factors
may be light availability and leaf-litter depth. Light availability is widely
considered a key factor in determining species composition, favoring earlysuccessional
seedlings in high light levels and to a lesser extent in low levels
(Beaudet and Messier 1998, Cornelissen et al. 1996, Walters et al. 1993).
Similarly, leaf-litter depth may affect seedling species richness (Xiong and
Nilsson 1999). Litter accumulation is correlated with reduced species diversity,
inhibiting seedling establishment by acting as a barrier to seeds accessing soil
moisture (Kota et al. 2007). Above all, seedling mortality frequently is unpredictable
because of considerable annual variability in both precipitation and
seed production by canopy trees (Boerner and Brinkman 1996). This variability
may mask effects of deer browsing on seedling abundance.
We observed a delayed effect of deer herbivory on species abundance
between the seedling and small-sapling size classes. Small saplings were
overwhelmingly more abundant in the exclosure than in the reference area for
all species, with the exception of Pawpaw and Mockernut Hickory (Fig. 5A).
Our results support findings from smaller-scale exclosure studies, with deer
browsing having the most notable effect on woody stems at this life-history
stage (Rooney et al. 2000). Pawpaw is unpalatable to deer (Asnani et al. 2006),
perhaps explaining why it was more successful in the reference plot. We do not
know why Mockernut Hickory was slightly more abundant in the reference plot
as it is palatable, and previous studies have identified herbivory as a primary
factor limiting Mockernut Hickory seedling establishment (e.g., McCarthy
1994, Myster and McCarthy 1989).
Differences in large-sapling abundances were less apparent than those observed
in the small-sapling class (Fig. 5B). Once the leader stem is out of the
browse zone (approximately 2 m), deer-caused mortality is less likely (Vila et al.
2002). These larger saplings might have reached this height prior to the installation
of the deer exclosure, and so did not benefit from the reduced browsing
pressure. However, another explanation might be that deer had no role promoting
or inhibiting the transition of stems from small to large saplings; rather, other
environmental variables determined the survivorship of small saplings. Without
knowing the age of the larger saplings, we cannot determine whether they generated
before the exclosure installation, and so were subjected to deer browsing, or
Figure 4 (opposite page). Average annual relative abundance of the 20 most abundant tree
seedlings (top) and with LITU and FRAM2 removed to show minor species (bottom). In
both graphs, error bars indicate 95% confidence intervals around the mean based on a
t-distribution. See Appendix A for definitions of species codes.
J.C. McGarvey, N.A. Bourg, J.R. Thompson, W.J. McShea, and X. Shen
2013 Northeastern Naturalist Vol. 20, No. 3
462
Figure 5. (A) Census of the 20 most abundant small saplings (1–5 cm DBH). (B) Census
of the 18 most abundant large saplings (5.1–10 cm DBH). Graphs sorted by the most
abundant species in the exclosure followed by species most abundant in the reference
area. The inset graphs are of the sum total of the 20 most abundant tree saplings. Confidence
intervals and P-values were not calculated because we had a complete census of
stems >1 cm DBH. See Appendix A for definitions of species codes.
463
J.C. McGarvey, N.A. Bourg, J.R. Thompson, W.J. McShea, and X. Shen
2013 Northeastern Naturalist Vol. 20, No. 3
afterwards, implying large-sapling abundance was controlled by other variables.
We addressed this age question post hoc by sampling large saplings (n = 30) from
along the northern and eastern edge of the SIGEO study area in November 2011.
We did not collect sapling cores from inside the reference or exclosure in order
to preserve the integrity of other on-going studies. The overstory in this ancillary
sampling area had a similar species composition and age to the reference
and exclosure. We selected both potential canopy and understory tree species to
reflect the sapling species composition seen in the exclosure and reference area.
On average, saplings were notably older than 20 years (47 ± 5.5 years), and so
were well-established at the time of the exclosure installation. This result supports
our first conclusion, that many of the large saplings in both the reference
and exclosure were subjected to the same browsing pressure in the small sapling
stage. It also implies that the predominant size-class transition to occur since the
installation of the deer exclosure was from seedling to small sapling.
Conclusions
After 20 years of excluding deer, we found more than a two-fold difference in
average tree seedling height and a four-fold increase in the abundance of small
saplings, with significant increases found across nearly all sapling species. In
contrast, we found little difference in seedling abundance or seedling community
composition, and only a small difference in the abundance of large saplings.
Given the differences in understory seedling height, the most significant impact
of deer browse will only be realized through interactions with gap-scale disturbance.
Clearly, whether or not advanced regeneration is present to utilize newly
available resources is dramatically affected by chronic browsing. Relative to the
complete absence of White-tailed Deer, deer browsing has been shown to negatively
influence woody vegetation height and species richness at densities as low
as 4 deer/km2, a substantially lower deer density than observed at SCBI and in
most eastern forests (Horsley et al. 2003). Nonetheless, as stated by Mladenoff
and Stearns (1993) regarding hemlock in the Northern Great Lakes region, deer
herbivory is only one of several pertinent factors that determine regeneration.
There are many other variables, including climate, life-history characteristics,
and particularly disturbance, that also influence regeneration.
Acknowledgments
Establishment of the SCBI SIGEO plot by William McShea and Norman Bourg was
funded by the HSBC Climate Partnership, the SIGEO Initiative and the Smithsonian
Institution. Numerous technicians, interns, and volunteers of the Conservation Ecology
Center at SCBI were essential in assisting with plot establishment and data collection,
most notably Shawn Behling, Megan Baker, Sumana Serchan, and Chris Lewis. Support
for the original fence installation was provided by Friends of the National Zoo and Earthwatch.
Additional thanks to Richard Lucas, John Parker, and the anonymous reviewers
for Northeastern Naturalist for their helpful comments on later drafts of the paper.
J.C. McGarvey, N.A. Bourg, J.R. Thompson, W.J. McShea, and X. Shen
2013 Northeastern Naturalist Vol. 20, No. 3
464
Literature Cited
Abrams, M.D., and S.E. Johnson. 2012. Long-term impacts of deer exclosures on mixedoak
forest composition at the Valley Forge National Historical Park, Pennsylvania,
USA. The Journal of the Torrey Botanical Society 139:167–180.
Anderson, R.C. 1994. Height of White-flowered Trillium (Trillium grandiflorum) as an
index of deer browsing intensity. Ecological Applications 4:104–109.
Anderson, R.C., and A.J. Katz. 1993. Recovery of browse-sensitive tree species following
release from White-tailed Deer, Odocoileus virginianus Zimmerman, browsing
pressure. Biological Conservation 63:203–208.
Anderson, R.C., and O.L. Loucks. 1979. White-tail Deer (Odocoileus virginianus) influence
on structure and composition of Tsuga canadensis forests. Journal of Applied
Ecology 16:855–861.
Apsley, D.K., and B.C. McCarthy. 2004. White-tailed Deer herbivory on forest regeneration
following fire and thinning treatments in southern Ohio mixed oak forests. Pp.
461–471, In D.A. Yaussey, D.A. Hix, R.P. Long, and P.C. Goebel (Eds.). 14th Central
Hardwood Forest Conference. Newtown Square, PA. US Department of Agriculture,
Forest Service, Northeastern Research Station, Wooster, OH.
Asnani, K.M., R.A. Klips, and P.S. Curtis. 2006. Regeneration of woodland vegetation
after deer browsing in Sharon Woods, Metro Park, Franklin County, Ohio. Ohio Journal
of Science 106:86–92.
Beaudet, M., and C. Messier. 1998. Growth and morphological responses of Yellow
Birch, Sugar Maple, and Beech Seedlings growing under a natural light gradient.
Canadian Journal of Forest Research 28:1007–1015.
Boerner, R.E.J., and J.A. Brinkman. 1996. Ten years of tree seedling establishment and
mortality in an Ohio deciduous forest complex. Bulletin of the Torrey Botanical Club
123:309–317.
Bowersox, T.W., G.L. Storm, and W.M. Tzilkowski. 1995. Canopy openings and Whitetailed
Deer influence the understory vegetation in mixed oak woodlots. General Technical
Report. Proceedings, 10th Central Hardwood Forest Conference, US Department
of Agriculture, Forest Service, Northeastern Forest Experiment Station, Radnor, PA.
Brown, T.L., D.J. Decker, S.J. Riley, J.W. Enck, T.B. Lauber, P.D. Curtis, and G.F. Mattfeld.
2000. The future of hunting as a mechanism to control White-tailed Deer populations.
Wildlife Society Bulletin 28:797–807.
Condit, R. 1998. Tropical Forest Census Plots: Methods and Results from Barro Colorado
Island, Panama and a Comparison with Other Plots. Springer, Berlin, Germany
Cornelissen, J.H.C., P.C. Diez, and R. Hunt. 1996. Seedling growth, allocation, and
leaf attributes in a wide range of woody plant species and types. Journal of Ecology
84:755–765.
Côté, S.D., T.P. Rooney, J.-P. Tremblay, C. Dussault, and D.M. Waller. 2004. Ecological
impacts of deer overabundance. Annual Review of Ecology, Evolution, and Systematics
35:113–147.
Dzieciolowski, R. 1980. Impact of deer browsing upon forest regeneration and undergrowth.
Polish Journal of Ecology 28:583–599.
Eschtruth, A.K., and J.J. Battles. 2009. Assessing the relative importance of disturbance,
herbivory, diversity, and propagule pressure in exotic plant invasion. Ecological
Monographs 79:265–280.
465
J.C. McGarvey, N.A. Bourg, J.R. Thompson, W.J. McShea, and X. Shen
2013 Northeastern Naturalist Vol. 20, No. 3
Fletcher, J.D., W.J. McShea, L.A. Shipley, and D. Shumway. 2001. Use of common forest
forbs to measure browsing pressure by White-tailed Deer (Odocoileus virginianus
Zimmerman) in Virginia, USA. Natural Areas Journal 21:172–176.
Gill, R.M.A., and V. Beardall. 2001. The impact of deer on woodlands: The effects
of browsing and seed dispersal on vegetation structure and composition. Forestry
74:209 –218.
Goetsch, C., J. Wigg, A.A. Royo, T. Ristau, and W.P. Carson. 2011. Chronic over
browsing and biodiversity collapse in a forest understory in Pennsylvania: Results
from a 60-year-old deer exclusion plot. The Journal of the Torrey Botanical Society
138:220–224.
Healy, W.M. 1997. Influence of deer on the structure and composition of oak forests in
central Massachusetts. Pp. 246–266, In W.J. McShea, H.B. Underwood, and J.H. Rappole
(Eds.). The Science of Overabundance: Deer Ecology and Population Management.
Smithsonian Institution Press, Washington, DC.
Heckel, C.D., N.A. Bourg, W.J. McShea, and S. Kalisz. 2010. Nonconsumptive effects
of a generalist ungulate herbivore drive decline of unpalatable forest herbs. Ecology
91:319–326.
Hurlbert, S.H. 1984. Pseudoreplication and the design of ecological field experiments.
Ecological monographs 54:187–211.
Hobbs, N.T. 1996. Modification of ecosystems by ungulates. The Journal of Wildlife
Management 60:695–713.
Horsley, S.B., and D.A. Marquis. 1983. Interference by weeds and deer with Allegheny
hardwood reproduction. Canadian Journal of Forest Research 13:61–69.
Horsley, S.B., S.L. Stout, and D.S. DeCalesta. 2003. White-tailed Deer impact on the vegetation
dynamics of a northern hardwood forest. Ecological Applications 13:98–118.
Konig, E. 1976. Game damage and woodland regeneration. Schweiz Z Forstwes
127:40–57.
Kota, N.L., R.E. Landenberger, and J.B. McGraw. 2007. Germination and early growth
of Ailanthus and Tulip Poplar in three levels of forest disturbance. Biological Invasions
9:197–211.
Liang, S.Y., and S.W. Seagle. 2002. Browsing and microhabitat effects on riparian forest
woody seedling demography. Ecology 83:212–227.
Long, Z.T., T.H. Pendergast IV, and W.P. Carson. 2007. The impact of deer on relationships
between tree growth and mortality in an old-growth beech-maple forest. Forest
Ecology and Management 252:230–238.
Matonis, M.S., M.B. Walters, and J.D.A. Millington. 2011. Gap-, stand-, and landscapescale
factors contribute to poor Sugar Maple regeneration after timber harvest. Forest
Ecology and Management 262:286–298.
McCarthy, B.C. 1994. Experimental studies of hickory recruitment in a wooded hedgerow
and forest. Bulletin of the Torrey Botanical Club 121:240–250.
McCune, B., and M.J. Medford. 1999. PC-ORD for Windows. Multivariate analysis of
ecological data, MjM Software Design, Gleneden Beach, OR.
McCune, B., R. Rosentreter, J.M. Ponzetti, and D.C. Shaw. 2000. Epiphyte habitats in an
old conifer forest in western Washington, USA. Bryologist 103:417–427.
McShea, W.J. 2000. The influence of acorn crop on annual variation in rodent and bird
populations. Ecology 81:228–238.
J.C. McGarvey, N.A. Bourg, J.R. Thompson, W.J. McShea, and X. Shen
2013 Northeastern Naturalist Vol. 20, No. 3
466
McShea, W.J., and G. Schwede. 1993. Variable acorn crops, and the response of Whitetailed
Deer and other mast consumers. Journal of Mammalogy 74:999–1006.
McShea, W.J., H. Underwood, and J. Rappole. 1997. The Science of Overabundance:
Deer Ecology and Management. Smithsonian Institution Press, Washington, DC.
Mladenoff, D.J., and F. Stearns. 1993. Eastern Hemlock regeneration and deer browsing
in the Northern Great Lakes region: A re-examination and model simulation. Conservation
Biology 7:889–900.
Myster, R.W., and B.C. McCarthy. 1989. Effects of herbivory and competition on survival
of Carya tomentosa (Juglandaceae) seedlings. Oikos 56:145–148.
Oksanen, J., F.G. Blanchet, R. Kindt, P. Legendre, P.R. Minchin, R.B. O’Hara, G.L. Simpson,
P. Solymos, M.H.H. Stevens, and H. Wagner. 2011. Vegan: Community Ecology
Package. R package. Available online at http://CRAN.R-project.org/package=vegan.
Accessed 24 October 2011.
Peet, R.K., and N.L. Christensen. 1987. Competition and tree death. BioScience
37:586–595.
Potvin, F., P. Beaupre, and G. Laprise. 2003. The eradication of Balsam Fir stands by
White-tailed Deer on Anticosti Island, Quebec: A 150-year process. Ecoscience
10:487–495.
Putman, R.J., P.J. Edwards, J.C.E. Mann, R.C. How, and S.D. Hill. 1989. Vegetational
and faunal changes in an area of heavily grazed woodland following relief of grazing.
Biological Conservation 47:13–32.
R Development Core Team. 2010. R: A Language and Environment for Statistical Computing.
R Foundation for Statistical Computing, Vienna, Austria. Available online at
http://www.R-project.org/. Accessed 24 October 2011.
Ritchie, M.E., D. Tilman, and J.M.H. Knops. 1998. Herbivore effects on plant and nitrogen
dynamics in oak savanna. Ecology 79:165–177.
Rooney, T.P. 2001. Deer impacts on forest ecosystems: A North American perspective.
Forestry 74:201 –208.
Rooney, T.P., and W. Dress. 1997. Species loss over sixty-six years in the ground-layer
vegetation of Heart’s Content, an old-growth forest in Pennsylvania, USA. Natural
Areas Journal 17:297–305.
Rooney, T.P., and D.M. Waller. 2003. Direct and indirect effects of White-tailed Deer in
forest ecosystems. Forest Ecology and Management 181:165–176.
Rooney, T.P., R.J. McCormick, S.L. Solheim, and D.M. Waller. 2000. Regional variation
in recruitment of hemlock seedlings and saplings in the Upper Great Lakes, USA.
Ecological Applications 10:1119–1132.
Rossell Jr., C.R., B. Gorsira, and S. Patch. 2005. Effects of White-tailed Deer on vegetation
structure and woody seedling composition in three forest types on the Piedmont
Plateau. Forest Ecology and Management 210:415–424.
Sage Jr., R.W., W.F. Porter, and H.B. Underwood. 2003. Windows of opportunity: Whitetailed
Deer and the dynamics of northern hardwood forests of the northeastern US.
Journal for Nature Conservation 10:213–220.
Stoeckeler, J.H., R.O. Strothman, and L.W. Krefting. 1957. Effect of deer browsing on
reproduction in the northern hardwood-hemlock type in northeastern Wisconsin. Journal
of Wildlife Management 21:75–80.
Stromayer, K.A.K., and R.J. Warren. 1997. Are overabundant deer herds in the eastern
United States creating alternate stable states in forest plant communities? Wildlife
Society Bulletin 25:227–234.
467
J.C. McGarvey, N.A. Bourg, J.R. Thompson, W.J. McShea, and X. Shen
2013 Northeastern Naturalist Vol. 20, No. 3
Tilghman, N.G. 1989. Impacts of White-tailed Deer on forest regeneration in northwestern
Pennsylvania. The Journal of Wildlife Management 53:524–532.
Tripler, C.E., C.D. Canham, R.S. Inouye, and J.L. Schnurr. 2002. Soil nitrogen availability,
plant luxury consumption, and herbivory by White-tailed Deer. Oecologia
133:517–524.
Vila, B., G. Vourc’h, D. Gillon, J.-L.M. Martin, and F. Guibal. 2002. Is escaping deer
browse just a matter of time in Picea sitchensis? A chemical and dendroecological
approach. Trees—Structure and Function 16:488–496.
Walters, M.B., E.L. Kruger, and P.B. Reich. 1993. Growth, biomass distribution, and CO2
exchange of northern hardwood seedlings in high and low light: Relationships with
successional status and shade tolerance. Oecologia 94:7–16.
Xiong, S., and C. Nilsson. 1999. The effects of plant litter on vegetation: A meta-analysis.
Journal of Ecology 87:984–994.
J.C. McGarvey, N.A. Bourg, J.R. Thompson, W.J. McShea, and X. Shen
2013 Northeastern Naturalist Vol. 20, No. 3
468
Appendix A. Definitions of USDA-NRCS species codes.
Code Scientific name Common name
ACNE2 Acer negundo Box Elder
ACRU Acer rubrum Red Maple
ACER Acer sp. Maple
AIAL Ailanthus altissima Tree of Heaven
AMAR3 Amelanchier arborea (F.Michx.) Fernald Common Serviceberry
ASTR Asimina triloba Pawpaw
CACA18 Carpinus caroliniana American Hornbeam
CACO15 Carya cordiformis (Wangenh.) K.Koch Bitternut Hickory
CAGL8 Carya glabra Pignut Hickory
CAOV3 Carya ovalis (Wangenh.) Sarg. Red Hickory
CARYA Carya sp. Hickory
CATO6 Carya tomentosa Mockernut Hickory
CECA4 Cercis canadensis Eastern Redbud
CEOC Celtis occidentalis L. Common Hackberry
COFL2 Cornus florida Flowering Dogwood
FAGR Fagus grandifolia American Beech
FRAM2 Fraxinus americana White Ash
FRPE Fraxinus pennsylvanica Marshall Green Ash
FRAXI Fraxinus sp. Ash
HAVI4 Hamamelis virginiana L. Witch Hazel
LITU Liriodendron tulipifera Tulip Poplar
NYSY Nyssa sylvatica Blackgum
PINUS Pinus sp. Pine
PIST Pinus strobus L. White Pine
PLOC Platanus occidentalis American Sycamore
PRAV Prunus avium (L.) L. Sweet Cherry
PRSE2 Prunus serotina Ehrh. Black Cherry
PRUNU Prunus sp.
QUAL Quercus alba White Oak
QUCO2 Quercus coccinea Muenchh. Scarlet Oak
QUPR2 Quercus prinus Chestnut Oak
QURU Quercus rubra Red Oak
QUERC Quercus sp. Oak
QUVE Quercus velutina Black Oak
TIAM Tilia americana L. American Basswood
ULAM Ulmus americana L. American Elm
ULRU Ulmus rubra Muhl. Slippery Elm
ULMUS Ulmus sp. Elm

