Ecosystem Modeling in Cobscook Bay, Maine: A Boreal, Macrotidal Estuary
2004 Northeastern Naturalist 11(Special Issue 2):51–74
Controls on Surficial Materials Distribution in a
Rock-Framed, Glaciated, Tidally Dominated Estuary:
Cobscook Bay, Maine
JOSEPH T. KELLEY
1,* AND ALICE R. KELLEY
1
Abstract - Surficial materials were mapped on the bottom of Cobscook Bay,
ME, through aerial photography of intertidal habitats, side-scan sonar, and
seismic reflection profiling of subtidal regions. Like many other estuaries in
northern New England, this rocky, macrotidal estuary has only slight riverine input
and contains an abundance of till and fine-grained glacial-marine sediment.
Contrary to conceptual models of estuarine sediment and habitat distribution,
grain size does not become finer and habitats lower in energy in a landward direction
within the estuary. The irregular shoreline shape, imparted by bedrock,
forms a series of narrow constrictions separating broad bays. More than 70%
of the bottom of the estuary is floored by gravel and rock; mud deposits are
located in shallow-water coves throughout the Bay and in two large deposits in
the Central Bay. Here, circulation models predict two large gyres form because
water cannot pass through a bedrock constriction quickly enough. Natural gas
is present in sufficient quantities in the sediment column to facilitate sediment
mass movements near the mud deposits. Almost 60% of the intertidal zone
is composed of mudflats that are uniformly distributed within and along the
outside margin of the Bay, with increasing abundance of bedrock in a landward
direction. Small beaches occur wherever coarse-grained glacial sediment
erodes from bluffs. These observations depart from existing conceptual models
of estuarine sediment distribution based on coastal plain estuaries and suggest
that better understanding of biotic habitat or contaminant distribution in rocky
glaciated estuaries will require more localized models. These estuaries appear
more complex than coastal plain estuaries because of the unique outcrop pattern
of bedrock and glacial deposits in each bay.
Introduction
In 1937, Krumbein and Aberdeen applied the newly described logarithmic
measurement of sediment grain size to the spatial distribution of
sediments in a Louisiana estuary. They mapped sandy material near tidal
inlets and channels, with a fining of grain size in a landward direction.
Many other studies have subsequently described similar results (Holliday
et al. 1993) and generally attributed the grain size distribution to
a decline in wave and current energies in a direction away from the sea
(Nichols and Biggs 1985).
1Department of Earth Sciences, University of Maine, Orono, ME 04469-5790.
*Corresponding author - jtkelley@maine.edu.
52 Northeastern Naturalist Vol. 11, Special Issue 2
Most early geological work on estuarine sediment distribution was
based on observations from coastal plain estuaries, and a major focus was
often on understanding the spatial distribution of sand bodies in relation
to the development of models for petroleum exploration. Dalrymple et al.
(1992) attempted to extend and generalize our understanding of estuarine
facies globally, and elegantly summarized the salient features of macrotidal
and microtidal estuarine sediments. In their models, the estuary
is given a simple shape, a box or a triangle, within which wave and tidal
energies dominate the seaward end, while riverine energy most influences
the landward side. Sand and mud are assumed to be abundant, thus sandy
barriers (microtidal) or flats (macrotidal) dominate the estuarine mouth,
while muddy marshes fill the upper estuary.
The overall geological framework of a coastline defines the type
and shape of its estuaries (Inman and Nordstrom 1971) and strongly
influences many estuarine processes. In northeastern North America,
bedrock and glacial deposits are ubiquitous components of most estuaries
(Belknap et al. 1994, Kelley 1987, Kelley et al. 1986, Knebel et
al. 1999, McMaster 1960, Roman et al. 2000). In attempting to “distill
away all local variability and retain only the common features” of
the world’s estuaries, Dalrymple et al. (1992, p. 1133) neglect bedrock
and glacial deposits, and weaken the applicability of their model
to some important regional problems. In northeastern North America,
for example, many estuarine scientists seek to better understand the
spatial distribution of contaminants in estuaries (Larsen and Gaudette
1995, Mecray and Bucholtz-Ten-Brink 2000) and to map “essential
fish habitat” (Zajac et al. 2000). These tasks clearly require incorporation
of rock and glacial deposits into estuarine facies models
because large areas of the seafloor in the northeast are covered with
pre-Holocene material (Roman et al. 2000).
In addition, natural gas is a widespread feature in Holocene estuarine
sediments in the northeast (Fader 1991, Fleischer et al. 2001, Gontz et
al. 2002, Kelley et al. 1994). Gas reduces sediment strength, leading to
failure and submarine mass movements (Kelley et al. 1989). Gas is also
associated with pockmark fields, which are major morphologic components
of muddy northeast estuaries (Fader 1991, Kelley et al. 1994).
There are many salmon aquaculture sites within Cobscook Bay, ME
(Fig. 1), and potential exists for further growth (Brooks 2004, Department
of Marine Resources 1996, Sowles and Churchill 2004). Whether
these facilities are adding nutrients to the Bay, through fecal remains and
unconsumed food, in sufficient quantities to lead to local eutrophication
is an important policy question. Existing sediment transport models indicate
that pen-associated mud is mobile (Dudley et al. 2000), and conceptual
models (Dalrymple et al. 1992) suggest that the landward reaches of
a bay are the most likely sites for fine-grained sediment accumulation and
2004 J.T. Kelley and A.R. Kelley 53
organic matter build up. Those models may not apply to a rock-framed,
glaciated estuary, however. The need to understand estuarine sediment distribution
provides the basis for this research. Here we describe the surficial
materials of Cobscook Bay in relation to these earlier models. On the basis
of differences between our observations and existing models, we suggest
additional model components needed to understand sediment dispersal
mechanisms in rock-framed, glaciated estuaries.
Regional Setting and Previous Work
Cobscook Bay is located in the northeastern corner of the United
States, on the border between Maine and New Brunswick, Canada (Fig. 1).
Cobscook Bay is connected to Oak and Passamaquoddy Bays, which primarily
join with the Gulf of Maine through a large passage in northern
Passamaquoddy Bay as well as through a smaller opening to the southeast.
With a mean, semi-diurnal tidal range of 5.7 m, and spring tides in excess
of 7 m (National Oceanic and Atmospheric Administration chart 13328),
this region is characterized as macrotidal. Approximately half a cubic kilometer
of water enters and leaves with each flood or ebb tide; a half-tide
volume comparable to the discharge of the Mississippi River (Brooks et
al. 1999). The largest stream entering the estuary, the Dennys River (Fig.
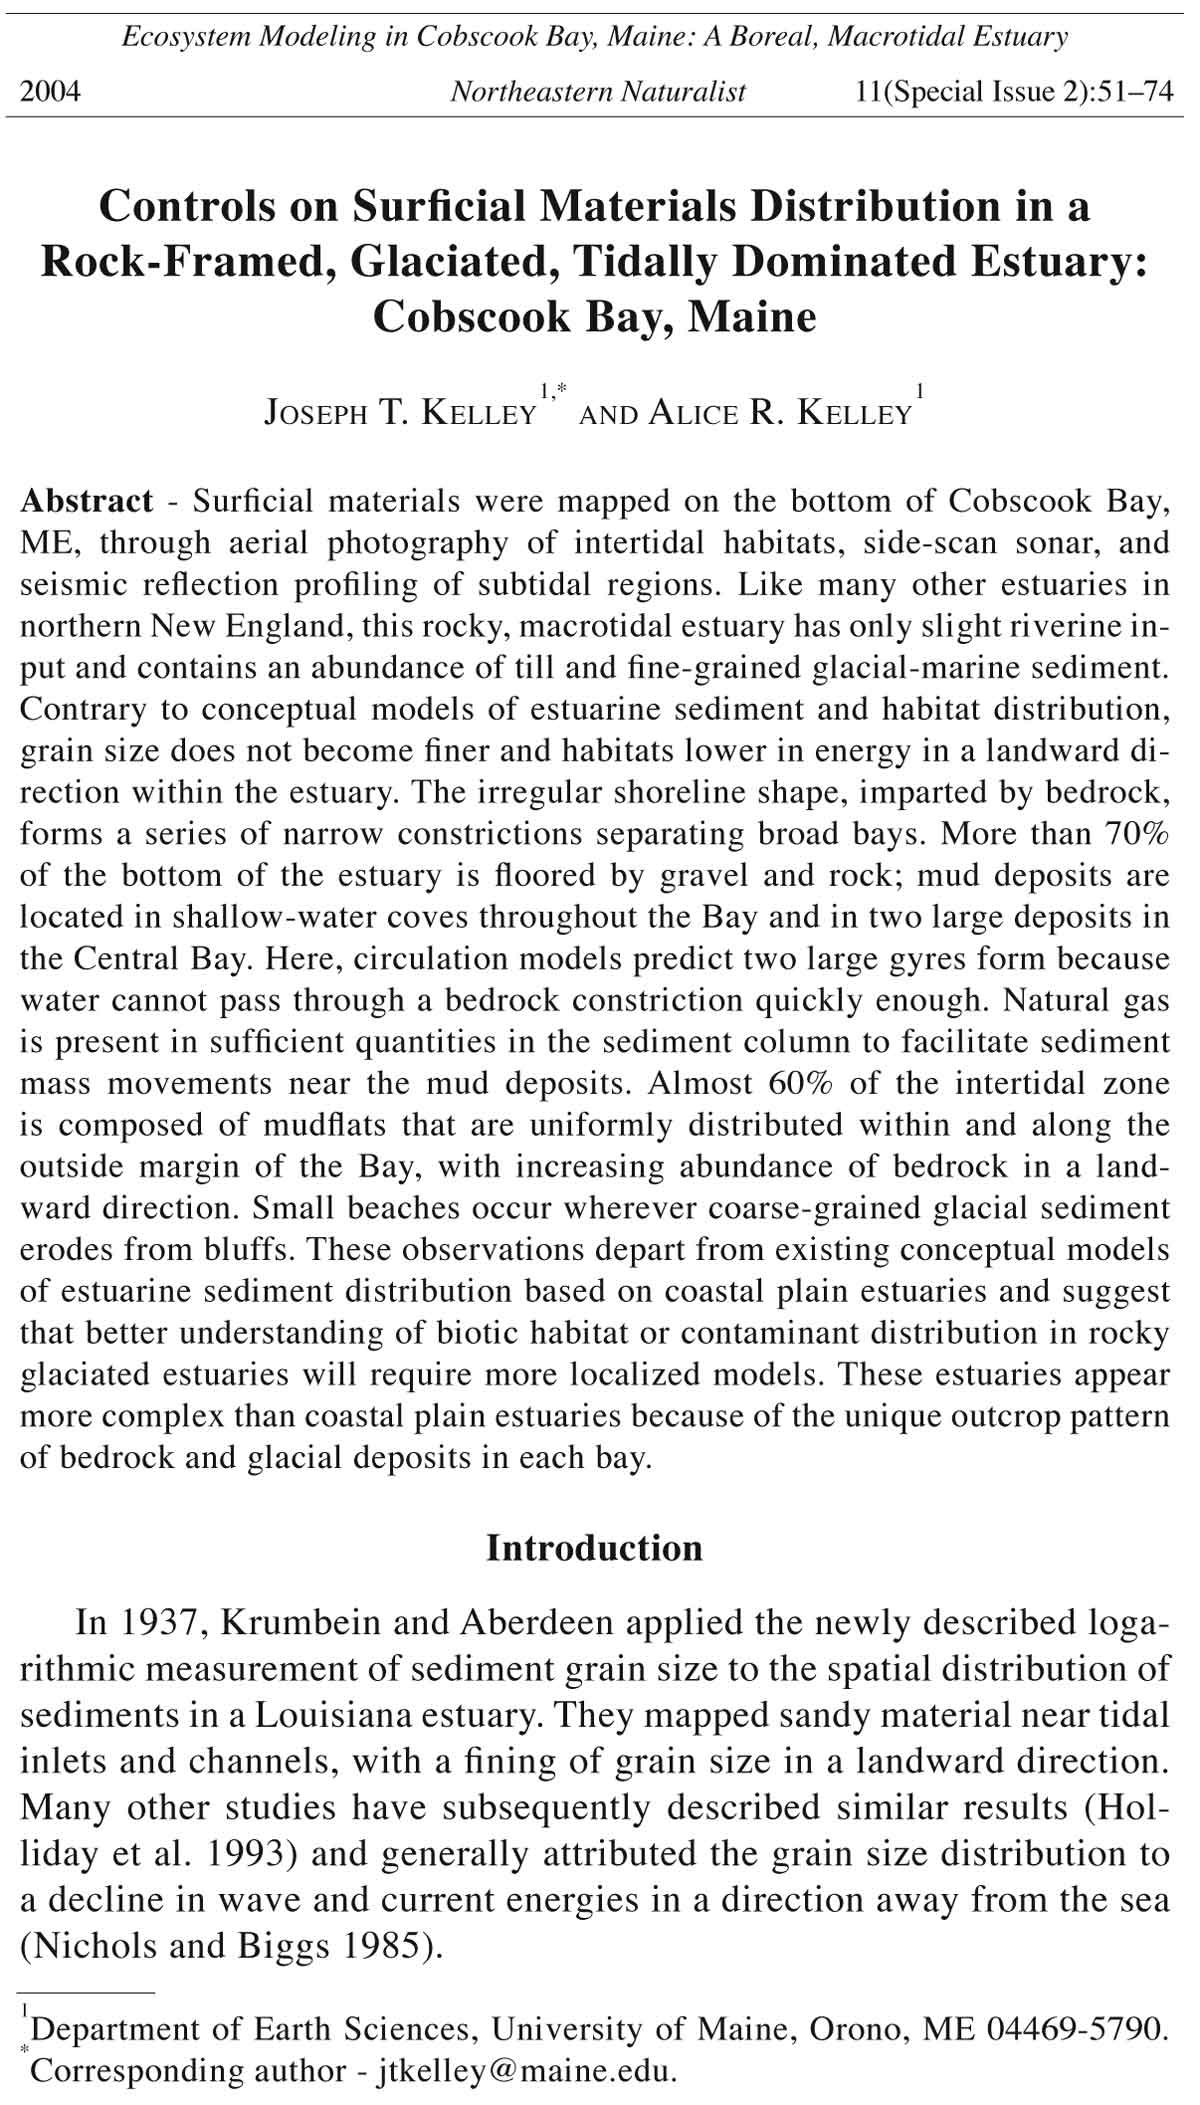
Figure 1. Location
and bedrock geology
of the Cobscook Bay
region within the Gulf
of Maine. Bedrock geology
simplified from
Osberg et al. (1985).
Many other bedrock
faults shape the
smaller coves within
the estuary, but are
not shown because of
scale.
Gulf of Maine
54 Northeastern Naturalist Vol. 11, Special Issue 2
2), has an estimated maximum discharge of only 8 m3/sec, and represents
less than 1% of the intertidal volume (Brooks et al. 1999). The second largest
stream, the Pennemaquan (Fig. 2), is about 45% the size of the Dennys
(Brooks et al. 1999).
The irregular outline of the Cobscook Bay region is shaped by Paleozoic
bedrock lithology and structure (Osberg et al. 1985). The relatively
straight outer Atlantic shoreline is formed by a fault zone separating
much younger Mesozoic sedimentary rocks of the Bay of Fundy from
the older rocks of Maine (Kelley 1987). The weakly metamorphosed
volcanic, volcanic-sedimentary, and sedimentary rocks of Cobscook
Bay form a plunging anticline (Bastin and Williams 1914). Anticlinal
limbs composed of erosion-resistant volcanic rocks of the Easport, Edmunds,
Leighton, and Hersey Formations form separate peninsulas; the
easily eroded sedimentary rocks of the Perry Formation and fault zones
within the volcanic rocks, occupy the bays (Fig. 1).
Glacial-marine sediment is mapped along more than 50% of the Bay
shoreline (Thompson and Borns 1985). This generally muddy sediment
was deposited during deglaciation, approximately 14 ka (thousands of
years ago), when the isostatically depressed land was inundated by the
sea (Belknap et al. 1987). Bouldery-clayey till crops out only near the
tips of Seward, Hersey, and Crow Necks (Fig. 2), and along a small part
of the Inner Bay shore. The remainder of the shoreline, approximately
40%, has < 1 meter of glacial sediment (Thompson and Borns 1985).
Figure 2. Bathymetry and location of place names cited in text. The inner, central
and outer areas of the Bay are indicated by arrows.
2004 J.T. Kelley and A.R. Kelley 55
The sea-level history of the area includes the late-glacial drowning
until about 11.5 ka, followed by emergence to a sea-level lowstand at
55 m depth around 10.5 ka (Barnhardt et al. 1995). At the time of the
lowstand of sea level, the bathymetric depressions forming much of
Cobscook Bay today were probably occupied by lakes, just as lakes are
common features inland from the present coast (Thompson and Borns
1985). Sea level has risen at varying rates since the lowstand, and is rising
from 2–3 mm/yr today (Aubrey and Emery 1991).
The bathymetry of the Bay is locally very uneven, but becomes
generally shallower from sea to land and towards the smaller bay
margins (Fig. 2). The Outer Bay channel averages about 30 m deep
at mean low water (MLW), with a maximum depth of 45 m in several
places. The Central Bay reaches a maximum depth of 30 m (MLW) in
the channel, but the remaining area averages about 10 m depth. The Inner
Bay reaches a maximum depth of 10 m (MLW) at the entry place of
the main channel, but is mostly less than 6 m deep. Uncharted bedrock
shoals with more than 10 m of bathymetric relief abound throughout
the Bay.
For this paper, the area of the Bay that is under study includes the outer
shoreline of the Bay from Eastport to the northwest where the peninsula
joins with the mainland. This is done because a comparison is made below
with models of estuarine sediment distribution that also include the land
that frames the outer areas of estuaries. Thus, for this paper, about 41.5
km2 of intertidal flats are mapped, compared with 37.2 km2 measured
solely within the Bay by Larsen et al. (2004). This is a large proportion of
a total high water Bay area of 111 km2 (Larsen et al. 2004).
Tidal circulation was evaluated with a three-dimensional numerical
model supported by field observations (Brooks et al. 1999). At times
of peak flow, both ebb and flood tidal currents approaching 2 m/s were
modeled from the Bay entrance throughout the main channels, with
declining velocities toward each of the Bay margins (Fig. 3). Notable
features suggested by the model are gyres to either side of the main
channel in the Central Bay (Fig. 3c,d) that seem to be confirmed by
satellite imagery (Larsen et al. 2004). These form during the flood tide
because the inflow cannot be accommodated by the narrow bedrock
constriction leading to the Inner Bay (Fig. 3). Extreme turbulence, with
many small eddies and standing waves, exist within and adjacent to the
areas of bedrock constriction.
Methods
Intertidal environments (all units were greater than 150 m2), mapped
from 1960s low-tide aerial photographs (Timson 1976), were digitized
in a geographic information system (GIS) to a 1:24,000 scale (Ward
56 Northeastern Naturalist Vol. 11, Special Issue 2
Figure 3. a) Overall
circulation model
for Cobscook Bay
near peak ebb flow.
b) Note strongest
currents are located
along the main channel
axis in the Outer
and Central Bays,
and decline greatly
to the margins and
in the Inner Bay; c)
Overall circulation
model for Cobscook
Bay near peak flood
flow. d) Note the
gyres that are modeled
to either side of
the “reversing falls”.
a
b
1999) and evaluated using a GIS. Because this study is concerned with
the zonation of environments from the outermost to inner parts of the
estuary, areas along the eastern edge of the peninsula on which Eastport
Currents after 5 Hours
Currents after 5 Hours
Kilometers Kilometers
Kilometers
Kilometers
2004 J.T. Kelley and A.R. Kelley 57
c
d
58 Northeastern Naturalist Vol. 11, Special Issue 2
rests were included in area estimates. Thus, areas are greater in extent
than listed by Larsen et al. (2004).
Subtidal habitats were imaged with an EG&G SMS 260 slant-range
corrected side-scan sonar in 1994 and 1998. The swath area was 200 m
(100 m range) over most of the Bay; in areas deeper than 35 m, a 300 m
swath (150 m range) was used. Data were interpreted on the basis of the
strength of the acoustic return (relative darkness on the analogue record
at a constant gain setting) and morphology of the seafloor (bedrock fractures,
ripples, boulders, etc.). In this way, bedrock, gravel, sand, and mud
were distinguished (Barnhardt et al. 1998, Kelley et al. 1998). In areas of
complex seafloor in which two of the four seafloor types occurred over a
small area (< 10,000 m2), the more abundant surficial material was mapped
as dominant (“rock with gravel” means rock more abundant than gravel
and “mud with rock” means mud more abundant than rock; Barnhardt et
al. 1998). Ten bottom samples were collected with a Smith-McIntyre grab
sampler to verify the side-scan sonar interpretations.
About 70 km of 3.5-kHz seismic reflection profiles were gathered
in 1984 (Kelley et al. 1989). These records imaged through all surficial
materials to bedrock, except where thick till or natural gas occurred. The
nature of surficial material was interpreted on the basis of the strength
of the surface acoustic return in the seismic record and its morphology
and context (Barnhardt et al. 1998, Kelley et al. 1998).
Navigation was by LORAN-C during collection of the seismic records,
and by DGPS for the side-scan sonar and bottom samples. The
LORAN data was converted to Latitude/Longitude with LORCON
(Barnhardt et al. 1998). All data were compiled in a GIS for computation
of areas and map production.
Results
Outer Bay
Covering almost 90% of the seafloor (Table 1), a gravel bottom dominates
the subtidal area of the Outer Bay, with subordinate rock and sand
cropping out locally (Fig. 4). Seismic records trace bedrock outcrops
from the intertidal zone into the shallow subtidal region where rock
is overlain by till and glacial-marine sediment. The truncated acoustic
reflectors of the glacial-marine sediment and the outcropping patch of
till suggest a hard and eroding bottom, as do accompanying side-scan
sonar images (Fig. 5a, b). Lineations from upper right to lower left in
Fig. 5a represent re-working of coarse-grained sediment by strong tidal
currents. Sand and gravel were gathered in bottom samples just north
of this area in a similar setting (Lehmann 1991). Exposed bedrock and
boulders form the slope along the Eastport side of the channel (Fig. 5a).
Farther within the Bay, the gravel bottom is interrupted only by occa2004
J.T. Kelley and A.R. Kelley 59
sional bedrock outcrops (Fig. 4b). Bedrock relief in the subsurface, in
excess of 30 m over horizontal distances of several hundred meters, was
commonly observed.
Mud is mapped only in a cove sheltered from waves by islands and
shoals in the southern part of the Outer Bay (Figs. 2, 4b). Fishing drag
marks are well preserved in the mud, which abruptly changes to gravel
on its seaward border. A large, shallow unmapped area in the northeast
part of the Outer Bay is also very sheltered, and probably contains
muddy sediment, too. Rock and gravel also appear around the scoured
fringe of a small island in the Southern Bay (Fig. 4b).
The intertidal zone of the Outer Bay is dominated by extensive mud
flats (53.5%), punctuated with many small bedrock outcrops (16.7%;
Fig. 4b, Table 1). Sand and gravel pocket beaches (19.8%) and gravel
flats (6.2%) are common ( Table 1) between rock outcrops where bluffs
of till are eroding along the Bay margin. Marshes exist along small
stream mouths in protected coves.
Central Bay
The Central Bay is connected to the Outer and Inner Bays by narrow
bedrock constrictions to the northeast and southwest, respectively
(Figs. 4a, 6a). Subtidal environments in these constrictions, along with
adjacent regions in which strong currents flow, are dominated by gravel
(54%, Table 1; Figs. 7a, 8). Bedrock outcrops are relatively rare (< 2%)
(Fig. 6a). Where glacial sediment is abundant, as on Birch Point and
Seward Necks, bedforms of sand and gravel occur on the bottom (Figs.
4, 8). These appear to represent reworking of underlying till. The tip
of Birch Point contains a double tombolo, derived from the same till
Table 1. Areas of intertidal and subtidal regions. Note that these values differ from Larsen
et al. (2004) because they include the eastern edge of the outermost peninsula as well as
that peninsula’s western shore.
Inner Central Outer
(km2) (%) (km2) (%) (km2) (%)
Intertidal habitats
Beach 0.40 3.3 1.49 8.3 2.28 19.8
Mudflats 6.77 56.0 10.73 60.0 6.15 53.5
Gravel flat 0.14 1.1 0.76 4.2 0.72 6.2
Bedrock 3.74 31.0 3.82 21.4 1.92 16.7
Marsh 1.02 8.5 1.09 6.1 0.29 2.5
Artificial 0.01 0.1 0.005 0.0 0.15 1.3
Total 12.08 17.89 11.51
Subtidal habitats
Bedrock 0.12 2.1 0.26 1.3 1.50 7.2
Gravel 4.85 82.8 11.00 54.0 18.88 89.7
Mud 0.89 12.9 9.09 44.7 0.66 3.1
Total 5.86 20.35 21.04
60 Northeastern Naturalist Vol. 11, Special Issue 2
a Cobscook Bay Intertidal and Subtidal Environments
deposit, that is the largest beach in the estuary (Duffy et al. 1989). In
the very narrow passages into the Inner Bay, currents in excess of 2 m/
sec (Brooks et al. 1999) have removed all sediment finer than cobbles
(Fig. 9). Boulders up to 7 m in diameter are exposed on the seafloor and
bedrock outcrops up to 15 m in relief impede the tidal flow. Although extreme
turbulence (whirlpools, standing waves) made seismic reflection
records difficult to interpret, not much sand-sized and finer Quaternary
sediment remains in these areas.
Toward the middle and marginal reaches of the Central Bay, large
deposits of mud and mixed mud and gravel occupy 44.7% of the Bay
bottom. As in the Outer Bay, the transition from gravel to mud is abrupt
(Fig. 10). Unlike those in the Outer Bay, however, the Central Bay
mud deposits are not sheltered by islands. Drag marks from fishing
gear completely mark the muddy areas, but largely disappear in gravel
sediment. The gravel bottom is several meters deeper than the adjacent
mud in most places, and is up to 5 m deeper near bedrock outcrops. This
observation implies non-deposition of mud in gravel areas, or scouring
2004 J.T. Kelley and A.R. Kelley 61
Figure 4 (opposite page and above). a) Surficial geology map for Cobscook Bay.
Boxes are areas shown in detail in Figures 4b and 6a,b. Map units are shown
in Figure 4b. b) Surficial geology map for outer Cobscook Bay. Labeled boxes
and line are shown in other Figures. Location of map in relation to entire Bay
is shown in Figure 4a.
b Outer Bay Intertidal and Subtidal Environments
62 Northeastern Naturalist Vol. 11, Special Issue 2
Figure 5. a) Side-scan sonar line CC98-1. The strong (dark) acoustic reflectance
on this image indicates a hard gravel-dominated bottom. Bedrock crops out in
the upper part of the image, with boulders at the base of the slope. See Figure
5b for seismic reflection record CC84-10 crossing this image. b) Seismic reflection
line CC84-10. This profile extends from Eastport, ME, to Campobello,
NB (modified from Kelley et al.1989). On this and other seismic records, Br is
interpreted as bedrock, T as till, and Gm as glacial-marine sediment. The dark
surface return and truncated acoustic reflectors suggest a sand/gravel lag deposit
developed on eroding beds of the till and glacial marine sediment. The area imaged
by side-scan sonar in Figure 5a is located at the top of the record.
b
a
2004 J.T. Kelley and A.R. Kelley 63
of overlying mud deposits. A grab sample from a transition area between
gravel and mud yielded a very poorly sorted mud-cobble mixture (Fig.
7b). This was from an area dragged for scallops.
A seismic line across the Central Bay shows the rapid change from
mud to gravel near the axial channel (Fig. 11). The mud is acoustically
transparent (light) with a weak surface return. A reflector, interpreted as
natural gas, occurs about 5 m below the seafloor and obscures all lower
acoustic reflectors. The irregular margin of the axial channel is interpreted
as slumping blocks of muddy sediment. Denser till, with a strong
surface return, covers the seafloor near an island.
The intertidal environments of the Central Bay are dominated
by mud flats (60%). Bedrock is almost ubiquitous along the shoreline
(Fig. 6a), but the steepness of the rock limits its areal exposure
to 21.4% of the intertidal zone (Table 1). Coarse-grained beaches
(8.3%) and gravel flats (4.2%) occur where erosion has reworked till
deposits. Marshes fringe the shoreline in protected coves in the uppermost
margins of the Bay, especially in the coves between Denbow
and Crow Necks (Figs. 4, 6a).
Inner Bay
Gravel covers most of the channel area of the Inner Bay and comprises
82.8% of the mapped subtidal area (Fig. 6b, Table 1). Much more
of the gravel is associated with small mud and rock outcrops (Fig. 12)
than in other sections of the Bay (Table 1). Mud covers much of the upper
reaches of the Bay. Large areas of relatively shallow water may also
contain numerous small mud pockets between rock and gravel outcrops,
but these areas were too hazardous to permit complete mapping. Rock
or gravel projects through surficial mud in many places, and the contact
between mud and gravel is very irregular.
The intertidal region of the Inner Bay is occupied mostly by mudflats
(56%), although bedrock comprises 31% of the area (Table 1). In
addition to a fringe of bedrock along the shoreline, rock also occurs
as many small, discrete environments throughout the intertidal zone.
Gravel flats and generally gravel beaches are of minor spatial extent,
but marshes comprise almost 9% of the Inner Bay intertidal zone
(Table 1). Some of the marshes are probably freshwater wetlands
contiguous with salt marsh (Ward 1999).
Discussion
Estuaries in rocky, glaciated landscapes may differ greatly from
generalized estuarine models in their sediment facies patterns. Irregular
bedrock outcrops are a major feature that distinguishes these estuaries
from existing models. First, bedrock structure and compostion control
the overall shape of the estuary (Fig. 1). Cobscook Bay clearly reveals a
64 Northeastern Naturalist Vol. 11, Special Issue 2
Figure 6 (above and upper opposite page). a)Surficial geology map for central
Cobscook Bay. Labeled boxes and line are shown in other Figures. Location of map
in relation to entire Bay and map units are shown in Figure 4a. b) Surficial geology
map for inner Cobscook Bay. Labeled boxes and line are shown in other Figures.
Location of map in relation to entire Bay and map units are shown in Figure 4a.
a
Central Bay Intertidal and Subtidal
Environments
2004 J.T. Kelley and A.R. Kelley 65
b Inner Bay Intertidal and Subtidal Environments
Figure 7 a) Photograph of gravel-size sediment collected from Cobscook Bay.
The cobbles range from 3–10 cm in nominal diameter and are coated with pink
encrusting algae. Sample is located in Figure 4b. b) Photograph of mixed mud
and gravel sediment. Sample is located in Figure 6a.
66 Northeastern Naturalist Vol. 11, Special Issue 2
folded rock structure that descends into the earth (a plunging anticline)
through its many peninsulas and bays (Fig. 1). Weaker rock formations
were preferentially eroded away by glacial and other weathering processes
to leave bays, with more erosion-resistant formations comprising
Figure 8. Side-scan
sonar line CC98-
10. Bedforms with
a spacing of 5–10
m and up to 50 m in
length are developed
from till deposits
near Birch and
Seward Points. The
very strong acoustic
return (dark) indicates
that the seabed
is all gravel.
Figure 9. Side-scan
sonar line CC98-4.
Bedrock and gravel
form the seafloor in
this image of a narrow
channel. The bathymetric
trace beneath
the towfish track depicts
more than 15
m of relief across a
rock pinnacle. Light
areas are in acoustic
shadows behind rock
pinnacles.
2004 J.T. Kelley and A.R. Kelley 67
peninsulas. Bedrock faults have also led to cove formation by imparting
a weakness to the rocks through which they pass. Within the Bay, individual
rock types exhibit differing outcrop patterns. For example, more
bedrock crops out in the intertidal area of the Inner Bay than elsewhere
Figure 10. Side-scan
sonar line CC98-9.
The transition from
gravel (dark) to mud
(light) occurs across
a distance less than
100 m. Drag marks
are more apparent in
the mud than in the
gravel.
Figure 11.
Seismic line
CC84-35. Br
is interpreted
as bedrock.
Slump blocks
are interpreted
where the
mud deposit
abuts the
Central Bay
channel.
Figure 12. Side scan
sonar line 98-8. This
is a typical area along
the Inner Bay where
small bodies of rock
surrounded by gravel
occur just seaward of
the intertidal zone.
Mud has collected in
areas where the rock
shelters the bottom
from strong currents.
Rock or gravel appear
to project through the
mud.
68 Northeastern Naturalist Vol. 11, Special Issue 2
(almost twice the proportion of the Outer Bay) because the Edmunds
Formation (Fig. 1) only occurs in the Inner Bay. This formation is apparently
locally variable in its resistance to erosion.
Bedrock structure also manifests its influence in controlling tidal
current velocities. At rock constrictions like Birch Point and Denbow
Neck, tidal currents are accelerated and made more turbulent by the
narrow channel width and irregular bottom (Fig. 9; Brooks 2004). This
creates areas of non-deposition or erosion of all but the largest boulders.
Bedforms were only observed on the bottom near bedrock constrictions,
where scour depressions were observed as well (Fig. 8).
Finally, even in sheltered areas where mud does accumulate, rock
outcrops exist and are always surrounded by “halos” of gravel at the
base of outcrops. Where directly observed elsewhere, the gravel consists
of angular rock fragments eroded from the outcrop and/or shells from
formerly attached organisms (Kelley et al. 1998).
In addition to bedrock, glacial processes and deposits may significantly affect sedimentary facies in estuaries. Glaciated regions have
typically experienced drainage derangement owing to sediment filling
of pre-glacial valleys (Kelley et al. 1986). Thus, large, rock-framed embayments
that may have been cut by a river in pre-glacial time, often do
not possess significant river input today. It is not clear what river was
once associated with Cobscook Bay, perhaps the St Croix, which passes
over waterfalls before abruptly entering Oak Bay 25 km to the north.
Clearly the Dennys and Pennamaquan Rivers are “underfit” streams
in the sense that they are disproportionately small for the size of their
estuary. As a result, their discharge is too slight to significantly modify
the circulation of Cobscook Bay (Brooks et al. 1999), and there is no
difference between sediments near river mouths and in the many other
small coves in the Bay located far from fluvial influence. The largest salt
marshes, for example, are associated with even smaller streams to either
side of Denbow Neck (Figs. 4a, 6a).
The lack of significant river-sediment input accentuates another
distinguishing feature of glaciated estuaries in general and Cobscook
Bay in particular: the sediment contribution from reworked glacigenic
material. In Cobscook Bay, till crops out between bedrock exposures
along the shoreline and in many places on the seabed (Fig. 5a).
Erosion of till results in localized sand and gravel beaches, gravel
flats, and a gravel seabed. Though more beaches occur in the Outer
Bay than in the Inner, the difference is less than suggested by models
(Dalrymple et al. 1992). In subtidal areas, gravel is the most abundant
seafloor material in each arm of the Bay (Table 1, Fig. 13). Where
boulders are common on the seafloor (Figs. 5a, 9), and in gravel “halos”
surrounding outcrops of bedrock, overlying sediment has been
removed (Fig. 12), and till is exposed at the surface. Over much of
2004 J.T. Kelley and A.R. Kelley 69
the Bay, however, glacial-marine sediment crops out on or very near
the seafloor (Figs. 5 and 7). This material is generally muddy, and the
overlying gravel may be a lag deposit winnowed from coarser components
of the glacial-marine sediment, such as dropstones and other
ice-rafted debris (Belknap and Shipp 1991). Alternatively, gravel that
overlies glacial-marine mud may represent a winnowed stream deposit
that formed during the lowstand of the sea or components of till
redistributed by tidal currents.
The general lack of sandy sediment precludes the formation of largescale
barrier beaches and associated environments. Beaches within this
fetch-restricted bay occur only where coarse-grained glacial deposits
crop out on the shoreline. Large sandy bedforms are also absent in subtidal
regions. Instead, only small bedforms are observed in areas where
Figure 13. Relative abundance of intertidal (top) and subtidal (bottom) environments
in Cobscook Bay, ME. Data are from Table 1.
Cobscook Bay Habitat Area
70 Northeastern Naturalist Vol. 11, Special Issue 2
coarse-grained glacial sediment occurs and currents are strengthened by
bedrock constrictions (Fig. 9).
Mud deposits are not restricted to the most landward reach of the estuary.
Each sub-bay’s landward margin is generally muddy, but the most
extensive mud deposit is associated with a current gyre in the middle
of the Central Bay (Figs. 3, 6a). The mud presumably accumulates as a
result of sedimentation during the prolonged residence time in the gyre.
The excellent spatial correlation between the modeled gyre and the distribution
of mud in the Bay indicates the great utility of the numerical
model in understanding and predicting the movement of sediment and
contaminants in formerly glaciated embayments.
Organic matter is a component of the Central Bay mud deposit.
Microbial breakdown of the organic matter results in the generation
of methane, which was observed in the shallow subsurface. Although
this may be “modern” gas derived from late Holocene mud, it is possibly
gas derived from older organic matter. At the time of lowerthan-
present sea level, the Central Bay possibly existed as a lake or
wetland basin. In this scenario, the older terrestrial carbon, existing in
deposits below and obscured by the gas bubbles, is the source of the
methane. Whatever its source, the gas has reduced sediment strength
and led to sediment failure along the channel margins (Fig. 11), as in
other Maine estuaries (Barnhardt and Kelley 1995; Kelley et al. 1989,
1994, 1998).
Because “spoils” from aquaculture facilities are relatively fine
grained, this material probably accumulates with the mud and organic-
rich sediments of the Bay. Thus, instead of becoming focused
strictly at the landward reaches of the Inner Bay, as suggested by
models (Dalrymple et al. 1992), material introduced by aquaculture
facilities may largely become concentrated in the muddy basins of
the Central Bay.
Conclusions
Existing conceptual models are of limited usefulness in understanding
and predicting the spatial distribution of sediments, contaminants,
and habitats in rocky, formerly glaciated estuaries. Bedrock plays a
complex role that controls the overall shape of the estuary, thereby dictating
the spatial distribution of current velocities. Sediment grain size
is strongly influenced by the distribution of currents, but is further affected
by the inherited, patchy distribution of older glacial deposits. In
Cobscook Bay, gravel beaches occur wherever till erodes, but mudflats
dominate the overall intertidal region because of the widespread occurrence
of glacial-marine muddy sediment. Cobscook Bay, and many
2004 J.T. Kelley and A.R. Kelley 71
other similar estuaries, lacks significant freshwater input compared to
its tidal prism, and receives minimal river-sediment input to its landward
reaches. This results in a well-mixed estuary with no concentration
of sediment near river mouths. Lack of “new” river-sediment enhances
widespread cannabilization of glacial materials across the relict
seabed. Finally, natural gas is associated with thick mud deposits in
Cobscook Bay and in estuaries throughout northeastern North America
(Fader 1991; Kelley et al. 1989, 1994; Barnhardt and Kelley 1995).
Gas reduces sediment strength and leads to mass movements where
slopes are relatively steep (Fig. 11). This gas may be derived from
microbial breakdown of modern organic matter or from older, buried
terrestrial organic matter dating from times of lower sea level.
If particulate organic matter from aquaculture facilities in Cobscook
Bay is retained within the Bay, it is not simply accumulating in
the most landward reaches of the estuary. The organic matter is probably
accumulating with mud in the shallow subtidal regions and on
tidal flats in coves throughout the Bay, and in the mud deposits of the
Central Bay.
Acknowledgments
We acknowledge support for this research from the Maine Chapter of The
Nature Conservancy, and are particularly grateful for assistance from Mr. Jim
Dow. The earlier seismic work was supported by a grant from the US Nuclear
Commission to the Maine Geological Survey.
Literature Cited
Aubrey, D.G., and K.O. Emery. 1991. Sea Levels, Land Levels and Tide Gauges.
Springer-Verlag, New York, NY. 237 pp.
Barnhardt, W.A., and J.T. Kelley. 1995. Carbonate accumulation on the inner
continental shelf of Maine: A modern consequence of late Quaternary glaciation
and sea-level change. Journal of Sedimentary Research A65:195–207.
Barnhardt, W.A., W.R. Gehrels, D.F. Belknap, and J.T. Kelley. 1995. Late Quaternary
relative sea-level change in the western Gulf of Maine: Evidence for
a migrating glacial forebulge. Geology 23:317–320.
Barnhardt, W.A., J.T. Kelley, S.M. Dickson, and D.F. Belknap. 1998. Mapping
the Gulf of Maine with side-scan sonar: A new bottom-type classification for
complex seafloors. Journal of Coastal Research 14:646–659.
Bastin, E.S., and H.S. Williams. 1914. Geologic Atlas of the United States:
Eastport Folio. US Geological Survey, Reston, VA.
Belknap, D.F., and R.C. Shipp. 1991. Seismic stratigraphy of glacial-marine
units, Maine inner shelf. Pp. 137–157, In J.B. Anderson and G.M. Ashley
(Eds.). Glacial-Marine Sedimentation: Paleoclimatic Sigificance. Geological
Society of America, Denver, CO, Special Paper 261.
72 Northeastern Naturalist Vol. 11, Special Issue 2
Belknap, D.F., B.G. Andersen, R.S. Andersen, W.A. Anderson, H.W. Borns,
G.W. Jacobsen, J.T. Kelley, R.C. Shipp, D.C. Smith, R. Struckenrath, W.B.
Thompson, and D.A. Tyler. 1987. Late Quaternary sea-level changes in
Maine. Pp. 71–85, In D. Nummedal, O.H. Pilkey, Jr., and J.D. Howard,
(Eds.). Sea Level Rise and Coastal Evolution. SEPM Publication 41. Society
of Economic Paleontologists and Mineralogists, Tulsa, OK.
Belknap, D.F., J.C. Kraft, and R.K. Dunn. 1994. Transgressive valley-fill lithosomes:
Delaware and Maine. Pp. 303–320, In R. Boyd and R.W. Dalrymple
(Eds.). Incised Valley Systems: Origin and Sedimentary Sequences. SEPM
Special Publication 51. Society of Economic Paleontologists and Mineralogists,
Tulsa, OK.
Brooks, D.A., M.W. Baca, and Y.-T. Lo. 1999. Tidal circulation and residence
time in a macrotidal estuary: Cobscook Bay, Maine. Estuarine, Coastal, and
Shelf Science 49:647–665.
Brooks, D.A. 2004. Modeling tidal circulation and exchange in Cobscook Bay,
Maine. Northeastern Naturalist 11(Special Issue):23–50.
Dalrymple, R.W., B.A. Zaitlen, and R. Boyd. 1992. Estuarine facies models:
Conceptual basis and stratigraphic implications. Journal of Sedimentary
Petrology 62:1130–1146.
Department of Marine Resources. 1996. Aquaculture Lease Inventory. L.
Churchill and K. Honey (Eds.). Maine Department of Marine Resources,
West Boothbay Harbor, ME.
Dudley, R.W., V.G. Panchang, and C. Newell. 2000. Application of a comprehensive
modeling strategy for the management of net-pen aquaculture waste
transport. Aquaculture 187:319–349.
Duffy, W., D.F. Belknap, and J.T. Kelley. 1989. Morphology and stratigraphy of
small barrier-lagoon systems in Maine. Marine Geology 88:243–262.
Fader, G.B. 1991. Gas-related sedimentary features from the eastern Canadian
continental shelf. Continental Shelf Research 11:1123–1153.
Fleischer, P., T.H. Orsi, M.D. Richardson, and A.L. Anderson. 2001. Distribution
of free gas in marine sediments: A global overview. Geo-Marine Letters
21:103–122.
Gontz, A.M., D.F. Belknap, and J.T. Kelley. 2002. Seafloor features and characteristics
of the Black Ledges area, Penobscot Bay, Maine, USA. Journal of
Coastal Research, Special Issue 36:333–339.
Holliday, S.E., C.J. Klein, M. Nichols, and C. Brouwer-Riel. 1993. Surficial
Sediments in Mid-Atlantic Estuaries. National Oceanic and Atmospheric
Administration, National Estuarine Inventory, Silver Springs, MD. 70 pp.
Inman, D.L., and C.E. Nordstrom. 1971. On the tectonic and morphologic classification of coasts. The Journal of Geology 79:1–21.
Kelley, J.T. 1987. An inventory of environments and classification of Maine’s
estuarine coastline. Pp. 151–176, In P. Rosen and D. FitzGerald (Eds.). A
Treatise on Glaciated Coastlines. Academic Press, San Diego, CA.
Kelley, J.T., A.R. Kelley, D.F. Belknap, and R.C. Shipp. 1986. Variability in the
evolution of adjacent bedrock framed estuaries in Maine. Pp. 21–42, In D.A.
Wolfe (Ed.). Estuarine Variability. Academic Press, San Diego, CA.
2004 J.T. Kelley and A.R. Kelley 73
Kelley, J.T., D.F. Belknap, R.C. Shipp, and S. Miller. 1989. An investigation of
neotectonic activity in coastal Maine by seismic reflection methods. Maine
Geological Survey Bulletin 40:157–204.
Kelley, J.T., S.M. Dickson, D.F. Belknap, W.A. Barnhardt, and M. Henderson.
1994. Giant sea-bed pockmarks: Evidence for gas escape from Belfast Bay,
Maine. Geology 22:59–63.
Kelley, J.T., W.A. Barnhardt, D.F. Belknap, S.M. Dickson, and A.R. Kelley. 1998.
The seafloor revealed: The geology of Maine’s inner continental shelf. Open-
File Report 98-6. Maine Geological Survey, Augusta, ME. 55 pp.
Knebel, H.J., R.P. Signell, R.R. Rendigs, L.J. Poppe, and J.H. List. 1999.
Seafloor environments in the Long Island Sound estuarine system. Marine
Geology 155:277–318.
Krumbein, W.C., and E. Aberdeen. 1937. The sediments of Barataria Bay. Journal
of Sedimentary Petrology 7:3–17.
Larsen, P.F., and H.E. Gaudette. 1995. Spatial and temporal aspects of sedimentary
trace metal concentrations in mid-coast Maine. Marine Pollution
Bulletin 30:437–444.
Larsen, P.F., S. Barker, J. Wright, and C.B. Erickson. 2004. Use of cost effective
remote sensing to map and measure marine intertidal habitats in support of
ecosystem modeling efforts: Cobscook Bay, Maine. Northeastern Naturalist
11(Special Issue 2):225–242.
Lehmann, C. 1991. Provenance of estuarine and riverine sediments: Western
Gulf of Maine. Unpublished M.S. Thesis, University of Maine, Orono, ME.
136 pp.
McMaster, R.L. 1960. Sediments of Narragansett Bay system and Rhode Island
Sound, Rhode Island. Journal of Sedimentary Petrology 30:249–274.
Mecray, E.L., and M. Bucholtz-Ten-Brink. 2000. Contaminant distribution and
accumulation in the surface sediments of Long Island Sound. Journal of
Coastal Research 16:575–590.
Nichols, M.M., and R.B. Biggs. 1985. Estuaries. Pp. 77–186, In R.A. Davis
(Ed.). Coastal Sedimentary Environments. Springer-Verlag, New York, NY.
Osberg, P.H., A.M. Hussey, and G.M. Boone. 1985. Bedrock geologic map of
Maine, 1:500,000. Maine Geological Survey, Augusta, ME.
Roman, C.T., N. Jaworski, F.T. Short, S. Findlay, and R.S. Warren. 2000. Estuaries
of the northeastern United States: Habitat and land-use signatures.
Estuaries 23:743–764.
Sowles, J.W., and L. Churchill. 2004. Predicted nutrient enrichment by salmon
aquaculture and potential for effects in in Cobscook Bay, Maine. Northeastern
Naturalist 11(Special Issue 2):87–100.
Thompson, W.B., and H.W. Borns, Jr. 1985. Surficial geologic map of Maine,
1:500,000. Maine Geological Survey, Augusta, ME.
Timson, B.S., 1976. Coastal marine geologic environments, 1:24,000. Maine
Geological Survey. Augusta, ME.
Ward, A.E. 1999. Maine’s coastal wetlands: I. Types, distribution, rankings,
functions, and values. Maine State Department of Environmental Protection,
Augusta, ME, 113 p.
74 Northeastern Naturalist Vol. 11, Special Issue 2
Zajac, R.N., R.S. Lesis, L.J. Poppe, D.C. Twichell, J. Vozarik, and M. Digiacomo-
Cohen. 2000. Relationships between seafloor structure and benthic communities
in Long Island Sound at regional and benthoscape levels. Journal
of Coastal Research 16:627–640.


 The Northeastern Naturalist is a peer-reviewed journal that covers all aspects of natural history within northeastern North America. We welcome research articles, summary review papers, and observational notes.