Ecosystem Modeling in Cobscook Bay, Maine: A Boreal, Macrotidal Estuary
2004 Northeastern Naturalist 11(Special Issue 2):75–86
Nutrient Sources and Distributions in Cobscook Bay
CHRIS GARSIDE
1 AND JEAN C. GARSIDE
1
Abstract - The nutrient distribution in the highly productive, macrotidal Cobscook
Bay, located in the northern Gulf of Maine, was investigated through a
series of spring-neap cruises during the spring, summer, and fall of 1995. Sampling
design included three 5-station transects at major constrictions in the Bay
and 21 peripheral stations in the principal coves and sub-embayments. Results
indicate that Cobscook Bay is nutrient rich throughout the year and is potentially
eutrophic. Plots of salinity against nitrate show that this is a totally natural circumstance
brought about by an abundant supply of nutrients, most importantly
nitrate, from the adjacent Gulf of Maine. Predictive nutrient algorithms fitted
with a hydrodynamic model emphasize the high nitrate water entering the Bay
from the seaward end and diminishing in concentration with distance from the
mouth. The plant biomass produced is heavily grazed, resulting in high ammonium
concentrations from excretion and regeneration. The high ammonium
concentrations and its incomplete re-utilization by the phytoplankton strongly
suggest that plant biomass is controlled by grazing. In other words, despite a
high natural nutrient loading, natural grazing processes serve to limit the accumulation
of plant material and potential eutrophication. Comparing all potential
nitrogen fluxes indicates that man-made contributions are not significant
to the overall nutrient budget of Cobscook Bay, although they may have local
impacts.
Introduction
The same nutrients that are important for healthy growth of land
plants, nitrogen and phosphorous, are also essential for the growth of
marine plants. In the lighted upper portion of the sea, nitrogen may
be available for plant growth as nitrate and ammonium, sometimes referred
to as combined inorganic nitrogen. However, during the summer
months it frequently becomes exhausted while other nutrients do not, so
nitrogen is often considered the “limiting nutrient” (Ryther and Dunstan
1971). By limiting we mean that adding more nitrate or ammonium will
cause an increase in plant growth rate and quantity (biomass), whereas
adding other nutrients will cause little response. For this reason, in
marine systems, study of combined inorganic nitrogen can tell us a lot
about the health and productivity of a water body.
There is often a great deal of public concern about nutrients in both
fresh and saltwater. They are, however, essential for marine life and
1Bigelow Laboratory for Ocean Sciences, PO Box 475, West Boothbay Harbor,
ME 04575. Note: authors are deceased—direct all correspondence to Peter Larsen
at plarsen@bigelow.org.
76 Northeastern Naturalist Vol. 11, Special Issue 2
healthy productive waters. Virtually all life in the oceans depends on a
supply of nutrients to promote plant (phytoplankton and algal) growth.
Herbivorous animals depend on the plants for their nutrition and become
prey and food for larger animals. In the big picture, the amount of protein
nitrogen that can be removed from a natural system, and this applies collectively
to seaweed harvesting, shellfish digging and dragging, fishing,
migratory bird feeding, and a host of other activities, cannot exceed the
supply of combined inorganic nitrogen to it without depletion and ultimately
detriment. Some of the most productive fisheries in the world are
found in regions that have high natural rates of nutrient supply and high
nutrient concentrations. The anchovy and similar fisheries of upwelling
regions such as the coast of Chile are good examples, where high nutrient
concentrations have direct economic value.
A frequent cause of concern when dealing with nutrients is that
they may be present in excess. When this happens plant biomass
increases dramatically and the process is called eutrophication. Eventually,
biomass may reach such high concentrations that night-time
respiration can use up all the dissolved oxygen in the water, causing
anoxia that results in mass mortality of plants and animals alike.
Generally, the problem leading to anoxic events is one of scale; that
is, there is an enormous amount of nutrient producing activity, which
is frequently human, and a limited, often inadequately flushed receiving
water to absorb the nutrients. Anoxic events are actually quite
rare and limited geographically. They can occur naturally, but they
can occur as a result of a variety of human activities. These include
sources such as collected sewage discharge (Hudson Estuary, New
York Bight), agricultural fertilizer, and animal feed that is allowed to
enter coastal waters without proper safeguard.
It is important to remember that high nutrient concentrations can be
natural, do not necessarily lead to eutrophication, and can have tremendous
ecological and economic value (Garside et al. 1978). Cobscook
Bay is such a case.
Background
We are interested in the distribution of nutrients in Cobscook Bay
because they can tell us a lot about how the Cobscook Bay ecosystem
works. Our study obtained samples from many locations within the Bay,
twice in May, twice in July, and in October and November of 1995. We
chose these sample times to allow us to observe the start of the growing
season for marine plants, its peak in the summer, and its decline in the
fall. We hoped to see the nutrient distributions before plants started to
use them, as they consumed them, when they were most utilized, and
then as use declined and ceased.
2004 C. Garside and J.C. Garside 77
One problem with studying a region like Cobscook Bay is that a
large volume of water moves in and out of the Bay on each tide on
extremely strong currents. Indeed, tidal currents reach 2 m/sec as a
volume equal to the outflow of the Mississippi River passes through the
narrow passages of Cobscook Bay on each ebb and flood tide (Brooks
et al. 1999). A sample taken at a particular location half an hour ago
came from water that is now miles away, and a sample taken from the
same location now is from water that was elsewhere when the previous
sample was taken. It too will be far away half an hour from now, and all
the time water is mixing and changing as a result. In other words, trying
to relate nutrient concentrations to geographical locations is not very
meaningful unless we could sample all locations at the same moment,
which is not possible. What we often do in estuaries is relate nutrient
and other distributions to salt content, or salinity, which varies from 0
at the river inflow to 32–33 ppt in the coastal sea. Mixing of fresh and
seawater in the estuary provides waters with a range of salinities and
related properties in between (Ketchum 1955). Instead of plotting measurements
against geographical location or mile point along the estuary,
we plot graphs of the measurements from a sample against the salinity
of the same sample.
The reason for this way of looking at things is that properties that
enter with freshwater will distribute with it, with higher concentrations
in fresher water in the Bay, and those that enter from the sea will have
higher concentrations in saltier water. In fact, if only mixing affects the
concentration of a property, then concentration should be proportional
to salinity forming a straight line between the freshwater concentrations
and the saltwater concentration on the graph (Ketchum 1951). We may
have only a general idea of where water with a particular salinity is in
the Bay at any time, depending on the tide, but we can know what its
properties such as nutrient concentration should be, and depending on
its distribution with salinity, where the property originated. Often we
find that the distribution is not proportional to salinity, which tells us
that other processes have affected concentration, either removing or
adding to what we would expect (Ketchum 1955). With nutrients, this
can tell us a lot about processes such as uptake and regeneration.
Methods
Water samples for nutrient analysis were collected through a series
of hydrographic cruises in Cobscook Bay during 1995. The three-day
cruises were centered around the extremes of the spring-neap tidal cycles
in spring (May), summer (July), and fall (October and November),
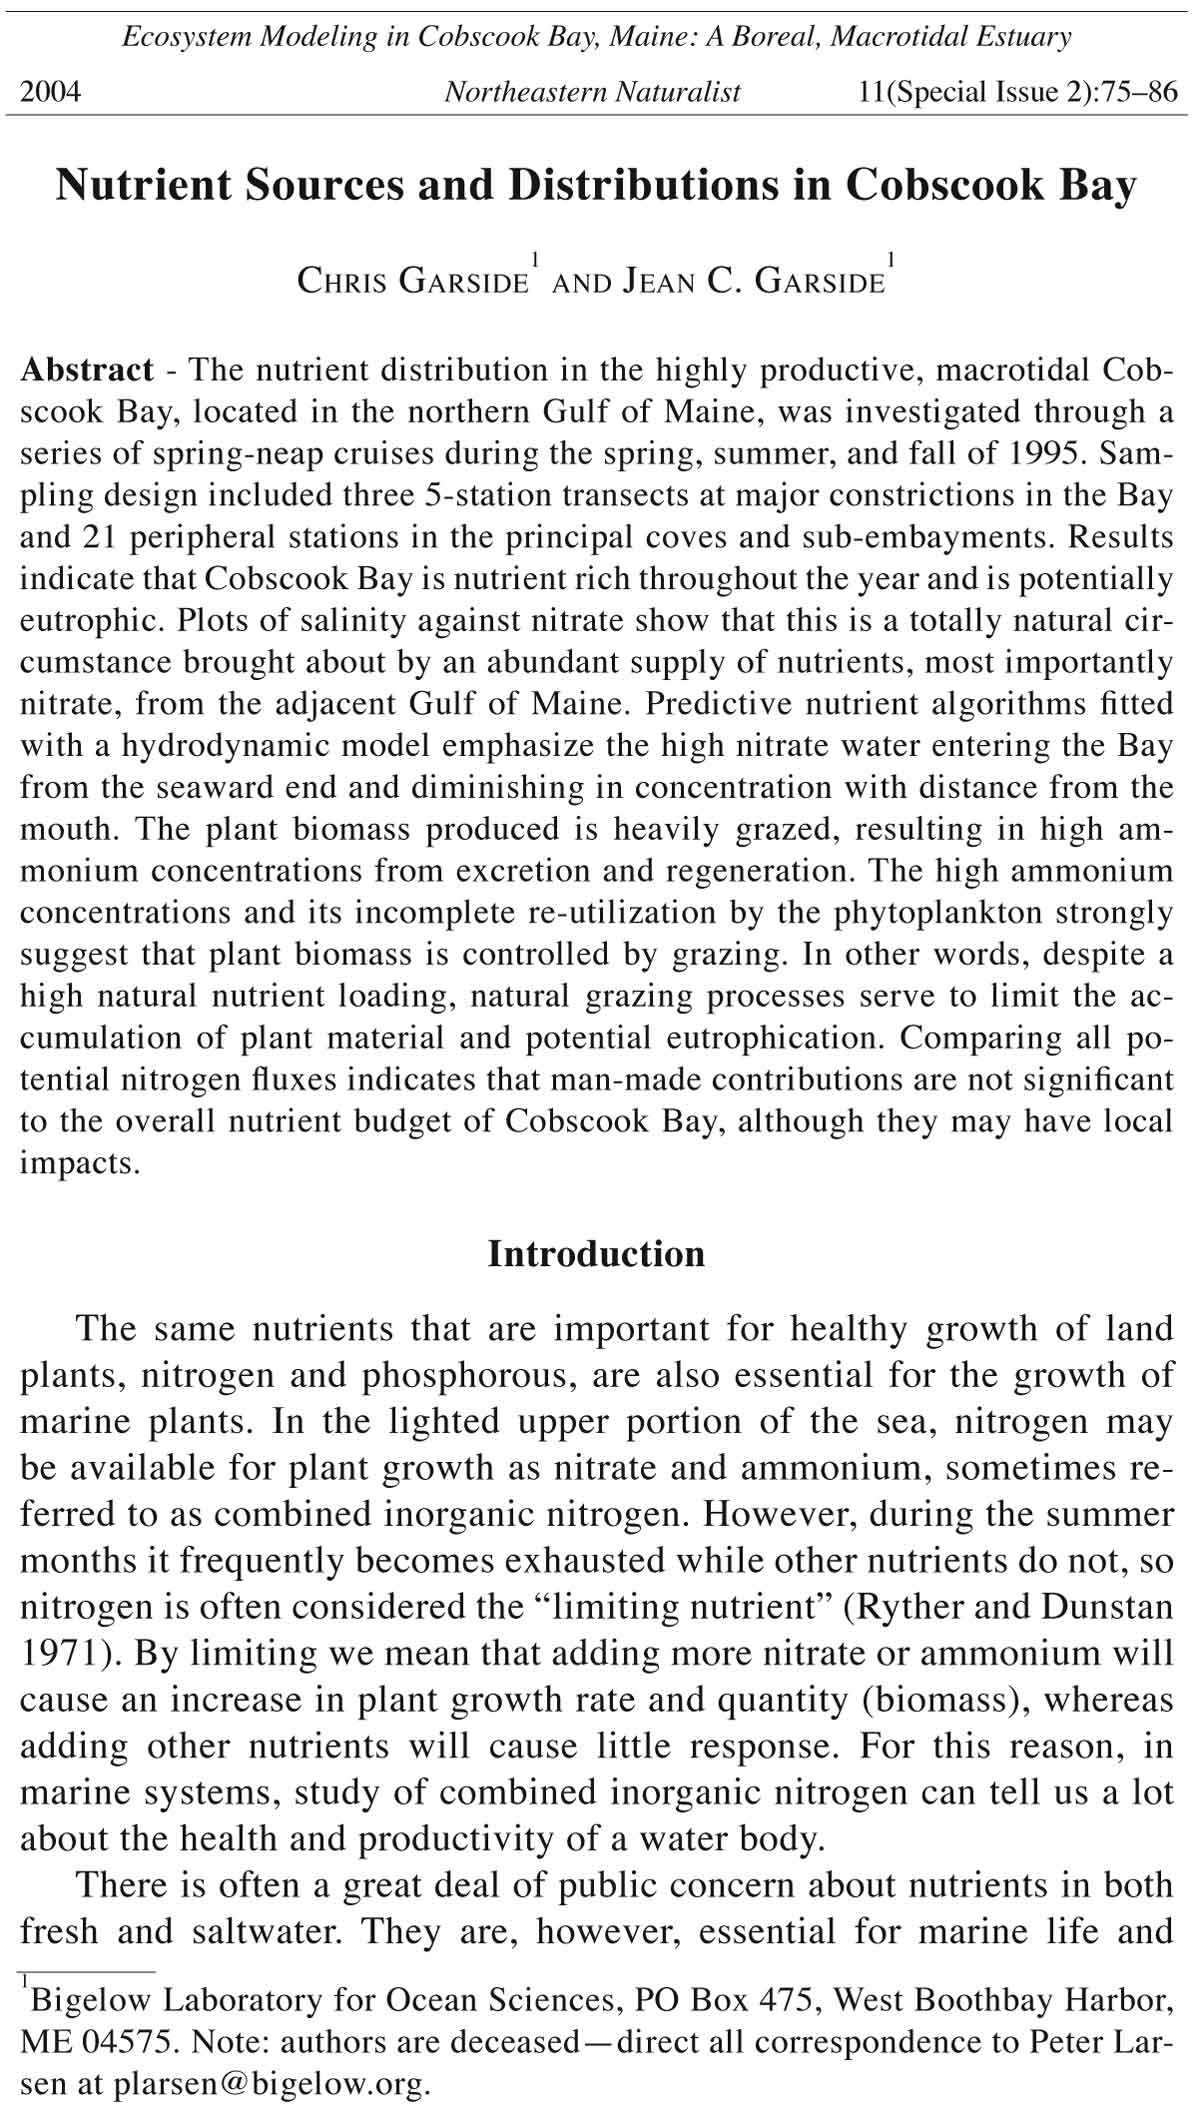
i.e., six cruises. Stations consisted of three 5-station transects across
the main flow axis of the prominent constrictions that separate Cobscook
Bay into sub-basins (Fig. 1) and 21 peripheral stations generally
78 Northeastern Naturalist Vol. 11, Special Issue 2
situated in the center of subtidal areas of the principal coves and subembayments.
The transects were sampled at high and low water in an
effort to obtain synoptic sections of physical, chemical, and biological
conditions across these constrictions. Peripheral stations were occupied
at irregular times between high and low tide. Portions of the inner
bays were inaccessible because of their shallowness. See Phinney et al.
(2004) for detailed information on station locations.
Station activities related to nutrient chemistry and the development
of the algorithm for the prediction of nutrient distribution included a
Seabird SeaCAT19 CTD profile of temperature and salinity to within
one meter of the bottom and collection of water samples using a Niskin
bottle one meter from the surface and one meter from the bottom.
Figure 1. Map of Cobscook Bay, ME, showing the locations of the principal
transects.
2004 C. Garside and J.C. Garside 79
Water samples were vacuum (10 cm Hg) filtered through Whatman
GFF glass fiber filters into 20 ml. sample vials and frozen. Samples were
thawed immediately prior to analysis at the Bigelow Laboratory. Analysis
for nitrate (and nitrite, ammonium, phosphate, and silicate) was
done on a five channel continuous flow analyzer. The continuous flow
analyzer is of our design and runs chemistries adapted from Strickland
and Parsons (1972). Although samples do not always preserve well for
some analyses, they do for nitrate, which is our principal interest here.
Precision was ± 0.05 μg-at. N l-1 (Glibert et al. 1991).
Predictive algorithms relating nitrate concentrations to the temperature/
salinity distribution were developed using the step-wise multivariate
polynomial regression techniques developed and described in
Garside and Garside (1995).
A complete table of data is available in paper and digital format in
Garside et al. (2004).
Results and Discussion
Spring and summer
Nitrate is plotted against salinity in the spring (May points marked 1
and 2) and summer (July points marked 3 and 4) (Fig. 2). There are differences
between the two distributions, which we expect, but both show
a rapid decline of nitrate with decreasing salinity. What this indicates
Figure 2. The relationship between nitrate and salinity in the spring (May points
labeled 1 and 2) and summer (July points labeled 3 and 4). Points labeled 1 and
4 represent neap tides; 2 and 3 represent spring tides.
Cobscook Bay
May–July 1995
80 Northeastern Naturalist Vol. 11, Special Issue 2
is that the source of nitrate is in waters with the highest salinity, i.e,
the seawater end. In the spring, the concentrations are generally higher
than in the summer and greater than zero because plant growth is just
starting and nitrate is not used entirely or as quickly as it is in the summer.
Salinities are lower than in the summer because freshwater run-off
is higher in the spring causing slightly more dilution of the seawater.
However, the general pattern in both cases is unequivocal evidence that
nitrate enters Cobscook Bay from the seaward end, and the distribution
is dominated by this source.
A second feature of this distribution is that in both spring and summer,
nitrate would be depleted before salinity reached zero (Fig. 2).
This further reinforces the conclusion that the ocean and not the rivers
provides the nitrate distribution in Cobscook Bay. It also tells us that
nitrate is being utilized within the Bay by plants, since if it were not,
nitrate concentrations would decline much more gradually with salinity,
reaching low values only when salinities approach zero.
There are several other lines of evidence that suggest that the coastal
sea is the source of nitrate. A much more complicated analysis of the
Figure 3. Spring nitrate distribution (in μg/l) in Cobscook Bay determined by
predictive algorithms and the three-dimensional numerical circulation model
(Brooks et al. 1999).
2004 C. Garside and J.C. Garside 81
nitrate and temperature/salinity data allow us to create equations that
can be used to predict nitrate from temperature and salinity (Garside and
Garside 1995). Since we have hydrodynamic models that can predict
the distribution of salinity and temperature (Brooks et al. 1999), these
models can also be used to describe nitrate distribution. Results (Fig. 3)
indicate high nitrate water entering the Bay from the seaward end and
diminishing in concentration into the bays and towards the rivers.
A second line of evidence can be obtained by comparing the potential
nitrogen fluxes from other candidates with the nitrate transported in and
out of the Bay on the tide each day (Table 1). These calculations show
Table 1. Comparison of potential daily tidal nitrogen fluxes, as nitrate, in and out of Cobscook
Bay each day.
Nitrate tidal exchange (5uM NO
3
source in spring)1 70.0 metric tons N per day
Nitrogen consumed by plants 40.2 metric tons N per day
(400 gCm-2y-1 over 6 months)1
Nitrogen in salmon feed (1994/5 data) 2 1.2 metric tons N per day
Total nitrogen in freshwater run-off 2 0.9 metric tons N per day
Total nitrogen in rain and dust fallout 2 0.2 metric tons N per day
Sewage nitrogen (10,000 people max.)3 0.01 metric tons N per day
1Data from this study.
2Data provided by Dan Campbell, US Environmental Protection Agency.
3Data from other personal studies by authors.
Figure 4. The relationship between ammonium and salinity in the spring (May
points labeled 1 and 2) and summer (July points labeled 3 and 4). Points labeled
1 and 4 represent neap tides; 2 and 3 represent spring tides.
Cobscook Bay
May–July 1995
82 Northeastern Naturalist Vol. 11, Special Issue 2
that all the other likely candidate sources of nitrogen to Cobscook Bay
combined only represent about 3% of the nitrogen that is transported
by the tide each day as nitrate, and 5% of what is utilized each day in
the growing season by plants. Thus, although local impacts of the other
sources cannot be discounted, in the bigger picture, only tidal exchange
of nitrate is comparable to plant utilization of nitrogen, and the lesser
sources are insignificant.
Ammonium is excreted by animals that consume plants, and also
by bacterial breakdown of nitrogen-containing organic matter (Glibert
et al. 1988). It is used preferentially over nitrate by most marine
plants, and is also oxidized quite rapidly by bacteria to nitrate. As a
result, it is important in phytoplankton nutrition, and its presence tells
us about recent herbivory and recycling. In ocean waters, its presence
often indicates that plant production and her-bivorous grazing are
closely balanced, and this is observed as the ecosystem matures in the
summer.
The distribution of ammonium in Cobscook Bay in the spring and
summer is shown in Figure 4. Unlike nitrate, ammonium is distributed
quite randomly with respect to salinity in both the spring and the summer.
Since ammonium is produced by regenerative processes and is
relatively short lived, this strongly suggests that the ammonium is being
regenerated within Cobscook Bay. What is most surprising is that ammonium
concentrations are almost as high in the spring as they are in the
Figure 5. The relationship between nitrate and salinity in the fall (October points
labeled 5 and November points labeled 6).
Cobscook Bay
October–November 1995
2004 C. Garside and J.C. Garside 83
summer. High concentrations in the summer and fall would be expected
because the herbivore populations have had chance to respond to the
available plant food and grow to match the supply. This is not normally
the case in the spring. The implication is that at least some of the herbivore
population is already in place in the Bay and starts to consume
phytoplankton as soon as they grow in the spring. This scenario is consistent
with large populations of filter feeding animals that are resident
in the Bay, such as clams, mussels, and scallops.
This pool of nitrogen can be put in the same perspective as the other
fluxes calculated above:
Ammonium tidal exchange (2 uM NH
4
in the Bay) = 14.9 metric tons
N per day
that may be lost if ebbing water is not returned on the next flood. Coincidentally,
this helps balance the nitrogen budget for the Bay (not the
purpose of this exercise), but more importantly, this flux is a factor of ten
or more times larger than any originating from current human activities
based on inputs from agriculture and sewage (Table 1).
Fall
In the fall, we see nitrate utilization continuing into October
(points labeled 5) and the distribution is still similar to summer conditions
(Fig. 5). By November, however, nitrate uptake ceases or is
very low and nitrate concentrations are both high and almost uniform
Figure 6. The relationship between ammonium and salinity in the fall (October
spring tide points labeled 5 and November neap tide points labeled 6).
Cobscook Bay
October–November 1995
84 Northeastern Naturalist Vol. 11, Special Issue 2
over the salinity range sampled (points labeled 6). Despite the high
nutrient concentrations there is reduced light to support plankton and
algal growth, and phytoplankton populations decline while fixed algae
respire more than they photosynthesize, which has implications
for nitrogen regeneration.
Ammonium distributions in October are very similar to those in
the summer, and for the same reasons: herbivores effectively crop
the phytoplankton and regenerate ammonium within the Bay (Fig. 6).
The same distribution persists into November, but primary production
has been inferred to have decreased based on the nitrate distribution,
and so the source of this ammonium must be different, at least in part.
Nutrient data alone are insufficient to elucidate the source of the
regeneration that continued high ammonium concentrations imply.
However, by the fall there are large reservoirs of organic nitrogen in
seaweeds and algal mats. These break down and are grazed, resulting in
direct regeneration and a continued supply of particles for filter feeders.
In fact, for a variety of reasons other than the nutrient distribution, it
seems very likely that grazing on fixed algae is at least as important as
filter feeding on phytoplankton in the regeneration of nitrogen as ammonium
throughout the growing season and into the fall (see Campbell
2004, Vadas et al. 2004).
The ultimate source of nitrate?
A final comment on where the nitrate comes from, when much of the
Gulf of Maine surface water is nutrient depleted throughout the summer,
is in order. High nitrate concentrations build up in deeper waters where
the products of excretion, death, and decay accumulate and the nitrogen
they contain is oxidized eventually to nitrate. In the absence of sufficient
light this nitrate cannot be utilized until physical processes bring it to the
surface where there is light, photosynthesis, plant growth, and nutrient
uptake. This occurs annually throughout the Gulf when winter cooling
causes deep convection, water column overturn, and mixing, providing a
nutrient supply supporting phytoplankton growth when days lengthen in
the spring. Mixing is the key. Over much of the Gulf, the spring warming
results in warm, nutrient-depleted water at the surface separated by
a thermocline from colder, nutrient-rich water below (Hopkins and Garfield 1979). Nutrients and high production are short lived in the surface
layer.
In the Bay of Fundy, two circumstances contribute to mixing of
nutrients to the surface throughout the year. In moving from the Gulf
into the Bay of Fundy, tidal currents are compressed and accelerated
by both a narrowing channel and shoaling of the bottom. At some point
the increasing turbulence from increasingly faster currents acting on
the bottom provides enough energy to destabilize the water column and
2004 C. Garside and J.C. Garside 85
break the thermocline. Cold, nutrient-rich water is mixed to the surface,
and it is this water that acts as a source of nutrients to Cobscook Bay.
The large volume tidal exchange of the Bay throughout the year serves
as the local transport mechanism (Brooks et al. 1999).
Conclusions
Cobscook Bay is nutrient rich throughout the year, and is potentially
eutrophic. This is a totally natural circumstance brought about by an
abundant supply of nutrients, most importantly nitrate, from the adjacent
Gulf of Maine. These nutrients promote phytoplankton and fixed
algal growth, and the biomass produced is heavily grazed, resulting in
high ammonium concentrations from excretion and regeneration. The
high ammonium concentrations and its incomplete re-utilization by
the phytoplankton strongly suggest that plant biomass is controlled by
grazing. In other words, despite a high natural nutrient loading, natural
grazing processes serve to limit the accumulation of plant material and
potential eutrophication. At least at the time these measurements were
made, man-made contributions were not significant to the nutrient budget
of the Bay, although they may have significant local impact. Consequently,
the nutrient status of Cobscook Bay has probably changed
little since the development of macrotidal ranges at least 4000 years B.P.
(Scott and Greenberg 1983).
Acknowledgments
This work was conducted as part of a research program. “Developing an
Ecological Model of a Boreal Macro-tidal Estuary: Cobscook Bay, Maine,”
funded by a grant from the A.W. Mellon Foundation to The Nature Conservancy,
with matching funds of funders and organizations involved and services
provided by Bigelow Laboratory for Ocean Sciences, University of Maine at
Orono and Machias, Texas A&M University, US Fish and Wildlife Service Gulf
of Maine Program, Suffolk University (Friedman Field Station), Maine Department
of Marine Resources, and The Nature Conservancy.
Field sampling was supervised by David Phinney ably assisted by Jeff
Brown, Skip Erickson, and Doug Phinney of the Bigelow Laboratory. Sampling
was conducted from the research vessel Otto Miller operated by Tom
Dyum of the Eastport Marine Trade School and Chris Bartlett of the Maine
Sea Grant Office.
This contribution is the result of the elegant planning, analysis, interpretation,
and writing of Chris and Jean Garside. The document was converted to
scientific manuscript format by Peter Larsen, who accepts responsibility for any
shortcomings. The process was assisted by David Brooks, David Phinney, and
other team members. Figures were prepared by Tracey Wysor. Special gratitude
is due Sandy Shumway, Pat Glibert, and Barbara Vickery for their thorough and
constructive review of the manuscript.
86 Northeastern Naturalist Vol. 11, Special Issue 2
Literature Cited
Brooks, D.A., M.W. Baca, and Y.-T. Lo. 1999. Tidal circulation and residence
time in a macrotidal estuary: Cobscook Bay, Maine. Estuarine, Coastal, and
Shelf Science 49:647–665.
Campbell, D.E. 2004. Evaluation and emergy analysis of the Cobscook Bay
ecosystem. Northeastern Naturalist 11(Special Issue 2):355–424.
Garside, C., and J.C. Garside. 1995. Euphotic-zone nutrient algorithms for the
NABE and EqPac study sites. Deep-Sea Research II 42:335–347.
Garside, C., J.C. Garside, and P.F. Larsen. 2004. Nutrient sources and distributions
in Cobscook Bay with data appendix. Bigelow Laboratory for Ocean Sciences,
West Boothbay Harbor, ME, Technical Report Number 116. 24 pp.
Garside, C., G. Hull, and C.S. Yentsch. 1978. Coastal source waters and their
role as a nitrogen source for primary production in an estuary in Maine. Pp .
565–575, In M.L Wiley (Ed.). Estuarine Interactions. Academic Press, Inc.,
New York, NY.
Glibert, P.M., M.R. Dennett, and D.A. Canon. 1988. Nitrogen uptake and NH
4+
regeneration by pelagic microplankton and marine snow in the North Atlantic.
Journal of Marine Research 46:837–852.
Glibert, P.M., C. Garside, J.A. Fuhrman, and M.R. Roman. 1991. Time-dependent
coupling of inorganic and organic nitrogen uptake and regeneration in
the plume of the Chesapeake Bay estuary and its regulation by large heterotrophs.
Limnology and Oceanography 36:895–909.
Hopkins, T.S., and N. Garfield. 1979. Gulf of Maine intermediate water. Journal
of Marine Research 37:103–139.
Ketchum, B.H. 1951. The exchange of fresh and salt waters in tidal estuaries.
Journal of Marine Research 10:18–38.
Ketchum, B.H. 1955. Distribution of coliform bacteria and other pollutants in
tidal estuaries. Sewage and Industrial Wastes 27:1288–1296.
Phinney, D.A., C.S. Yentsch, and D.I. Phinney. 2004. Primary productivity of
phytoplankton and subtidal microphytobenthos in Cobscook Bay, Maine.
Northeastern Naturalist 11(Special Issue 2):101–122.
Ryther J.H., and W.M. Dunstan. 1971. Nitrogen, phosphorus, and eutrophication
in the coastal marine environment. Science 171:1008–1013.
Scott, D.B., and D.A. Greenberg. 1983. Relative sea-level rise and tidal development
in the Fundy tidal system. Canadian Journal of Earth Sciences
20:1554–1564.
Strickland, J.D.H., and T.R. Parsons. 1972. A Practical Handbook of Seawater
Analysis. Fisheries Research Board of Canada, Ottawa, ON, Canada. Bulletin
167.
Vadas, R.L., W.A. Wright, and B.F. Beal. 2004. Biomass and productivity of
intertidal rockweeds (Ascophyllum nodosum LeJolis) in Cobscook Bay.
Northeastern Naturalist 11(Special Issue 2):123–142.


 The Northeastern Naturalist is a peer-reviewed journal that covers all aspects of natural history within northeastern North America. We welcome research articles, summary review papers, and observational notes.