Inventory of Intertidal Marine Habitats,
Boston Harbor Islands National Park Area
RICHARD BELL
1, 2, *, ROBERT BUCHSBAUM
3, CHARLES ROMAN
4,
AND MARK CHANDLER
1, 5
Abstract - The intertidal zone of the 34 islands that are the Boston Harbor Islands
national park area encompasses over half of the total park area, thereby
representing a significant natural resource. The purpose of this study was to
inventory the intertidal zone by classifying and mapping all habitats and compiling
species lists for major taxonomic groups. The Boston Harbor Intertidal
Classification System was developed for mapping substrate and biotic assemblage
types—a system specific to the local area, but capable of application
throughout the Gulf of Maine. Intertidal habitats were mapped from GPS-based
field delineations. Mixed coarse, consisting of rocks, boulders, cobbles, gravel,
shell, and sand, was by far the most common substrate type; however, the islands
were variable with a total of 13 discrete substrate types mapped, ranging from
bedrock and boulders to mud. The outer islands (e.g., Outer and Little Brewster)
were dominated by rocky substrate, while islands close to the mainland (e.g.,
Thompson, Slate) had high percentages of fine sediments. Of the 31 biotic assemblages
mapped, Mytilus edulis (blue mussel) reef was the dominant assemblage
on many of the middle and Hingham Bay islands, while the outer islands
had assemblages common to the more exposed rocky substrates. The species
inventory recorded 95 species of invertebrates, 70 marine algae, and 15 vascular
plants. The information generated from this inventory will provide a foundation
for natural resource management decisions, design of a long-term intertidal
monitoring program, and identification of research needs.
Introduction
The intertidal zone of the 34 islands of Boston Harbor Islands national
park area includes a diversity of habitats ranging from bedrock outcrops
to mudflats to salt marshes. These habitats have been intensively studied
throughout the Gulf of Maine (e.g., Bertness 1999, Lubchenco 1978,
Lubechenco and Menge 1978, Menge 1976, Roman et al. 2000, Whitlatch
1982); however, the full range of community types, species, and their
distribution in Boston Harbor is largely undocumented. Unlike the soft
1New England Aquarium, Central Wharf, Boston, MA 02110. 2Current address
- Graduate School of Oceanography, University of Rhode Island, Narragansett,
RI 02882. 3Massachusetts Audubon Society, 346 Grapevine Road, Wenham, MA
01984. 4National Park Service, University of Rhode Island, Narragansett, RI
02882. 5Current address - Earthwatch Institute, 3 Clock Tower Place, Suite 100,
Box 75, Maynard, MA 01754. *Corresponding author - brell@gso.uri.edu.
Boston Harbor Islands National Park Area: Natural Resources Overview
2005 Northeastern Naturalist 12(Special Issue 3):169–200
170 Northeastern Naturalist Vol. 12, Special Issue 3
bottom benthic communities of Boston Harbor (Rex et al. 2002) and other
subtidal communities within the region (Harris 1974), the intertidal resources
are known only from a few study sites on the outer islands (Menge
1976), and mention of a limited number of organisms found in Gould
(1841) and Agassiz and Agassiz (1865).
To better manage the natural habitats and human resources within the
intertidal zone, an understanding of the overall distribution and abundance
of these communities along with the physical factors that determine
their presence is essential. Numerous researchers have investigated the
mechanisms that shape intertidal communities (e.g., Lubchencho 1978,
Menge 1976, Paine 1966); however, relatively few studies have quantified the distribution of intertidal communities at a regional scale. The
purpose of this study was to conduct an initial inventory of the intertidal
natural resources of the Boston Harbor Islands (Fig. 1; 42o20'N, 71o56'W)
incorporating this more regional approach.
There are several possible approaches to consider when conducting
a natural resource inventory. A large-scale approach may include
Figure 1. Location of Boston Harbor Islands national park area.
2005 R. Bell, R. Buchsbaum, C. Roman, and M. Chandler 171
aerial surveys or interpretation of orthophotos, while assessment of
ground-based transects or quadrats represents a typical fine-scale approach.
We sought to develop an inventory at the community scale
that had the benefits of both; the ability to map or inventory large
areas (i.e., numerous islands) and the capability of documenting the
composition and relative abundance of substrates and species. We developed
a ground-based GPS technique that was labor intensive, but
especially effective at producing detailed habitat and substrate maps,
with considerable information on the composition of species and
substrate types. Aerial mapping alone would generally be of lower
resolution and include less information on species composition and
substrate attributes (Cowardin et al. 1979, Ritter and Lanzer 1997,
Thompson et al. 1998). Quadrat and transect techniques can provide
exceptional detail with regard to species and abundance in the intertidal
zone (Dethier et al. 1993), but typically cover a relatively small
area. These quantitative sampling methods are often selected as the
foundation for long-term monitoring efforts, but perhaps are less suitable
to our goal of providing an initial inventory of a highly heterogeneous
environment like the Boston Harbor Islands intertidal zone.
The foundation of our intertidal zone inventory and mapping project
includes the development of a substrate and biotic assemblage classification
scheme that incorporates components of other community
classification schemes for marine and estuarine environments (Brown
1993; Connor et al. 1997a,b; Dethier 1990) that potentially could be
used throughout the Gulf of Maine, but was designed specifically for
the Boston Harbor Islands.
Methods
The Boston Harbor Intertidal Classification System
Boston Harbor and its islands have had a long history of human
alteration. Coastlines have been modified, embayments and estuaries
filled in, and much of the shoreline has been built up to prevent coastal
erosion. Rip-rap, armature, jetties, piers, and groins are all common features
in the Boston Harbor Islands. The intertidal zone today is the result
of interplay between cultural features and natural processes. To account
for the diversity of habitat types found throughout the Boston Harbor Islands,
we have modified existing community classification systems into
a system that can accommodate a full range of possible habitat types.
The National Wetland Classification System (Cowardin et al. 1979),
currently in use as the National Wetland Inventory, provides a foundation
for classifying Boston Harbor Islands intertidal communities, but it
was developed primarily for classifying general habitat types delineated
from aerial photography. We required a classification system capable of
172 Northeastern Naturalist Vol. 12, Special Issue 3
supporting a detailed, field-based, delineation and mapping of intertidal
communities and a system that incorporates information on the animals
that often play an important role in structuring intertidal habitats. The
Boston Harbor Intertidal Classification System (BHICS), described in
detail elsewhere (Bell et al. 2002), builds upon the wetland classification
system and incorporates features found in schemes developed specifi-
cally for marine and estuarine habitats in Washington (Dethier 1990)
and Maine (Brown 1993).
The BHICS first considers substrate as a critical feature, following
the Dethier (1990) and Brown (1993) classification schemes. Thirteen
substrate classes were identified based on a standard classification system
of grain size (e.g., rocks, cobble, sand, mud; Wentworth 1922). In
addition, some substrate categories were defined to contain mixtures
of grain sizes (e.g., mixed coarse sediment). The BHICS then identifies the major space-occupying organism(s). Thirty-five biotic assemblages
included, among others, invertebrates (e.g., Mytilus edulis reef),
macroalgae (e.g., Ascophyllum nodosum), angiosperms (e.g., Spartina
patens), and mixtures (e.g., mixed brown algae/Semibalanus) as major
space-occupying organisms.
The Brown (1993) and Dethier (1990) classification schemes are
similar to the BHICS, but focus on the entire shoreline from low to high
tide, incorporating the numerous space-occupying organisms into a
single community type (i.e., exposed rocky intertidal, high marsh). This
block format would be highly effective for classifying large areas of
shoreline and would provide higher resolution then most aerial surveys,
but still has the potential to miss assemblages by labeling a composite
intertidal area as a single habitat type. In Boston Harbor, numerous assemblages
(i.e., mudflat, Ascophyllum, Spartina alterniflora, Semibalanus)
occurred within a small area. We felt that it was important to map
all space-occupying organisms to track the appearance, disappearance,
and change in aerial extent of the assemblages. Because the BHICS
delineates in this manner, it does not incorporate information on wave
exposure or other modifiers as a classification level as done by Diether
(1990) and Brown (1993).
It is expected that the BHICS will have widespread applicability
for field mapping and classification of intertidal habitats, especially
within the Gulf of Maine region. The substrate types should be applicable
in almost all locations with only minor alterations. The biotic
assemblages were designed based on the diagnostic or major
space-occupying organism(s) found in Boston Harbor. The four broad
categories of space-occupying organisms (lichen, vascular plants,
macroalgae, and invertebrates) are generally applicable to other areas
within the region.
2005 R. Bell, R. Buchsbaum, C. Roman, and M. Chandler 173
Delineating and characterizing polygons in the field
A total of 21 islands in Boston Harbor were mapped using the Boston
Harbor Intertidal Classification System (Bell et al. 2002). On each island
we mapped every change in major space-occupying organism(s) and substrate
type in the intertidal zone by walking the perimeter with a Trimble
GeoExplorer III GPS unit and electronically capturing that region as a
unique polygon. Each polygon represented a specific location composed
of a single biotic assemblage and a single substrate type as defined in the
BHICS. We used 25 m2 as the minimum size for a polygon.
The intertidal zone for this survey was defined as the area between
the extreme high and low spring tides. Fieldwork was conducted during
low tide and usually during and near the lowest tides associated with
full and new moon periods. The high tide mark on bedrock and boulders
was defined as the top of the black zone (band of lichens and cyanobacteria
present in the uppermost intertidal). On unconsolidated substrates
(cobble, gravel, sand, mixed coarse), the high tide mark was the highest
wrack line that was not in upland vegetation. The low tide mark in rock,
boulder, and unconsolidated areas was the lowest point safely attainable
one hour before and after low tide. For rocky areas, this was below
the Chondrus/Mastocarpus band, typically in the kelp band. In mudflat
areas with no macroalgae indicators, we walked waist to chest deep in
the water beginning one hour before low tide and ending no later than
one hour after low tide. All field mapping was begun at the high intertidal
approximately three hours before low tide and continued down the
intertidal gradient with the ebbing tide.
A polygon was defined as a specific substrate type if it had more
than 75% cover of a specific sediment type as defined in the BHICS. A
biotic assemblage type was defined as an area in which more than 30%
of the total area was biotic cover and at least 75% of the biotic cover in
the polygon was a single major space-occupying organism(s) as defined
in the BHICS. For biotic assemblages, a polygon was defined as “no
macrobiota” if less than 30% was biotic cover. In addition to the initial
designation as a specific substrate and assemblage, a percent cover
menu was associated with each polygon which allowed for greater refinement.
As an example, if a given area consisted of greater than 75%
Spartina patens, but contained a small patch of Spartina alterniflora
that was smaller than the minimum mappable unit, the polygon was
labeled as Spartina patens and the Spartina alterniflora was recorded
as a percentage of the total biota. This information is part of the attribute
table in the GIS files. The classification system was based on our
ability to identify the visible community; therefore, assemblages were
most readily delineated on hard surface intertidal habitats. The biota of
174 Northeastern Naturalist Vol. 12, Special Issue 3
soft-bottomed communities (e.g., mudflats) was generally not visible at
the surface. These communities were identified based on their sediment
composition rather than any biota found there.
Field mapping of 15 islands was conducted from April to October
2001, including Thompson, Spectacle, Long, Rainsford, Peddocks,
Grape, Slate, Langlee, Worlds End, Georges, Lovells, Calf, Great
Brewster, Little Brewster, and Outer Brewster Islands. Five islands
(Gallops, Raccoon, Bumpkin, Hangman, and Sheep) were mapped
from June to August 2002. Snake Island was mapped in March and
April 2003.
In this study, it was not feasible to provide detailed substrate and assemblage
maps for all 34 islands associated with Boston Harbor Islands
national park area. The 21 islands sampled were selected to represent
the range of substrate types, biotic assemblages, wave exposure intensity,
and human uses present in the park. The 13 islands not delineated
in detail were mapped only to determine the extent of the terrestrial and
intertidal area. Using a Trimble GeoExplorer III dGPS unit, a single
terrestrial polygon and a single intertidal polygon was created for each
island. This survey was conducted January through April 2003.
Post-processing and data analysis
The rover files from the GeoExplorer III were uploaded to a computer
via Pathfinder Office 2.51. Rover files were corrected with base
files from stations in Woburn, MA, Yarmouth, ME, and Kingston, RI,
and the corrected files were edited in Pathfinder Office 2.51 to remove
loops. The corrected, edited files were exported to ArcView 3.2 where
all abutting polygons were snapped together. All final map products are
projected as follows: UTM, Zone 19N, NAD 83, Meters.
We used Detrended Correspondence Analysis (DCA), a community
ordination technique, to evaluate similarities and dissimilarities
in intertidal communities based on substrata and assemblages among
the 21 islands that were mapped (Gauch 1982, McCune and Mefford
1999). For each island, the percent of the total intertidal area occupied
by each substrate and each assemblage type was calculated as
input data for the analysis.
Inventory of intertidal organisms
Species lists for Boston Harbor Islands intertidal habitats were
based on two different sets of observations. We maintained records of
species observed during the field delineations. We were also joined
several times in the field by three taxonomic experts in the disciplines
of hard bottom invertebrates (Larry Harris, University of New Hampshire),
soft bottom benthic invertebrates (Harlan Dean, Harvard Museum
of Comparative Zoology), and macroalgae (Arthur Mathieson,
University of New Hampshire). We did not attempt a quantitative
2005 R. Bell, R. Buchsbaum, C. Roman, and M. Chandler 175
survey, but directed our experts to representative habitats and those
that we felt would yield the greatest diversity of marine invertebrates
and macroalgae as determined during mapping. These areas were relatively
secluded and had low usage before and during the establishment
of the park. Procedures for collection and identification of macroalgae
are described in Mathieson et al. (1998). Nomenclature followed South
and Tittley (1986), except for recent changes noted by Sears (1998)
and Silva et al. (1996). For vascular plants, identification and nomenclature
followed Gleason and Cronquist (1991). Invertebrates were
either identified in the field or brought to the lab for further study.
Identification and nomenclature were based on Gosner (1971, 1979),
Pollock (1998), and Weiss (1995). The determination of nativity was
based primarily on Carleton (2003), with additional information from
Wares et al. (2002). All surveys were conducted within several hours
of low tide, on numerous dates from April through October 2001.
Results
Individual island substrates and biotic assemblages
Tables 1 and 2 summarize the substrate and assemblage data for the
21 islands. Two of the more exposed, outer islands (Outer and Little
Brewster) were the only islands to be dominated by rocky substrata (>
50% bedrock and boulders). Two islands closest to the mainland, Thompson
Island and Worlds End, had the highest percentage of peat and fine
sediments. Georges, Gallops, and Lovells Islands were notable for mixed
coarse substrate and large mussel reefs, defined as carbonate mound-like
features. Langlee and Raccoon had much higher percentages of rocky
substrata than other islands in protected parts of the Harbor.
Not surprisingly, the outer islands tended to have higher percentages
of the rock/boulder mixed (zonation and no zonation) assemblages (Table
2). Many of the middle and inner islands and those of the protected
Hingham Bay contained over 20% of their intertidal area as mussel
reefs. Salt marshes were best developed on Thompson Island and Worlds
End. In keeping with its anomalous rock substrata, Langlee Island was
atypical of the inner islands in having a high percentage of the Ascophyllum
assemblage, a brown macroalga that grows in low wave energy
areas on hard substrates (Vadas et al. 1990).
Substrate maps, biotic assemblage maps, and summary area statistics
are available for all 21 islands mapped (Bell et al. 2002). These maps provide
extensive detail on the spatial distribution of substrates and biotic assemblages
and will be useful to coastal managers and to scientists planning
future research and inventory in the intertidal zone. As an example of the
mapping and summary statistics, data from one island are presented. Little
Brewster Island, one of the outer islands, was dominated by bedrock, with
176 Northeastern Naturalist Vol. 12, Special Issue 3
Table 1. Percent of different substrata associated with the 21 islands. Abbreviations used for and total intertidal area of each island, in hectares, are as
follows: OB = Outer Brewster (4.1 ha), C = Calf (6.5 ha), GB = Great Brewster (19.8 ha), LB = Little Brewster (1.7 ha), Sn = Snake (29.4 ha), L = Lovell
(28.8 ha), Ge = Georges (5.6 ha), Ga = Gallops (11.2 ha), Pe = Peddocks (42.1 ha), H = Hangman (2.2 ha), R = Rainsford (9.3 ha), Lo = Long (34.9ha),
Sp = Spectacle (11.5 ha), T = Thompson (53.0 ha), Gr = Grape (18.8 ha), Sl = Slate (15.2 ha), La = Langlee (1.4 ha), WE = Worlds End (46.6 ha), Sh =
Sheep (8.4 ha), R = Raccoon (3.2 ha), and B = Bumpkin (12.7 ha).
Outer islands Middle islands Hingham Bay
Substrate OB C GB LB Sn L Ge Ga Pe H R Lo Sp T Gr Sl La WE Sh R B
Cultural 0 < 1 0 0 0 0 0 0 < 1 0 0 0 0 < 1 0 0 0 0 0 1 0
Other 0 0 0 0 < 1 0 0 0 0 0 0 0 0 0 0 0 0 0 0 0 < 1
Reef 0 0 5 0 < 1 50 44 21 5 4 0 < 1 <1 7 14 0 16 < 1 0 0 0
Boulders 2 20 2 21 0 7 31 10 0 20 8 6 9 <1 < 1 < 1 0 < 1 0 0 1
Cobble 0 0 4 0 0 0 1 0 1 0 < 1 0 0 0 14 < 1 0 0 0 0 0
Gravel 0 0 < 1 0 0 4 2 0 5 < 1 1 < 1 0 < 1 0 0 0 < 1 0 0 7
Mixed coarse 8 51 89 5 7 37 22 69 72 46 79 88 80 32 38 34 38 19 43 35 62
Mixed coarse and fine 0 0 0 0 71 0 0 0 13 2 0 5 0 30 21 63 < 1 56 54 10 30
Mud 0 1 0 0 4 0 0 0 0 0 0 0 0 17 8 0 0 13 0 2 0
Peat 0 5 0 0 14 0 0 0 3 1 0 0 0 12 4 1 7 7 2 18 0
Rock 90 22 1 74 0 0 < 1 0 0 27 12 0 3 0 1 2 40 1 0 34 0
Sand 0 0 0 0 0 2 0 < 1 < 1 0 0 < 1 8 < 1 0 0 0 < 1 0 1 0
Shells 0 < 1 0 0 3 0 0 0 < 1 0 0 0 0 0 0 1 0 2 1 < 1 0
2005 R. Bell, R. Buchsbaum, C. Roman, and M. Chandler 177
Table 2. Percent of different biotic assemblages associated with the 21 islands. Island abbreviations and intertidal areas as listed in Table 1.
Outer islands Middle islands Hingham Bay
Assemblage OB C GB LB Sn L Ge Ga Pe H R Lo Sp T Gr Sl La WE Sh R B
Ascophyllum 8 18 0 3 0 0 1 < 1 0 0 0 0 0 0 0 5 35 < 1 0 5 0
Fucus 0 0 0 0 < 1 1 0 0 0 0 4 0 4 1 1 11 0 3 0 0 0
Iva 0 0 0 0 0 0 0 0 0 0 0 0 0 0 0 0 0 < 1 0 0 0
Mytilus reef 0 1 7 7 5 52 43 22 31 4 25 50 44 30 19 28 17 29 7 0 13
No macrobiota 11 11 6 13 19 24 19 21 32 8 15 25 22 20 28 13 36 6 < 1 1 3
Other 0 0 0 0 4 0 0 0 < 1 0 0 0 0 5 0 0 0 < 1 < 1 1 0
Phragmites 0 1 0 0 0 0 0 0 < 1 0 < 1 0 0 0 0 0 0 < 1 0 0 < 1
Rock/boulder mix: zonation 17 0 < 1 36 0 0 0 4 0 0 0 0 4 0 0 0 0 0 0 0 0
Salicornia 0 0 0 0 0 0 0 0 0 0 0 0 0 < 1 0 0 0 < 1 0 0 0
Salt tide pool 0 1 0 0 0 0 0 0 0 0 0 0 0 0 0 0 0 0 0 0 0
Semibalanus 1 < 1 5 8 4 3 4 5 3 <1 1 4 3 2 1 0 0 2 0 0 9
Spartina alterniflora 0 1 0 0 14 < 1 0 0 1 2 1 0 < 1 11 4 7 7 12 4 16 2
Spartina patens 0 3 0 0 < 1 0 0 0 < 1 0 0 0 0 < 1 0 < 1 0 3 0 1 < 1
Suaeda 0 0 0 0 0 0 0 0 0 0 0 0 0 < 1 0 0 0 0 0 0 0
Black zone 0 1 0 0 0 0 6 0 0 4 0 1 1 0 0 0 0 0 < 1 7 0
Brown algae 0 0 0 0 0 0 0 0 0 0 0 0 0 1 < 1 7 0 3 0 0 0
Creek 0 0 0 0 < 1 0 0 0 < 1 0 0 0 0 < 1 0 0 0 0 0 0 0
Green algae 1 0 1 0 0 < 1 0 < 1 < 1 1 0 0 4 3 2 1 0 0 0 0 0
Green crust < 1 0 13 0 0 0 0 3 0 6 0 2 0 0 0 0 0 0 8 6 0
High intertidal green 1 < 1 6 0 0 1 4 1 < 1 0 3 1 2 0 0 < 1 0 0 1 0 0
High marsh 0 1 0 0 1 0 0 0 2 0 0 0 0 < 1 0 2 < 1 < 1 < 1 2 0
Mixed br. algae/Semi/reef 0 0 7 3 1 < 1 0 11 < 1 13 1 1 < 1 0 < 1 0 0 0 24 6 32
Mixed br. algae/Semibalanus 1 22 9 1 0 2 15 2 < 1 20 9 < 1 < 1 0 2 1 4 11 16 28 < 1
Mixed coarse/reef: mixed 1 1 34 0 2 9 6 23 13 41 16 3 4 < 1 30 8 < 1 4 33 21 9
Mixed br. algae/Semi/green 0 4 4 0 0 2 < 1 < 1 0 0 0 2 1 < 1 0 0 0 0 0 0 0
Mixed br. algae/Mytilus 0 0 4 0 8 < 1 1 0 0 0 3 0 0 3 < 1 0 0 0 0 0 0
Mudflat 0 0 0 0 41 0 0 0 3 0 0 0 0 15 0 18 0 24 0 0 0
Red foliose algae 0 0 0 0 0 < 1 0 0 < 1 0 0 2 1 0 0 0 0 0 0 0 0
Rock/boulder mixed: 59 33 < 1 28 0 0 0 1 0 2 7 0 0 0 0 < 1 1 < 1 0 0 0
no zonation
Tide pool 1 2 2 0 < 1 3 < 1 2 1 0 1 < 1 4 < 1 0 0 0 0 0 2 0
Transition zone 0 0 1 0 0 2 0 5 12 0 16 9 7 6 14 0 0 3 7 3 31
178 Northeastern Naturalist Vol. 12, Special Issue 3
minor portions of boulder and mixed-coarse substrate (Figs. 2, 3, 4a, 4b).
The dominant intertidal assemblage was rock/boulder mix, with biotic zonation
or with no zonation. For the mixed assemblage with zonation, biota
Figure 2. Intertidal substrate map for Little Brewster Island.
Figure 3. Intertidal biotic assemblage map for Little Brewster Island.
2005 R. Bell, R. Buchsbaum, C. Roman, and M. Chandler 179
Figure 4a. Summary of area (ha) for each substrate mapped at Little
Brewster Island.
Figure 4b. Summary of area (ha) for each biotic assemblage mapped at Little
Brewster Island.
Rock Boulders Mixed coarse
Rock/boulder mixed:
zonation
Rock/boulder mixed:
no zonation
No macrobiota
Semibalanus
Mytilus reef
Mixed brown algae/
Semibalanus/Mytilus
reef
Ascophyllum
Mixed brown algae/
Semibalanus
180 Northeastern Naturalist Vol. 12, Special Issue 3
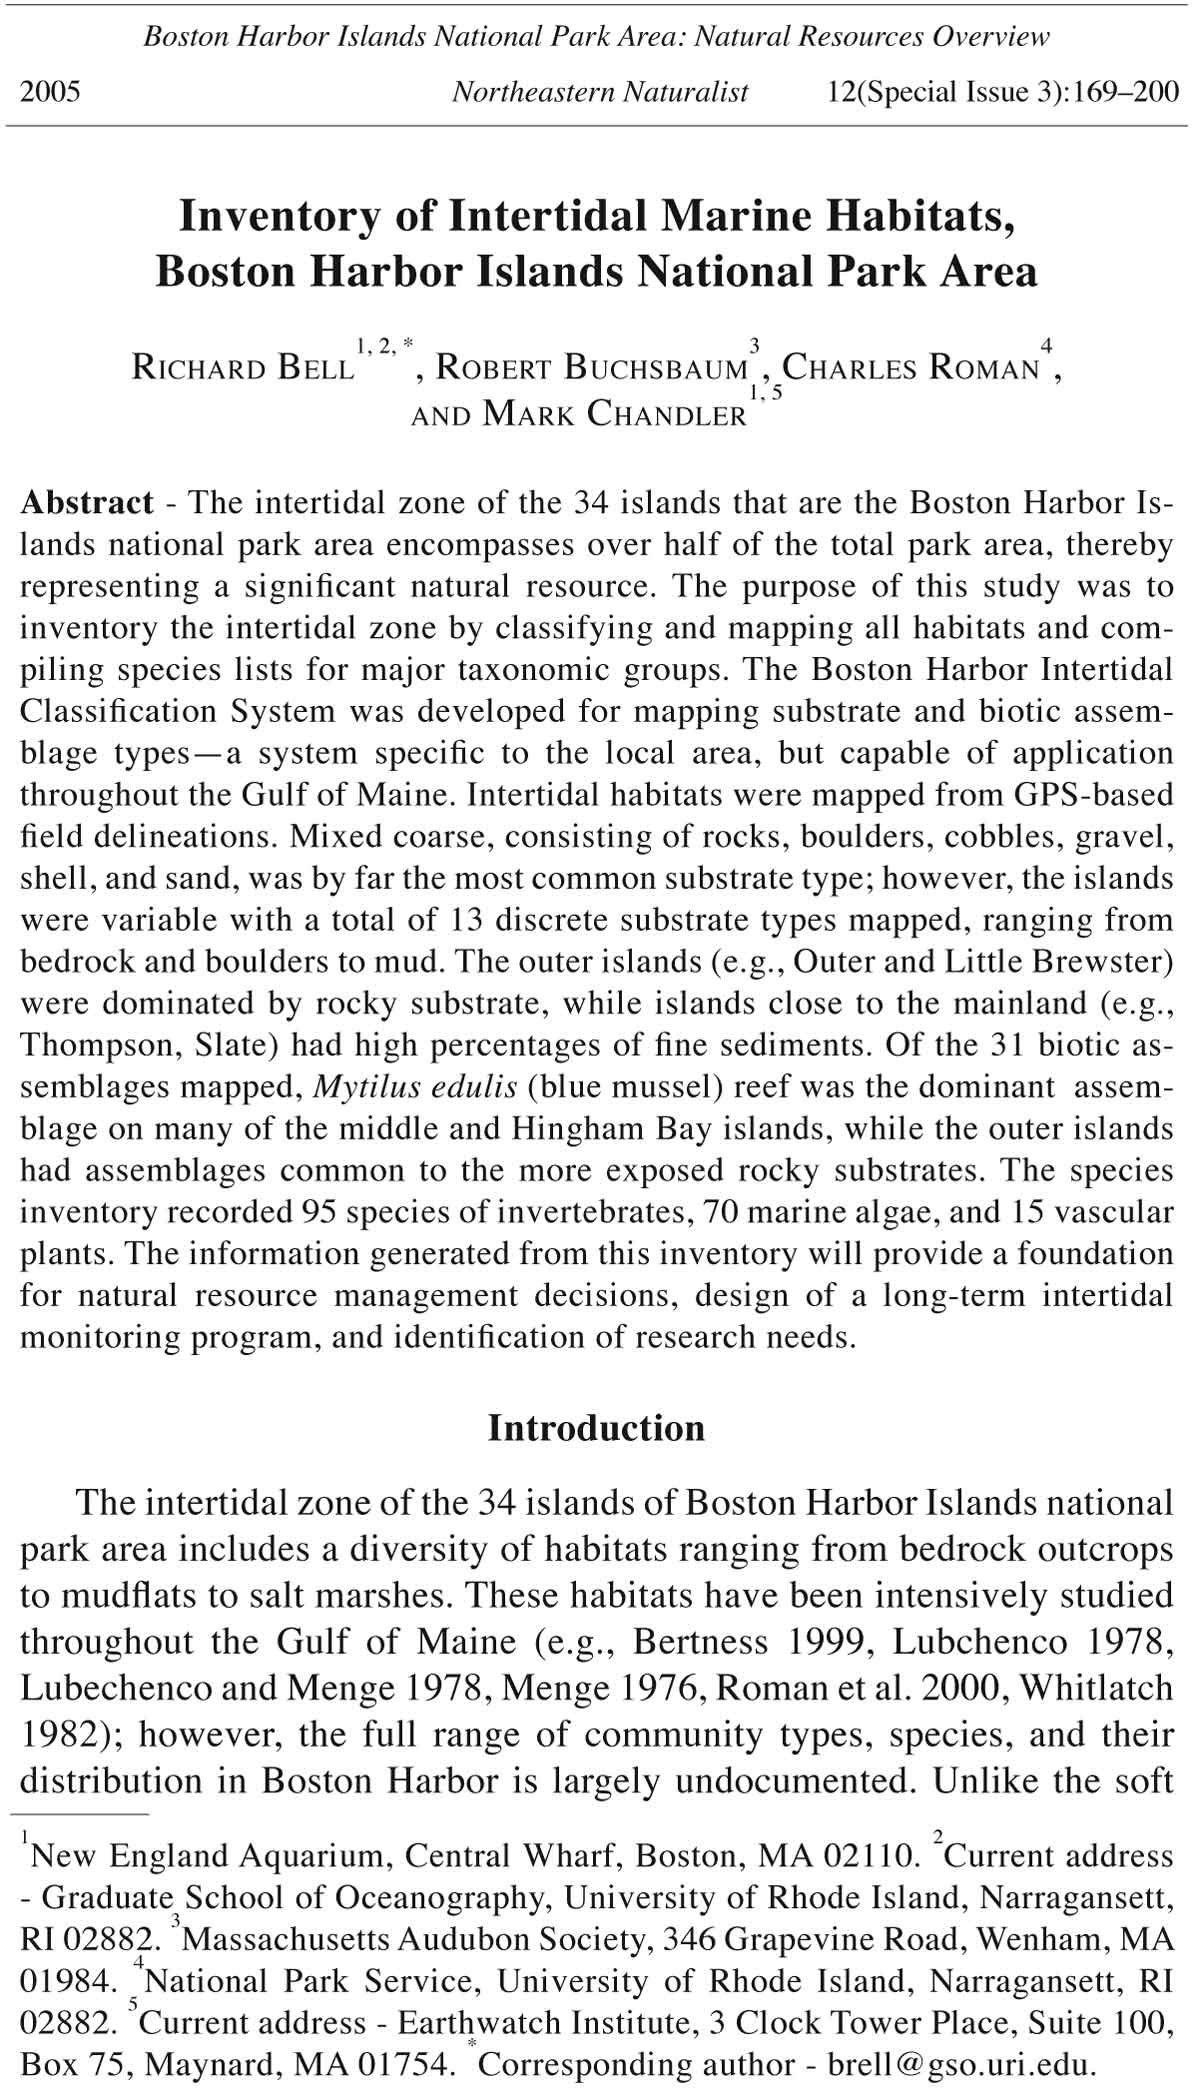
Figure 5. Ordination diagram of Detrended Correspondence Analysis (DCA)
axis 1 and axis 2 showing variation of the 21 mapped islands based on substrate
composition. Differences in substrate composition among the islands are demonstrated
by the spread along the axes. The diagram also shows the individual
substrate types and their relationship to the individual islands. Axis 1 accounts for
35.3% of the variance and axis 2 accounts for 15.7% of the variance.
Figure 6. Ordination diagram of DCA axis 1 and axis 2 showing variation of the 21
mapped islands based on biotic assemblage composition. Differences in biotic assemblage
composition among the islands are demonstrated by the spread along the
axes. The diagram also shows the individual assemblage types and their relationship
to the individual islands. Axis 1 accounts for 26.6% of the variance and axis 2 accounts
for 14.3% of the variance.
2005 R. Bell, R. Buchsbaum, C. Roman, and M. Chandler 181
covers more than 30% of an area and is organized with distinct vertical
zonation (i.e., with barnacles, followed by brown algae, followed by red algae),
but no single taxa covers greater than 75% of the total biota. The same
definitions of cover apply to the other mixed assemblage, but the area lacks
vertical zonation. This “no zonation” assemblage was found in exposed
areas on bedrock and boulders where large amounts of microhabitats may
enable many assemblages that were too small to map individually to cooccur.
Using the data presented in Tables 1 and 2, DCA was applied as an
objective means of organizing a complex data set on substrate and biotic
assemblages. Distance between the points on a plot is a measure of their
similarity or difference. For the substrate data, points close together represent
islands with very similar substrate composition, while points farther
apart have relatively distinct substrate composition (Fig. 5). There is
a clear gradient along Axis 1, with Worlds End and Outer Brewster Island
at extreme ends, demonstrating that the substrate composition of these
islands is very different. The islands grouped toward the center of the plot
(Long, Great Brewster, Rainsford, Gallops, Peddocks, Spectacle) all have
quite similar substrate composition. The distribution of substrate types on
the DCA plot clearly indicates that Outer Brewster and Little Brewster are
dominated by the rock substrate, whereas mud, mixed coarse, and shell
substrates best define the Worlds End site. Lovells and Georges have similar
substrates, best characterized by the mussel reef type. In general, the
islands to the right of the plot are the most exposed as reflected by rock or
boulder substrates, while islands toward the left are within more protected
areas or are composed of mixed coarse substrates characteristic of eroding
drumlins.
As with the substrate plot, the DCA ordination plot of the biotic assemblages
shows a clear gradient from the exposed outer islands (Outer
Brewster, Little Brewster, Calf) to the most protected sites (Fig. 6). The
plot is quite busy, but in general, biotic assemblages that define the rock/
boulder substrate islands (Outer Brewster, Little Brewster, Calf) are rock/
mixed zonation and no zonation habitats. At the other extreme, mudflats
and salt marsh species (e.g., Spartina alterniflora, Iva frutescens, Salicornia
europaea) dominate the protected sites as expected. Long, Spectacle,
Lovells, and Peddocks have very similar biotic assemblages as reflected
by their tight grouping on the DCA plot.
Substrate and assemblage: islands combined
Overall, the 21 Boston Harbor Islands mapped contained 366 hectares
(904 acres) of intertidal habitats. Mixed coarse was the most common
substrate type in the Boston Harbor Islands, covering about half the area
in the islands we analyzed (Table 3). It contained almost twice as much
area as the next most common type, mixed coarse and fine. The biogenic
182 Northeastern Naturalist Vol. 12, Special Issue 3
Table 4. Total area (hectares and percent) of the individual biotic assemblage types on the
21 islands mapped.
Assemblage type Area (ha) Area (% of total)
Mytilus reef 100 27.5
No macrobiota 66 18.2
Mudflat 37 10.2
Mixed coarse/Mytilus reef: mixed 35 9.6
Transition zone 23 6.3
Spartina alterniflora 19 5.2
Mixed brown algae/Semibalanus 14 3.9
Semibalanus 10 2.8
Mixed brown algae/Semibalanus/Mytilus reef 10 2.8
Rock/boulder mixed: no zonation 6 1.7
Mixed brown algae/Mytilus reef 5 1.4
Fucus 5 1.4
Green crust 5 1.4
Other 4 1.1
Ascophyllum 3 0.8
Green algae 3 0.8
Brown algae 3 0.8
High intertidal green 3 0.8
Tide pool 3 0.8
Mixed brown algae/Semibalanus/green algae 3 0.8
Rock/boulder mixed: zonation 2 0.6
Spartina patens 2 0.6
High marsh 2 0.6
Black zone 1 0.3
Red foliose algae 1 0.3
Mixed coarse/Mytilus reef mixed 1 0.3
Phragmites < 1 < 0.3
Creek < 1 < 0.3
Salicornia < 1 < 0.3
Suaeda < 1 < 0.3
Salt tide pool < 1 < 0.3
Iva < 1 < 0.3
Table 3. Total area (hectares and percent) of the individual substrate types on the 21 islands
mapped.
Substrate type Area (ha) Area (% of total)
Mixed coarse 172 46.7
Mixed coarse and fine 90 24.5
Reef 29 7.9
Mud 21 5.7
Peat 18 4.9
Boulders 12 3.3
Rock 12 3.3
Cobble 4 1.1
Gravel 4 1.1
Shells 2 0.5
Sand 2 0.5
Cultural < 1 < 0.5
Other < 1 < 0.5
2005 R. Bell, R. Buchsbaum, C. Roman, and M. Chandler 183
structure, Mytilus edulis reef, was considered both as a substrate and species
assemblage in this study. Reef was a frequently encountered substrate
type and was the most common species assemblage, covering more than
one-quarter of our study area (Table 4). “No macrobiota” was the second
most common assemblage encountered.
Species survey
The Boston Harbor Islands intertidal surveys of 2001 identified to
the species level 95 species of animals, 70 marine algae, and 15 vascular
plants (Appendices A–C). Annelida, Arthropoda, Mollusca, and Ectoprocta
(Bryozoa) were the best-represented animal phyla in terms of
species. Crustacea, Polychaeta, and Gastropoda had the highest number
of species among the animal classes (Appendix A).
Table 5. Intertidal macroalgae and invertebrate taxa recorded at the Boston Harbor Islands
in 2001 compared to more comprehensive and longer-term records from Northeastern
University’s Nahant Marine Science Center (Northeastern University 1995) and the Isles
of Shoals Marine Lab (Borror 1994).
Macroalgae Division Isles of Shoals Nahant Boston Harbor
Chlorophyta 33 28 14
Phaeophyta 30 24 13
Rhodophyta 45 26 16
Invertebrate Phylum Class Isles of Shoals Nahant Boston Harbor
Annelida Oligochaeta 0 0 4
Annelida Polychaeta 16 13 16
Arthropoda Crustacea 19 16 16
Arthropoda Insecta 1 1 1
Arthropoda Pycnogonida 1 1 0
Chordata Ascidiacea 8 6 5
Cnidaria Hydrozoa 13 8 7
Cnidaria Anthozoa 2 2 2
Cnidaria Scyphozoa 2 0 0
Echinodermata Asteroidea 3 3 3
Echinodermata Echinoidea 2 2 1
Echinodermata Ophiuroidea 2 2 2
Echinodermata Holothuroidea 2 1 0
Ectoprocta Gymnolaemata 13 8 11
Ectoprocta 2 1 1
Hemichordata 1 0 0
Mollusca Bivalvia 10 7 6
Mollusca Gastropoda 35 22 12
Mollusca Polyplacophora 3 2 0
Nemertea Anopla 4 5 1
Nemertea Enopla 2 2 1
Platyhelminthes Turbellaria 1 2 0
Porifera Calcaria 2 1 1
Porifera Demospongiae 3 3 3
Sipuncula 1 0 1
Total invertebrates 148 108 94
184 Northeastern Naturalist Vol. 12, Special Issue 3
The Rhodophyceae were the most frequently represented among the
algal divisions (Appendix B). The vascular plants were all common salt
and brackish marsh species (Appendix C).
The species lists included in this paper represent an initial survey
encompassing just one field season and should not be considered complete.
More extensive species lists from nearby marine regions have
been compiled and are based on decades of observations (Northeastern
University’s Nahant Marine Science Center 1995; Isles of Shoals, ME,
Borror 1994). Based on a comparison of our Boston Harbor Islands list
with the nearby Isles of Shoals and Nahant, we would expect to encounter
significantly more macroalgal species during a comprehensive and
longer-term survey (Table 5). Invertebrate taxa were fairly well represented
during our 1-year survey, except for the Gastropoda.
Of the 95 animal taxa, 72 are considered native species, 11 as nonnative,
and 10 of unknown (cryptogenic) origin. We could not make a determination
for the other two taxa that were not identified to species either
in our study (Obelia spp.) or in Carleton (2003; Alcyonidium sp.). Of the
seaweeds, 64 are considered native, 4 non-native, and 2 cryptogenic.
Discussion
Distribution of habitats and species
The biota of the intertidal zone is shaped by the interplay of physical
processes and biotic interactions (Bertness 1999, Menge 1976). In
Boston Harbor we did not attempt to quantify these processes and interactions,
but based on our inventory we can begin to make informed
observations on the factors that are important in shaping the intertidal
zones in Boston Harbor. The DCA ordination plots (Figs. 5 and 6) depict
a gradient of diverse substrate and assemblage types across the Harbor
and serve as an initial step toward interpreting the distribution of habitats
and species. As expected, the substrate composition of the Boston
Harbor Islands can be classified along a gradient of wave energy and exposure.
The biotic assemblages subsequently are present along a similar
gradient. Salt marsh flowering plants and mudflats characterized the low
wave energy end of the gradient, Mytilus reefs characterized the low to
moderate wave energy environments, and rock/boulder mixed (zonation
and no zonation) dominated the outer islands (Table 2, Fig. 6).
Other, more detailed observations are also apparent from our inventory
of intertidal habitats. Many of the middle and Hingham islands are
flooded, eroding drumlins largely composed of mixed coarse substrate
(mixes of sand, gravel, cobble, boulders) interspersed with bedrock
platforms and large boulder fields (Thompson, Grape, Peddocks; Fig. 5,
Table 1; Rosen and Leach 1987). These islands were devoid of life in
the upper and middle intertidal zone except for crusts and some lichens,
2005 R. Bell, R. Buchsbaum, C. Roman, and M. Chandler 185
Pseudendoclonium submarinum, Lyngbya majuscula, and Verrucaria sp.
(no-macrobiota and transition-zone assemblages). Lower down in the
intertidal, we found large areas in which Mytilus edulis was intermixed
with gravel, cobble, and boulders forming solid bars held together with
byssal threads. These partially biogenic, partially stone reefs are known
to have high species richness (Lintas and Seed 1994).
Based on work conducted in nearby Narragansett Bay, RI, a combination
of factors, including physical disturbance (Stephens and
Bertness 1991), grazers (Bertness 1984), and thermal stress (Bertness
1989), appear to play a major role in structuring the intertidal
zone in this type of glacial till environment. Rolling stones due to
wave action scrape organisms off other rocks and crush epiphytes
and epifauna (Sousa 1979). On some of the more exposed glacial till
islands (Lovells, Long, and Deer Island) wave action and movement
of unconsolidated sediment may be particularly significant. Grazing
also has some effect in shaping the assemblages, but Littorina densities
were much lower in Boston Harbor (rarely exceeding over 100/
m2 and typically much lower) then those found in Narragansett Bay
(600–1000/m2; Bertness 1984), where they were one of the major
modifiers on mixed coarse beaches.
In Boston Harbor, the large no-macrobiota and transition-zone assemblages
found on the glacial till islands are the product of a number
of biotic and abiotic interactions, but may be largely attributed to thermal
stress. Bertness (1989) found that barnacles on unburied, small
stones had significantly higher core body temperatures than those on
larger boulders because the small stones heated up more quickly and
were significantly warmer during daytime low tides. High temperatures
stressed the barnacles, severely limiting recruit survivorship. In Boston
Harbor, a similar pattern was noted. Barnacles and fucoids, which typically
dominated middle and upper intertidal hard substrate, could often
be found on large boulders or rocky outcroppings surrounded by mixed
coarse substrate, but were absent on the mixed coarse substrate itself.
It appeared that the large boulders and bedrock insulated the attached
organisms from the high temperatures associated with air exposure at
low tide (Bertness 1989).
In the low intertidal, Mytilus edulis was present and covered the largest
aerial extent of any assemblage on the islands (Table 4). Blue mussels
are known to modify their habitat, forming stable reefs which restrict substrate
movement, increase sedimentation, provide refuge, and help control
temperature and light conditions (Seed 1996). It is highly probable that in
the Mytilus reef assemblages the reduced thermal stress due to increased
emersion time and larger substrate mass combined with the stable structure
provided a viable habitat for the recruitment and growth of a range of organisms
in the low intertidal (Suchanek 1978).
186 Northeastern Naturalist Vol. 12, Special Issue 3
Among the glacial till islands, there were also several differences between
the protected inner islands and the more exposed middle islands. In
the low intertidal on the protected islands, Mytilus reefs were surrounded
by fine sediment and varied widely in their species richness. Some were
thriving communities, while others lacked algae and epifauna, and others
were simply Mytilus shells held together with byssal threads. Storm
events have been shown to move fine sediment on top of reefs, in some
cases killing organisms within the mussel matrix and in the most extreme
cases smothering the mussels themselves (Landahl 1988). These events
can be quite localized and could account for the spatial heterogeneity in
species richness on mussel reefs in Boston Harbor.
Patches of Spartina alterniflora and other estuarine plants were
present in the upper intertidal zone throughout Boston Harbor and
were found on 15 of the 21 islands we mapped. In Narragansett Bay,
these fringe marshes were found to stabilize the substrate, decrease
wave action, increase sediment deposition, and enable seeds of other
plant species to emerge (Bruno and Kennedy 2000). The patches varied
in stability such that species richness increased with patch size.
Likewise we found that small fringe marshes were almost entirely
composed of Spartina alterniflora, while large patches which were
only found on the more protected islands (Worlds End, Raccoon,
Slate, and Thompson Island) often had Spartina patens, Salicornia,
Limonium, and other marsh plants growing landward of the S. alterniflora.
Fringe marshes are common intertidal assemblages in Boston
Harbor, and their extent and species composition appear to be good
indicators of shoreline stability.
The outer islands were largely composed of bedrock and large boulders
and had different assemblages than the other islands (Figs. 5 and 6).
Outer Brewster, Little Brewster, and Calf, as well as most of the other
outer islands which were not mapped in detail, were primarily composed
of rock/boulder mixed (zonation and no zonation) assemblages.
The mixed zonation assemblage describes the classic Stephenson and
Stephenson (1972) rocky intertidal banding pattern: barnacles in the
high intertidal, fucoids in the mid-intertidal, and Chondrus/red algae in
the low intertidal. We found this assemblage on a number of islands, but
also found areas that were composed of the same organisms, but were
not organized into clear zones. Due to the presence of barnacles and
algae in the upper and mid-intertidal, it appeared that thermal stress was
reduced and that other factors such as wave exposure, competition for
space, and predation played a larger role in shaping the species distribution
on these islands.
The varied topography may also account for some of the inconsistencies
in the classic zonation pattern. The shape of the substrate can be
very important for determining which biotic and abiotic factors control a
2005 R. Bell, R. Buchsbaum, C. Roman, and M. Chandler 187
specific area. Narrow openings can magnify wave action increasing the
potential for physical disturbance, while small cracks can serve as refuge
from wave action, predators, and the sun. The size, quantity, and quality of
refuge space also have a large impact on the particular types of species that
can utilize it and, therefore, impact a particular microhabitat.
Non-native and invasive species
Non-native and invasive species have assumed dominant roles in
defining the species composition and structure of marine and intertidal
habitats throughout New England (Bertness 1999, Carlton 1989, Harris
and Tyrrell 2001, Pederson 1999). Based on our 1-year survey, non-native
species and those of cryptogenic (undetermined) origins comprised
over 20% of the species present in the Boston Harbor Islands. The green
crab (Carcinus maenus), an introduced species originally from Europe,
has been common in New England for a century or more (Bertness
1999). It occurs in almost all intertidal habitats in Boston Harbor, from
mudflats to salt marsh to rocky tide pools and is a major predator on
small “seed” clams and periwinkle snails.
The common periwinkle (Littorina littorea), by far the most abundant
herbivore in the intertidal zone of the Boston Harbor Islands,
was first recorded in New England in the 1800s (Wares et al. 2002).
Recent genetic evidence suggests that the likely origin of L. littorea
that presently inhabit New England is the Gulf of St. Lawrence area
of eastern Canada, where it survived the last period of continental
glaciation in an unglaciated refugia (Wares et al. 2002). By selectively
grazing on certain species of macroalgae, this snail has the
ability to alter the species composition and structure of a wide range
of intertidal community types (Bertness 1984).
Recent non-native invaders commonly observed on most islands
during our surveys include the ascidians, Botrylloides violaceous
(Pacific colonial sea squirt), Styela clava (Pacific rough sea squirt),
and Botryllus schlosserei (golden star tunicate). B. violaceous and S.
clava have been present in New England waters only since the 1970s
(Osman and Whitlatch 1999). B. violaceous is one of the most common
encrusting marine organisms in the low intertidal zone and is
possibly out-competing barnacles and seaweeds for space in this habitat.
B. violaceous also encrusts eelgrass blades in the subtidal zone.
S. clava was very common throughout the Harbor and was found
attached to almost all hard substrate, including Mytilus edulis in the
low intertidal. Botryllus schlosserei was not as common, but was
found frequently on hard substrate.
The Asian shore crab, Hemigrapsus sanguineus, has spread rapidly
into New England from its first invasion point in New Jersey.
In southern New England, it reaches densities of greater than 100/m2
188 Northeastern Naturalist Vol. 12, Special Issue 3
in intertidal cobble habitats (Ledema and O’Connor 2001). Although
we did not encounter it in such abundance in the Boston Harbor Islands,
it is present throughout the Boston Harbor area. On the islands
as elsewhere, H. sanguineus was found predominantly in boulder,
cobble, and gravel habitat. Given the dominance of the mixed coarse
substrate throughout the Boston Harbor Islands (Tables 1 and 3),
there appears to be considerable habitat available for the spread of
this non-native invasive species.
We encountered a number of non-native, invasive seaweeds. Dumontia
contora, a red alga unknown in New England before the 20th
century, was abundant in mid-elevation intertidal pools for much of the
spring and summer. Polysiphonia harveyi, another non-native red alga,
was also a common attached species in the intertidal pools, and Bonnemaisonia
hamifera was frequently encountered in the tidal drift. It is
intriguing that the invasive non-native seaweed, Codium fragile, which
has been recorded at the nearby Northeastern University Nahant Marine
Science Center (1995), the Isles of Shoals (Borror 1994), and on Cape
Cod, was not recorded at the Boston Harbor Islands during this survey
or a previous survey in the Boston Harbor region (Harris 1974). It seems
that appropriate habitat is available for this green alga to occur within
the Boston Harbor Islands intertidal zone.
Management implications
The spatial distribution and extent of intertidal habitats will change
in response to major natural events (e.g., storms), contaminant spills,
visitor use, commercial and recreational harbor activity, changing fishing
pressure, changing status of harbor water quality, rising sea levels,
and other natural and human-induced activities. Re-mapping all or part
of the 21 islands, at perhaps 5–10-year intervals or after major events,
will assist managers in understanding links between habitat change and
causes of change. Obviously, identification of such linkages will be
greatly facilitated by simultaneous monitoring of Harbor water quality
(see Rex et al. 2002), boating activity, visitor use patterns, and other
relevant factors.
Continued examination of the islands for additional intertidal species
will provide a more complete database for comparison of the species
richness of the islands with those of nearby areas. Such surveys can
also be useful in identifying new invasive species that may be a threat
to the islands as well as identifying species that may be of conservation
interest. The intertidal inventory presented in this paper is a communitylevel
data set that can be used at this scale as a baseline from which to
assess the response of the intertidal zone to natural and human-induced
processes and activities associated with an urban coastal ecosystem.
2005 R. Bell, R. Buchsbaum, C. Roman, and M. Chandler 189
Acknowledgments
Larry Harris (University of New Hampshire), Arthur Mathieson (University
of New Hampshire), and Harlan Dean (Harvard Museum of Comparative Zoology)
generously provided their expertise and time in identifying marine organisms,
both in the field and in their laboratories. Scott LeGreca (Harvard University,
Farlow Herbarium) provided information on intertidal lichens. The University of
Massachusetts–Boston provided transportation to the islands on their research vessels.
We thank the generous donation of time by Liz Quinn and Lindsay St. Pierre
of the New England Aquarium. The New England Aquarium also provided some
initial help with GIS, and Outward Bound provided access to Thompson Island.
The Sweet Water Trust and the Sudbury Foundation are gratefully acknowledged
for their support of this study, administered cooperatively by the Island Alliance
and the National Park Service on behalf of the Boston Harbor Islands Partnership.
Literature Cited
Agassiz, E.C., and A. Agassiz. 1865. Seaside Studies in Natural History: Marine
Animals of Massachusetts Bay: Radiates. Ticknor and Fields, Boston, MA.
Bell, R., M. Chandler, R. Buchsbaum, and C. Roman. 2002. Inventory of intertidal
habitats: Boston Harbor Islands, a national park area. Technical Report NPS/
NERBOST/NTR–2004/1, National Park Service, Northeast Region, 15 State
Street, Boston, MA. 138 pp.
Bertness, M.D. 1984. Habitat and community modification by an introduced
herbivorous snail. Ecology 65:370–381.
Bertness, M.D. 1989. Intraspecific competition and facilitation in a northern
acorn barnacle population. Ecology 70:257–268.
Bertness, M.D. 1999. The Ecology of Atlantic Shores. Sinauer Associates, Inc,
Sunderland, MA. 417 pp.
Borror, A.C. 1994. 1995 Check list of flora and fauna of the Isles of Shoals,
Shoals Marine Lab, University of New Hampshire and Cornell University.
Brown, B. 1993. A classification system of marine and estuarine habitats in
Maine: An ecosystem approach to habitats Part 1: Benthic habitat. Maine
Natural Areas Program, Department of Economic and Community Development,
Augusta, ME. 51 pp. plus appendix.
Bruno, J.F., and C.W. Kennedy. 2000. Patch-size dependent habitat modification
and facilitation on New England cobble beaches by Spartina alterniflora.
Oecologia 122:98–108.
Carleton, J.T. 1982. The historical biogeography of Littorina littorina on the Atlantic
coast of North America and implications for the interpretation of the structure
of New England intertidal communities. Malacological Review 15:146.
Carleton, J.T. 1989. Man’s role in changing the face of the ocean: Biological
invasions and implications for conservation of nearshore environments.
Conservation Biology 4:265–273.
Carleton, J. 2003. A checklist of the introduced and cryptogenic marine and
estuarine organisms from Nova Scotia to Long Island Sound. 2nd Edition.
Marine Studies Program, Willams College, Mystic, CT.
Connor, D.W., M.J. Dalkin, T.O. Hill, R.H.F. Holt, and W.G. Sanderson.
1997a. Marine nature conservation review: Marine biotope classification
for Britain and Ireland. Volume 1. Littoral biotopes. Version 97.06. JNCC
Report, No. 229.
190 Northeastern Naturalist Vol. 12, Special Issue 3
Connor, D.W., M.J. Dalkin, T.O. Hill, R.H.F. Holt, and W.G. Sanderson.
1997b. Marine Nature conservation review: Marine biotope classification
for Britain and Ireland. Volume 2. Sublittoral biotopes. Version 97.06.
JNCC Report No. 230.
Cowardin, L.M., V. Carter, F.C. Golet, and E.T. LaRoe. 1979. Classification of
wetland and deepwater habitats of the United States. US Fish and Wildlife
Service, Washington, DC. Technical Report FWS/OBS-79/31. 131 pp.
Dethier, M.N. 1990 A marine and estuarine habitat classification system for
Washington State. Washington Natural Heritage Program., Department of
Natural Resources, Olympia, WA. 56 pp.
Dethier, M.N., E.S. Graham, S. Cohen, L.M. Tear. 1993. Visual versus randompoint
percent cover estimation: “Objective” is not always better. Marine
Ecology Progress Series 96:93–100.
Gauch, H.G. 1982. Multivariate Analysis in Community Ecology. Cambridge
University Press. Cambridge, UK. 298 pp.
Gleason, H.A., and A. Cronquist. 1991. Manual of Vascular Plants of Northeastern
United States and Adjacent Canada. New York Botanical Garden,
New York, NY. 910 pp.
Gould, A.A. 1841. Report on the Invertebrates of Massachusetts Comprising the
Mollusca, Crustacea, Annelida, and Radiata. Folsom, Wells, and Thurston
Publisher, Cambridge, MA.
Gosner, K.L. 1971. Guide to the Identification of Marine and Estuarine Invertebrates.
John Wiley and Sons, Inc., New York, NY.
Gosner, K.L. 1979. A Field Guide to the Atlantic Seashore. Peterson Field Guide
No. 24. Houghton Mifflin Co., Boston, MA. 329 pp.
Harris, L.G. 1974. Field studies on benthic communities in the New England
Offshore Mining Environmental Study (NOMES). Report submitted to Environmental
Research Labs. NOAA.
Harris, L.G., and M.C. Tyrrell. 2001. Changing community states in the Gulf
of Maine: Synergism between invaders, overfishing, and climate change.
Biological Invasions 3:9–21.
Landahl, J.T. 1988. Sediment-level fluctuation in a mussel bed on a “protected”
sand-gravel beach. Estuarine, Coastal and Shelf Science 26:255–267.
Ledesma, M.E., and N.J. O’Connor. 2001 Habitat and diet of the non-native crab
Hemigrapsus sanguineus in southern New England. Northeastern Naturalist
8:63–78.
Lintas, C., and R. Seed. 1994. Spatial variation in the fauna associated with
Mytilus edulis on a wave exposed rocky shore. Journal of Molluscan Studies
60:165–174.
Lubchenco, J. 1978. Plant species diversity in a marine intertidal community:
Importance of herbivore food preference and algal competitive abilities.
American Naturalist 112:23–39.
Lubchenco, J., and B.A. Menge. 1978. Community development and persistence
in a low rocky intertidal zone. Ecological Monographs 59:67–94.
Mathieson, A.C., C.J. Dawes, and E.J. Hehre. 1998. Floristic and zonation studies
of seaweeds from Mount Desert Island, Maine: An historical comparison.
Rhodora 100:333– 379.
2005 R. Bell, R. Buchsbaum, C. Roman, and M. Chandler 191
McCune, B., and M.J. Mefford. 1999. PC-Ord, Multivariate Analysis of Ecological
Data, Version 4. MjM Software Design. Gleneden Beach , OR. 237 pp.
Menge, B.A. 1976. Organization of the New England rocky intertidal community:
Role of predation, competition, and environmental heterogeneity.
Ecological Monographs 46:355–93.
Menge, B.A. 1978. Predation intensity in a rocky intertidal community. Effect
of an algal canopy, wave action, and desiccation on predator feeding rates.
Oecologia 34(1):17–35.
Northeastern University. 1995. Checklist of marine species of Nahant. Marine
Science Center, Northeastern University. Nahant, MA.
Osman, R.W., and R.B Whitlatch. 1999. Ecological interactions of invading
ascidians within epifaunal communities of southern New England. Pp. 164,
In J. Pederson (Ed.). Marine Bioinvasions: Proceedings of the First National
Conference. MIT Sea Grant College Program. MITSG Center for Coastal
Resources, MIT, Cambridge, MA. 427 pp.
Paine, R.T. 1966. Food web complexity and species diversity. American Naturalist
100:65–75 .
Pederson, J. 1999. Marine Bioinvasions. Proceedings of the First National Conference.
MIT Sea Grant College Program, Cambridge, MA. 427 pp.
Pollock, L.W. 1998. A Practical Guide to the Marine Animals of Northeastern
North America. Rutgers University Press. New Brunswick, NJ. 367 pp.
Rex, A.C., D. Wu, K. Coughlin, M. Hall, K.E. Keay, and D.I. Taylor. 2002.
The state of Boston Harbor, Mapping the Harbor’s recovery. Technical
Report No. 2002-09. Massachusetts Water Resources Authority, Boston,
MA. 42 pp.
Ritter, R., and E.L. Lanzer. 1997 Remote Sensing of Nearshore Vegetation in
Washington State’s Puget Sound. In Proceedings of 1997 Geospatial Conference,
Seattle, WA. Department of Natural Resources (DNR), Olympia,
WA. 527 pp.
Roman, C.T., N. Jaworski, F.T. Short, S. Findlay, and R.S. Warren. 2000. Estuaries
of the northeastern United States: Habitat and land use signatures.
Estuaries 23:743–764.
Rosen, P.S., and K. Leach. 1987. Pp. 233–250, In D.M. FitzGerald and P.S.
Rosen (Eds.). Glaciated Coasts. Academic Press, Inc., New York, NY.
Sears, J.R. (Ed.). 1998. NEAS Keys to Benthic Marine Algae of the Northeastern
Coast of North America from Long Island Sound to the Strait of Belle
Isle. Northeast Algal Society, Dartmouth, MA. 161 pp.
Seed, R. 1996. Patterns of biodiversity in the micro-invertebrate fauna associated
with mussel patches on rocky shores. Journal of the Marine Biological
Association of the United Kingdom. Plymouth 76(1):203–210.
Silva, P.C, P.W. Basson, and R.L. Moe. 1996. Catalogue of the Benthic Marine
Algae of the Indian Ocean, Volume 79. University of California Press,
Berkeley, CA.
Sousa, W.P. 1979. Disturbance in marine intertidal boulder fields: The nonequilibrium
maintenance of species diversity. Ecology 60:1225-1239.
South, G.R., and I. Tittley. 1986. A Checklist and Distributional Index of the
Benthic Algae of the North Atlantic Ocean. Huntsman Marine Laboratory
and British Museum (Natural History), St. Andrews, NB, and London,
UK. 76 pp.
192 Northeastern Naturalist Vol. 12, Special Issue 3
Stephens, E.G., and M.D. Bertness. 1991. Mussel facilitation of barnacle survival
in a sheltered bay habitat. Journal of Experimental Marine Biology and
Ecology 145:33–48.
Stephenson, T.A., and Stephenson, A. 1972. Life Between Tidemarks on Rocky
Shores. W.H. Freeman & Co., San Francisco, CA. 439 pp.
Suchanek, T.H. 1978. The ecology of Mytilus edulis in exposed rocky intertidal
communities. Journal of Experimental Marine Biology and Ecology
31:105–120.
Thompson, A.G., J.G. Eastwood, M.G. Yates, R.M. Fuller, R.A. Wadsworth,
and R. Cox. 1998. Airborne remote sensing of intertidal biotopes: BIOTA I.
Marine Pollution Bulletin. 37:164–172.
Vadas, R.L., W.A. Wright, and S.L. Miller. 1990. Recruitment of Ascophyllum
nodosum: Wave action as a source of mortality. Marine Ecology Progress
Series 61:263–272.
Wares, J.P., D.S. Goldwater, B.Y. Kong, and C.W. Cunnngham. 2002. Refuting
a controversial case of a human-mediated marine species introduction. Ecology
Letters 5:577–584.
Weiss, H.M. 1995. Marine animals of southern New England and New York. State
Geological and Natural History Survey of Connecticut Department of Environmental
Protection, Hartford, CT. Bulletin 115 1995, ISBN0-942081-06-4.
Wentworth, C.K. 1922. Scale of grade and class terms for clastic sediments.
Journal of Geology 30:377.
Whitlatch, R.B. 1982. The ecology of New England tidal flats: A community
profile. FWS/OBS-81/01. US Fish and Wildlife Service, Washington, DC.
2005 R. Bell, R. Buchsbaum, C. Roman, and M. Chandler 193
Appendix A. Animals recorded in the Boston Harbor intertidal zone.
Phylum Class Order Family Genus and species Nativity
Porifera Calcarea Leucosoleniid Leucosoleniidae Leucosolenia botryoides (Ellis & Solander) Cryptogenic
Desmospongiae Halichondrida Halichondriidae Halichondria panicea (Pallas) Native
Halichondria bowerbanki (Burton) Introduced
Haplosclerida Haliclonidae Haliclona loosanoffi(Hartman) Native
Cnidaria Anthozoa Actinaria Haliplanellidae Diadumene luciae (Verrill) Introduced
Metridiidae Metridium senile (Linnaeus) Native
Hydrozoa Hydroida Campanulariidae Obelia sp.
Clavidae Clava multicornis (Forsskal) Native
Eudendriidae Eudendrium dispar (L. Agassiz) Native
Sertulariidae Sertularia pumila Cryptogenic
Tubulariidae Ectopleura larynx (Ellis & Solander) Cryptogenic
Ectopleura crocea (L. Agassiz) Native
Scleractinia Hydractiniidae Hydractinia echinata (Flemming) Native
Nemertea Anopla Heteronemerte Lineidae Lineus ruber (Muller) Native
Enopla Hoplonemertea Amphiporidae Amphiporus angulatus (Muller) Native
Entoprocta Barentsiidae Barentsia laxa (Kirkpatrick) Native
Ectoprocta Gymnolaemata Cheilostomata Bugulidae Bugula simplex (Hincks) Cryptogenic
Bugula turrita (Desor) Native
Calloporidae Callopora aurita (Hincks) Native
Cryptosulidae Cryptosula pallasiana (Moll) Cryptogenic
Electridae Electra pilosa (Linnaeus) Native
Hippothoidae Hippothoa hyalina (Linnaeus) Native
Membraniporidae Membranipora membranacea (Linnaeus) Introduced
Schizoporellidae Schizoporella unicornis (Johnston) Native
Ctenostomata Alcyonidiidae Alcyonidium polyoum (Hassall)
Vesiculariidae Bowerbankia gracilis (Leidy) Cryptogenic
194 Northeastern Naturalist Vol. 12, Special Issue 3
Phylum Class Order Family Genus and species Nativity
Ectoprocta Gymnolaemata Cyclostomata Crisiidae Crisia eburnea (Linnaeus) Native
Sipuncula Sipunculidae Phascolopsis gouldi (Pourtales) Native
Mollusca Bivalva Myoida Myidae Mya arenaria (Linnaeus) Native
Mytiloida Mytilidae Mytilus edulis (Linnaeus) Native
Geukensia demissa (Dillwyn) Native
Ostreoida Anomiidae Anomia aculeata (Gmelin) Native
Ostreidae Ostrea edulis (Linnaeus) Introduced
Veneroida Pharidae Ensis directus (Conrad) Native
Cephalopoda Teuthida Loliginidae Loligo sp. Native
Genus (Lamark)
Gastropoda Neogastropod Muricidae Nucella lapillus (Linnaeus) Native
Neotaenioglos Calyptraeidae Crepidula fornicata (Linnaeus) Native
Crepidula plana (Say) Native
Littorinidae Littorina obtusata (Linnaeus) Native
Lacuna vincta (Montagu) Native
Littorina saxatilis (Olivi) Native
Littorina littorea (Linnaeus) Native
Nudibranchia Onchidorididae Onchidoris fusca (Muller) Native
Onchidoris muricata (Muller) Native
Acanthodoris pilosa (Abildgaard) Native
Polyceratidae Polycera lessonii (Orbigny) Native
Patellogastrop Lottiidae Acmaea testudinalis (Muller) Native
Annelida Oligochaeta Haplotaxida Enchytraeidae Marionina southerni (Cernosvitov) Native
Tubificidae Phallodrilus monospermathecus (Knollner) Native
Peloscolex benedeni (Udekem) Native
Polychaeta Aciculata Nereididae Hediste diversicolor (O.F. Muller) Native
Phyllodocidae Eteone longa (Fabricius) Native
2005 R. Bell, R. Buchsbaum, C. Roman, and M. Chandler 195
Phylum Class Order Family Genus and species Nativity
Annelida Polychaeta Aciculata Polynoidae Lepidonotus squamatus (Linnaeus) Cryptogenic
Clitellio arenarius (Muller) Native
Polynoidae Harmothoe imbricata (Linnaeus) Cryptogenic
Ariciida Orbiniidae Leitoscoloplos fragilis (Verrill) Native
Leitoscoloplos robustus (Verrill) Native
Canalipalpata Amphictenidae Pectinaria granulata (Linnaeus) Native
Pectinaria gouldi (Verrill) Native
Cirratulidae Chaetozone setosa (Malmgren) Native
Serpulidae Spirorbis borealis (Daudin) Native
Spionidae Polydora cornuta (Bosc) Native
Streblospio benedicti (Webster) Native
Spio setosa (Verrill) Native
Terebellidae Polycirrus eximius (Leidy) Native
Capitellida Capitellidae Capitella capitata (Fabricius) Native
Maldanidae Clymenella torquata (Leidy) Native
Arthropoda Crustacea Isopoda Idoteidae Idotea balthica (Pallas) Native
Janiridae Jaera marina (Fabricius) Cryptogenic
Amphipoda Aoridae Microdeutopus gryllotalpa (Costa) Native
Corophiidae Corophium volutator (Pallas) Introduced
Gammaridae Gammarus mucronatus (Say) Native
Gammarus oceanicus (Segerstrale) Native
Melita nitida (Smith) Native
Decapoda Cancridae Cancer borealis (Stimpson) Native
Cancer irroratus (Say) Native
Grapsidae Hemigrapsus sanguineus (De Haan) Introduced
Nephropidae Homarus americanus (H. Milne-Edwards) Native
Paguridae Pagurus acadianus (Benedict) Native
Pagurus longicarpus (Say) Native
196 Northeastern Naturalist Vol. 12, Special Issue 3
Phylum Class Order Family Genus and species Nativity
Arthropoda Crustacea Decapoda Portunidae Carcinus maenas (Linnaeus) Introduced
Thoracica Archaeobalanidae Semibalanus balanoides (Linnaeus) Native
Thoracica Balanidae Balanus crenatus (Bruguiere) Native
Pagurus longicarpus (Say) Native
Portunidae Carcinus maenas (Linnaeus) Introduced
Thoracica Archaeobalanidae Semibalanus balanoides (Linnaeus) Native
Balanidae Balanus crenatus (Bruguiere) Native
Insecta Collembola Hypogastruridae Anurida maritime (Laboulbene) Native
Echinodermata Asteroidea Forcipulatida Asteriidae Asterias vulgaris (Verrill) Native
Asterias forbesi (Desor) Native
Spinulosida Echinasteridae Henricia sanguinolenta (O.F. Mueller) Native
Echinoidea Echinoida Strongylocentroti Strongylocentrotus droebachiensis Native
(O.F. Mueller)
Ophiuroidea Ophiurida Amphiuridae Axiognathus squamatus (Delle Chlaje) Native
Ophiactidae Ophiopholis aculeate (Linnaeus) Native
Chordata Ascidiacea Phlebobranchi Cionidae Ciona intestinalis (Linnaeus) Cryptogenic
Stolidobranchi Styelidae Styela canopus (Stimson) Introduced
Styela clava (Herdman) Introduced
Botryllus schlosseri (Pallas) Introduced
Botrylloides violceous (Oka) Introduced
2005 R. Bell, R. Buchsbaum, C. Roman, and M. Chandler 197
Appendix B. Macroalgae recorded in the Boston Harbor intertidal zone.
Division Order Family Genus and species Nativity
Bacillariophyceae Bacillariales Berkeleya rutilans (Trentepohl) Native
Chlorophyceae Ulvales Monostromaceae Gomontia polyrhiza (Lagerheim) Native
Monostroma oxyspermum (Kurzing) Native
Ulvaceae Blidingia minima (Nageli ex Kutzing) Native
Enteromorpha intestinalis (Linnaeus) Native
Enteromorpha linza (Linnaeus) Native
Enteromorpha prolifera (O.F. Muller) Native
Ulva lactuca (Linnaeus) Native
Prasiolales Prasiolaceae Prasiola stipitata (Suhr ex Jessen) Cryptogenic
Acrosiphoniales Acrosiphoniaceae Spongomorpha arcta (Dillwyn) Kutzing Native
Spongomorpha spinescens (Kutzing) Native
Cladophorales Cladophoraceae Chaetomorpha linum (O.F. Muller) Kutzing Native
Chaetomorpha melagonium (F. Weber & D. Mohr) Kutzing Native
Chaetomorpha picquotiana (Montagne ex Kutzing) Native
Cladophora sericea (Hudson) Kutzing Cryptogenic
Codiales Uncertain Rhizoclonium riparium (Roth) Harvey Native
Rhizoclonium tortuosum (Dilwyn) Kutzing Native
Cyanobacteria Nostocales Oscillatoriaceae Lyngbya majuscula (Dillwyn) Harvey Native
Oscillatoria sp. Native
Genus (Vaucher ex Gomont)
Rivulariaceae Calothrix crustacea Thuret Native
Phaeophyceae Ectocarpales Ectocarpaceae Ectocarpus siliculosus (Dillwyn) Lyngbye Native
Pilayella littoralis (Linnaeus) Kjellman Native
Elachistaceae Elachista fucicola (Velley) Areschoug Native
198 Northeastern Naturalist Vol. 12, Special Issue 3
Division Order Family Genus and species Nativity
Phaeophyceae Chordariales Chordariaceae Chordaria flagelliformis (O.F. Muller) C. Agardh Native
Desmerestiales Desmarestiaceae Desmarestia aculeata (Linnaeus) J.V. Lamouroux Native
Dictyosiphonales Uncertain “Ralfsia bornetii” Kuckuck Native
Dictyosiphonaceae Dictyosiphon foeniculaceus (Hudson) Greville Native
Scytosiphoaceae Petalonia fascia (O.F. Muller) Kuntze Native
Ralfsia verrucosa (Areschoug) Areschoug Native
Scytosiphon lomentaria (Lyngbye) Link Native
Laminariales Laminariaceae Laminaria saccharina (Linnaeus) J.V Lamouroux Native
Alariaceae Alaria esculenta (Linnaeus) Greville Native
Chordaceae Chorda tomentosa (Lyngbye) Native
Laminariaceae Agarum clathratum (Dumortier) Native
Laminaria digitata (Hudson) J.V. Lamouroux Native
Fucales Fucaceae Ascophyllum nodosum (Linnaeus) Le Jolis Native
Fucus distichus edentatus (De La Pylaie) Powell Native
Fucus distichus evanescens (C. Agardh) Powell Native
Fucus spiralis (Linnaeus) Native
Fucus vesiculosus (Linnaeus) Native
Fucus vesiculosus forma mytilii Native
Rhodophyceae Compsopogonales Erythropeltidaceae Erythrotrichia carnea (Dillwyn) J. Agardh Native
Bangiales Bangiaceae Bangia atropurpurea (Roth) C. Agardh Native
Porphyra leucosticta (Thuret) Native
Porphyra purpurea (Roth) C. Agardh Native
Porphyra umbilicalis (Linnaeus) Kutzing Native
Bonnemaisoniales Bonnemaisoniaceae Bonnemaisonia hamifera (Hariot) Introduced
Palmariales Palmariaceae Palmaria palmata (Linnaeus) Kuntze Native
Hildenbrandiales Hildenbrandiaceae Hildenbrandia prototypes Native
2005 R. Bell, R. Buchsbaum, C. Roman, and M. Chandler 199
Division Order Family Genus and species Nativity
Corallinales Corallinaceae Clathromorphum Native
Corallina officinalis (Linnaeus) Native
Lithothamnion glaciale (Kjellman) Native
Phymatolithon lenormandii (J.E. Areschoug) W.H. Adey Native
Gigartinales Cystocloniaceae Cystoclonium purpureum (Hudson) Batters Native
Dumontiaceae Dumontia incrassata (O.F. Muller) J.V. Lamouroux Introduced
Gigartinaceae Chondrus crispus (Stackhouse) Native
Kallymeniaceae Callocolax neglectus (F. Schmitz ex Batters) Native
Euthora cristata (C. Agardh) J. Agardh Native
Petrocelidaceae “Petrocelis cruenta” (J. Agardh) Native
Mastocarpus stellatus (Stackhouse) Guiry Native
Phyllophoraceae Gymnogongrus crenulatus (Turner) J. Agardh Native
Phyllophora pseudoceranoides Native
(S.G. Gmelin) Newroth & A.R.A.
Ahnfeltiales Ahnfeltiaceae Ahnfeltia plicata (Hudson) Fries Native
Rhodymeniales Champiaceae Lomentaria clavellosa (Turner) Gaillon) Introduced
Ceramiales Ceramiaceae Ceramium rubrum (C. Agardh) Native
Delesseriaceae Phycodrys rubens (Linnaeus) Batters Native
Rhodomelaceae Polysiphonia harveyi (J. Bailey) Introduced
Polysiphonia lanosa (Linnaeus) Tandy Native
Rhodomela confervoides (Hudson) P.C. Silva Native
Xanthophyceae Vaucheriales Vaucheriaceae Vaucheria sp. Native
Genus (De Candolle)
200 Northeastern Naturalist Vol. 12, Special Issue 3
Appendix C. Vascular plants recorded in the Boston Harbor intertidal zone.
Family Genus and species Nativity
Asteraceae Solidago sempervirens (L.) Native
Chenopodiaceae Suaeda maritima (L.) Dumort Native
Salicornia europaea (L.) Native
Atriplex patula (L.) Introduced
Juncaceae Juncus gerardi (Loisel) Native
Lythraceae Lythrum salicaria (L.) Native
Plumbaginaceae Limonium carolinianum (Walt.) Britt. Native
Poaceae Spartina patens (Ait.) Muhl. Native
Spartina alterniflora (Loisel) Native
Puccinellia maritima (Huds.) Parl. Native
Phragmites australis (Cav.) Trin. ex Steud. Introduced genotype
Distichlis spicata (L.) Greene Native
Agrostis stolonifera (L.) Native
Agropyron repens (L.) Beauv. Native
Ruppiaceae Ruppia maritima (L.) Native


 The Northeastern Naturalist is a peer-reviewed journal that covers all aspects of natural history within northeastern North America. We welcome research articles, summary review papers, and observational notes.