Soil and Biota of Serpentine: A World View
2009 Northeastern Naturalist 16(Special Issue 5):21–38
Variation of Morphology and Elemental
Concentrations in the California Nickel
Hyperaccumulator Streptanthus polygaloides
(Brassicaceae)
Robert S. Boyd1,*, Michael A. Wall2, Scott R. Santos3,
and Michael A. Davis4
Abstract - The Ni hyperaccumulator Strepthanthus polygaloides (Brassicaceae)
is one of a handful of Ni hyperaccumulators known from continental North
America. Surveys have revealed four distinctive morphs of this species, relying
primarily on floral traits (sepal color and shape): a purple sepal morph (P),
a yellow sepal morph (Y), a morph in which sepals start yellow and mature to
purple (Y/P), and a morph with light yellow undulate sepals (U). In this study,
we raised plants from ten populations (five Y, three P, one Y/P, and one U) under
uniform greenhouse conditions to determine if morphs varied in morphology and
elemental concentrations when grown on Ni-amended potting soil in a common
garden. Morphological data included measurements of leaf form (length, width,
and degree of lobing) and plant size (height to first flower as they bolted in summer).
Phenology was documented by noting flowering timing of plants. Elemental
concentrations of plants were also determined for nine elements (Ca, Cu, Fe, K,
Mg, Mn, Ni, P, and Zn). All morphological/phenological traits measured varied
significantly between at least some morphs. The U and Y/P morphs were larger
than Y and P morphs, with larger leaves as well. Leaves of U morph plants had
wide sinuses and shallow lobes, whereas Y/P plants had narrow sinuses and long
narrow lobes. P morph plants were shortest in stature, with the smallest leaves.
Morphs also varied significantly in concentrations of all elements except Fe. All
populations hyperaccumulated Ni, but the P morph contained significantly greater
Ni levels than the other three morphs. The P morph also had more Mg, and less
Mn and P, than the other morphs. The U morph had more K and Zn, but less Ca,
than the other morphs. Principal components analysis revealed all four morphs to
be distinctive from one another, and also suggested both morphological/phenological
and elemental differences between Y morph populations along a north–south
gradient. We conclude that there is considerable genetic divergence between
morphs. If additional information shows that morphs are reproductively isolated,
then these morphs may require taxonomic subdivision.
1Department of Biological Sciences, Auburn University, Auburn, AL 36849-5407,
USA. 2Entomology Department, San Diego Natural History Museum, PO Box
121390, San Diego, CA 92112-1390, USA. 3Department of Biological Sciences and
Cell and Molecular Biosciences Program, Auburn University, Auburn, AL 36849-
5407, USA. 4Department of Biological Sciences, University of Southern Mississippi,
Hattiesburg, MS 39406-5018, USA. *Corresponding author - boydrob@auburn.edu.
22 Northeastern Naturalist Vol. 16, Special Issue 5
Introduction
Serpentine soils are relatively challenging substrates for plant growth
(Brooks 1987). In California, serpentine soils form ecological islands surrounded
by areas of less harsh soils (Harrison and Inouye 2002) and the
serpentine soils host a number of endemic species (Kruckeberg 1984). The
insular nature of these serpentine environments (Harrison et al. 2006) is one
factor that has contributed to the species-rich California floristic province,
recognized as one of 34 global “biodiversity hotspots” (Mittermeier et al.
2005). The flora of these areas includes representatives of many plant types,
including some hyperaccumulator plants.
Hyperaccumulator plants have extraordinarily elevated concentrations
of elements in their aboveground portions. Brooks et al. (1977) defined
Ni hyperaccumulation as a plant tissue level of at least 1000 μg Ni/g (on a
dry-mass basis). Most Ni hyperaccumulators grow on serpentine soils and,
although there are more than 300 Ni hyperaccumulators known worldwide
(Baker et al. 2000), the serpentine soils of California host only two Ni hyperaccumulator
species (Kruckeberg and Reeves 1995). These are two members
of the Brassicaceae: Thlaspi montanum L. (Alpine Pennycress; sometimes
split into several species or subspecies that each hyperaccumulate Ni) and
Streptanthus polygaloides Gray (Milkwort Jewelflower).
The genus Streptanthus is found only in North America and contains
about 40 species (Kruckeberg 1984), a number of which are endemic to serpentine
soils. One of these serpentine endemics, which also is endemic to
California, is S. polygaloides. This species has been recognized as being
unique within the genus based upon its flower structure. As evidenced by its
specific epithet, Greene (1904) pointed out that the flower structure of
the species was unlike that of a crucifer, being reminiscent of flowers of the
genus Polygala (Polygalaceae). He suggested separating S. polygaloides
into a separate monotypic genus (Microsemia). Arthur Kruckeberg, who has
studied members of the genus (Kruckeberg 1957, 1958, 1969), stated that S.
polygaloides was quite different from other species in the genus, and that
attempts to hybridize it with other species in the genus had failed (Arthur
Kruckeberg, University of Washington, Seattle, pers. comm.). Reeves et al.
(1981) pointed out that the hyperaccumulation of Ni in S. polygaloides was
another unique trait within Streptanthus, and pointed out that the hyperaccumulation
trait supported recognition of Microsemia polygaloides.
Streptanthus polygaloides grows only along the western side of the Sierra
Nevada in California (Reeves et al. 1981). It is an unusual hyperaccumulator
species in that it is an annual, whereas almost all other species reported
to hyperaccumulate metals are perennial (Reeves and Baker 2000). Nickel
concentrations of field-grown plants range from 1100 to 16,400 μg/g dry
mass in leaves, stems, roots, flowers, and fruits (Reeves et al. 1981).
During field studies of the high-Ni insect Melanotrichus boydi Schwartz
and Wall (Heteroptera: Miridae), which is monophagous on S. polygaloides
(Wall and Boyd 2006), we have noted considerable variation in
2009 R.S. Boyd, M.A. Wall, S.R. Santos, and M.A. Davis 23
S. polygaloides. One striking and variable feature is the color of the sepals
(Kruckeberg 1984), which are large compared to the petals and contribute
most to the showy nature of the flowers. On the basis of our field observations
(Wall and Boyd 2006), we have divided blooming S. polygaloides
populations into four morphs in the field. These are: 1) a yellow sepal
morph (Y); 2) a purple (rose) sepal morph (P); 3) a yellow-to-purple sepal
morph (Y/P); and 4) a cream/yellow undulate sepal morph (U). These
morphs are illustrated in Figure 1 and described in more detail below.
The four morphs differ in their geographic extent, with the Y and P
morphs most widespread geographically and the Y/P and U morphs occupying
very small ranges. The Y morph is most widespread, ranging from
serpentine sites in Butte County in the north to Mariposa County in the
south. We have noted the P morph at higher elevation (more eastern) sites in
the northern portion of the range of S. polygaloides, from Sierra County to
southern Placer County. The two other morphs are (to our knowledge) much
more geographically restricted. The Y/P morph is unusual in that flower buds
are yellow, but as a flower matures the sepals change color to purple (hence
our “yellow-to-purple” name for this morph; Fig. 1). The precise relationship
between floral maturation and color change has not been studied, but the
color change appears to occur during anthesis (Fig. 1). We have found this
morph only at one serpentine area at the border of Tuolumne and Mariposa
counties. Farther north, in Tuolumne County, and farther south along the
same band of serpentine in Mariposa County, we have found the Y morph.
Finally, there is a relatively isolated serpentine area (Alexander et al. 2007)
in Fresno County at which we have found the U morph. Flowers of these
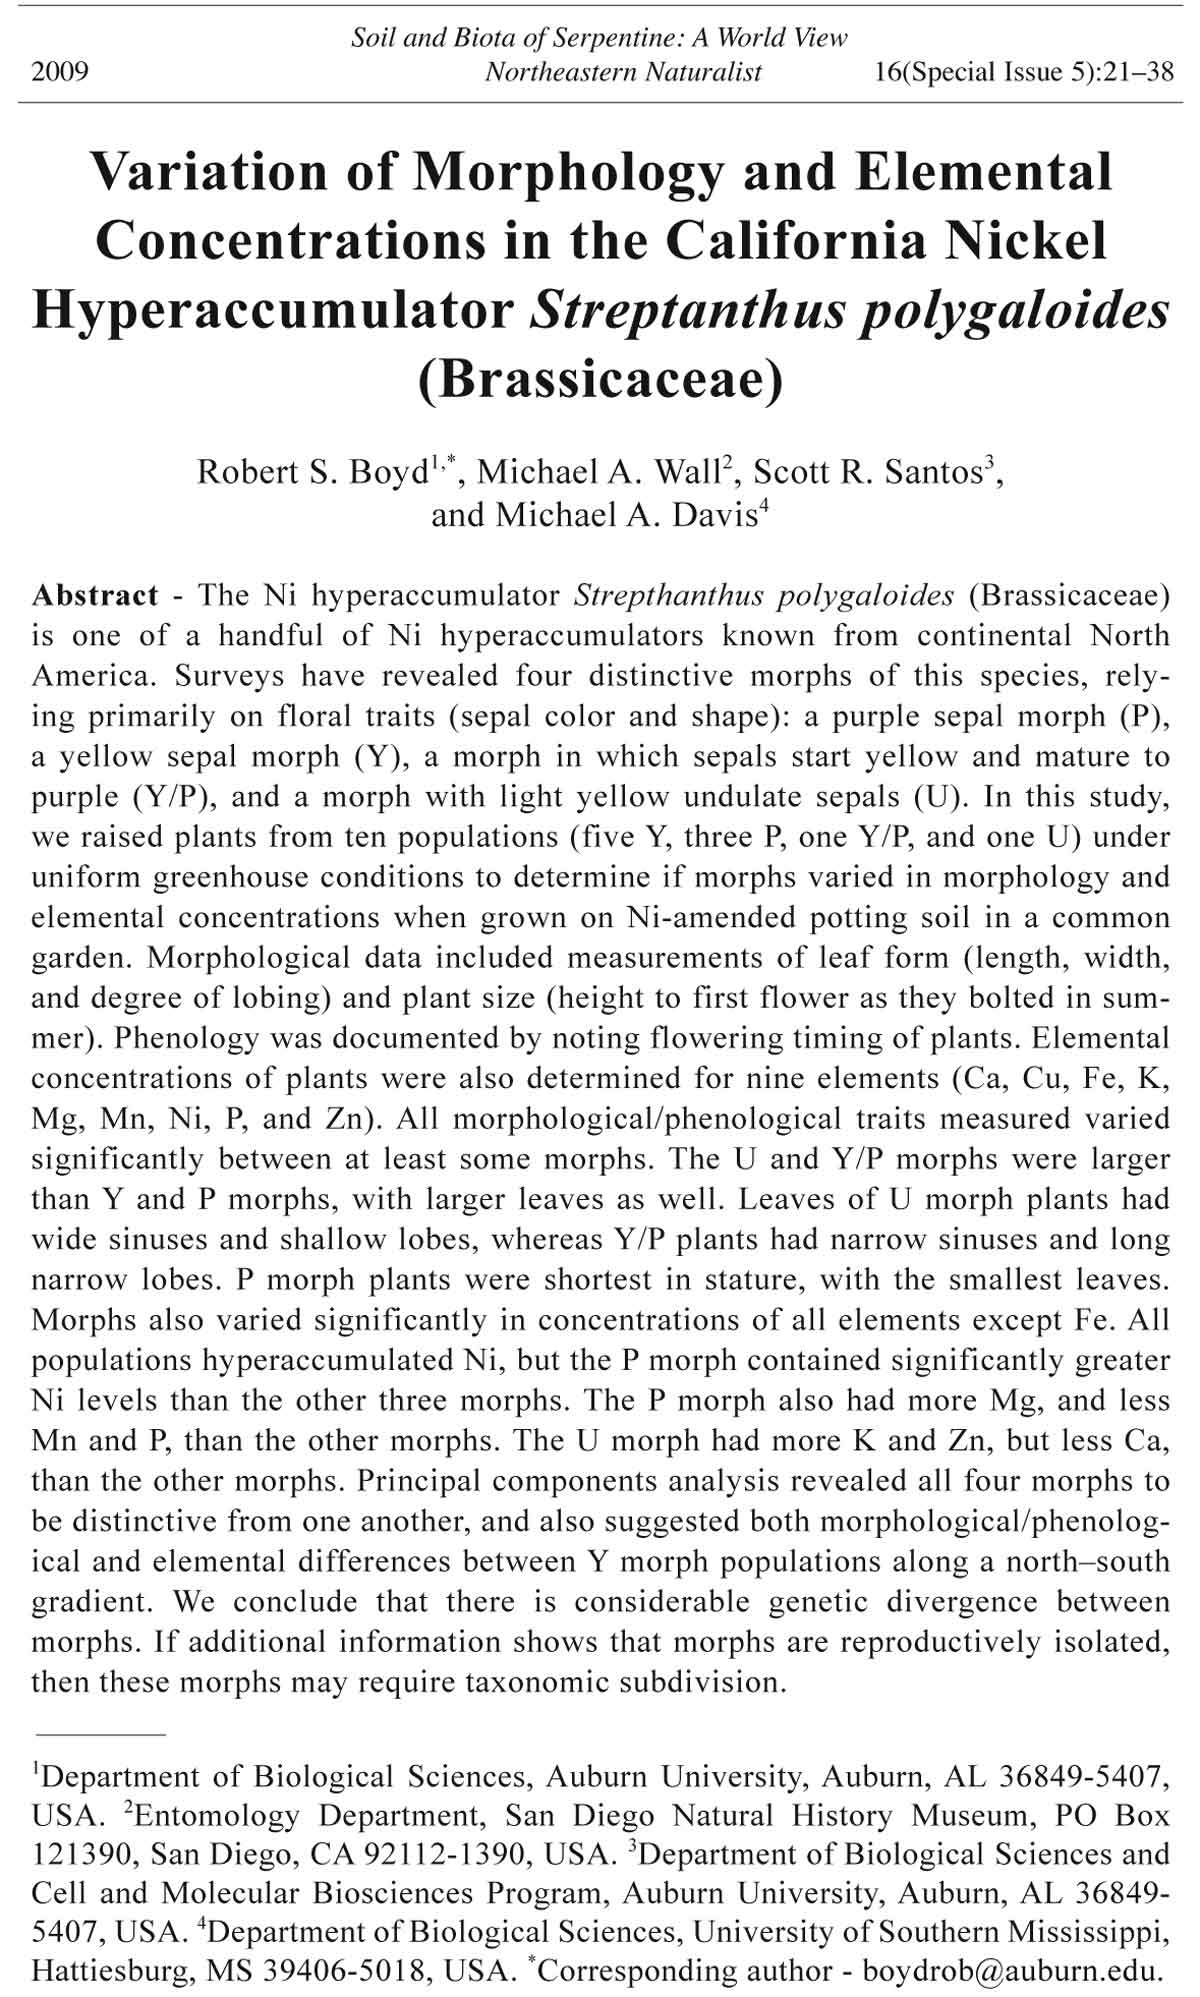
Figure 1. Photographs of the four morphs of S. polygaloides, as noted in a prior field
study (Wall and Boyd 2006), and investigated in our common garden experiment.
Arrows in each photo indicate the sepals of the flowers. A: yellow (Y) morph, B:
purple (P) morph, C: yellow-to-purple (Y/P) morph (note that arrows point out both
immature yellow and mature purple sepals), and D: undulate (U) morph. Photographs
are not to the same scale, but illustrate the sepal color and shape of the morphs investigated
in this study.
24 Northeastern Naturalist Vol. 16, Special Issue 5
plants are light yellow (tending to cream) and the sepals are more undulate,
giving the flowers a “frilly” appearance (Fig. 1).
The variation observed in S. polygaloides in the field may be due to
genotypic or environmental factors. Common garden experiments are one
method used to differentiate between these sources of variation in plant
traits (Linhart and Grant 1996). In this paper, we report results of a common
garden experiment designed to determine if these S. polygaloides morphs
vary in morphological characteristics and element concentrations (including
Ni hyperaccumulation ability) when grown in a uniform environment. This
study provides an initial test of the hypothesis that there are genetic differences
between the four morphs.
Methods
We collected seeds from 10 populations of S. polygaloides during the summer
of 2001. Populations sampled (Table 1) included five Y populations and
three P populations. Because their currently known geographic range is restricted,
only one population each of the Y/P and U morphs was included in the
experiment. Individuals with ripe fruits growing at least 1 m apart were collected
and individually bagged, so that all seeds within a bag were half-sib families.
Seeds from at least 19 individuals were collected from each population.
The common garden experiment was conducted in the spring and summer
of 2002. High-Ni soil was made by amending Pro-Mix (Premier Horticulture,
Red Hill, PA, USA) with powdered NiCl2 (Sigma, St. Louis, MO,
USA) to about 800 ppm Ni (on a dry weight basis). This concentration was
achieved by adding 3.2 g of dried powdered NiCl2 per 14 L of potting soil.
For comparison, Kruckeberg and Reeves (1995) reported that Ni levels of
Table 1. Streptanthus polygaloides populations represented in the greenhouse common garden
experiment. Population name abbreviations used in Figure 2b, d, and f are provided in parentheses
following each population name.
Population name County Latitude/Longitude Elevation (m)
Yellow (Y) morph
Concow (C) Butte 39°47ʹ54.01ʺN/121°29ʹ15.61ʺW 835
Grass Valley (GV) Nevada 39°13ʹ28.33ʺN/121°03ʹ02.56ʺW 790
Marshall Road (MR) El Dorado 38°50ʹ31.68ʺN/120°52ʹ40.76ʺW 550
Red Hills (RH) Tuolumne 37°50ʹ27.00ʺN/120°28ʹ08.53ʺW 370
Bagby (B) Mariposa 37°36ʹ48.71ʺN/120°08ʹ22.08ʺW 300
Purple (P) morph
Goodyear’s Bar (GB) Sierra 39°32ʹ26.41ʺN/120°52ʹ58.42ʺW 820
Washington Road (WR) Nevada 39°21ʹ34.32ʺN/120°48ʹ30.21ʺW 810
Sugar Pine (SP) Placer 39°07ʹ36.18ʺN/120°47ʹ07.46ʺW 1100
Yellow-to-purple (Y/P) morph
County Line (CL) Tuolumne 37°45ʹ15.08ʺN/120°15ʹ04.92ʺW 680
Undulate (U) morph
Trimmer (T) Fresno 36°52ʹ42.40ʺN/119°17ʹ25.67ʺW 330
2009 R.S. Boyd, M.A. Wall, S.R. Santos, and M.A. Davis 25
the serpentine soils they sampled from California Streptanthus sites (including
several species besides S. polygaloides) ranged from 1060 to 4620 ppm,
using a strong acid (HF/HNO3) extraction technique.
Soil was placed into 10-cm square pots and topped with a layer of perlite.
Pots were divided into rows (blocks) of ten, and a vial of seeds from
each population was selected for sowing into that block. Seed vials to be
sowed into that block, one from each population, were placed into a bag and
drawn arbitrarily from it as we sowed seeds into pots from the front to the
back of that row. Thus, the position of the representative of each population
varied between rows across the array of pots. The number of seeds sowed in
each pot varied depending on seed availability for each half sib, but generally
ranged from 25–100 seeds/pot. Plants were grown under ambient light
conditions (beginning on 28 February 2002 and ending in mid-July 2002) at
a greenhouse complex at Auburn University in Lee County, AL. Pots were
watered twice daily and fertilized with an NPK fertilizer once in mid-April.
We thinned pots between 40 and 45 days after plants were sown, cutting the
smaller plants from each pot to leave 4–7 plants growing in each.
We collected both phenological and morphological information from
this experiment. Phenology was documented by noting flowering timing
of plants. The date that the first open flower was produced was recorded
for each pot. Some plants had not bloomed at the time the experiment was
terminated, in mid-July. Pots of these plants were given the termination date
as their flowering date. Flowering time was calculated as time in days since
seeds were sown at the start of the experiment. We also measured plant size
by measuring the height from the soil surface to the first flower of the tallest
flowering plant in each pot.
Early in our experiment, we noted substantial variation in leaf form
between populations. To our knowledge, this feature has not received study
in prior work on this species (Greene 1904, Reeves et al. 1981). Therefore,
we collected morphometric data that reflected leaf form (length, width, and
metrics reflecting the depth and width of leaf lobes). Specifically, leaf form
variables were measured on the two largest plants in each pot 35 days after
seeds were sown (in two cases, only one plant was present and so only one
measurement was taken). Leaves of S. polygaloides are lobed but vary in
lobe size; in some cases, leaves are deeply divided. On each of the two largest
plants in each pot, the longest leaf was selected and the following data
were collected: leaf length (total length from leaf base to tip), leaf width
(the largest distance from lobe tip to lobe tip), and sinus width (the distance
from the bottom of one sinus to the bottom of another, across the midrib of
the leaf, taken at the middle of the leaf). We also collected data reflecting
the shape of leaf lobes, which ranged from very narrow and elongate to
more broad. We measured lobe width at the leaf middle (the width of a lobe
halfway from the sinus to the lobe tip) and lobe width at the lobe base (at
the sinus of the leaf). Although we did not directly measure lobe length, we
calculated that from our other measurements, as lobe length is equal to leaf
26 Northeastern Naturalist Vol. 16, Special Issue 5
width minus sinus width, divided by 2. We also calculated several relative
measures of leaf morphology that essentially attempt to factor out differences
due to plant size in order to extract shape relationships. These were
lobe length/leaf width ratio (which relativized lobe size to the width of a
leaf), lobe length/lobe width ratio (which relativized lobe length to width
and thus reflected lobe shape), and relative sinus width (%), which was calculated
as sinus width divided by leaf width times 100%. This latter measure
relativized sinus width to leaf width. For all leaf variables, data from the
two plants in each pot were averaged to generate a single value to represent
that pot in the dataset. Single plants were present in just two of the 240 pots
that produced plants during the experiment. Sample sizes were: 124 for the
yellow morph (25 from Concow, 26 from Grass Valley, 24 from Marshall
Road, 24 from Red Hills, and 25 from Bagby), 74 for the purple morph (24
from Goodyear’s Bar, 25 from Sugar Pine, and 25 from Washington Road),
25 for the undulate morph (Trimmer), and 17 for the yellow-to-purple morph
(County Line).
We also collected the aboveground parts of several plants from most pots
(excepting pots with too few plants) for elemental analysis. Tests of plants
from all populations with filter paper impregnated with dimethylglyoxime,
which generates a semi-quantitative measure of Ni concentrations (Reeves
1992), showed that all plants hyperaccumulated Ni, but we suspected that the
degree of hyperaccumulation might vary between populations. We thinned
pots between 40 and 45 days after plants were sown, cutting the smaller
plants from each pot to leave 4–7 plants growing in each. Pots with five or
fewer plants were not harvested (these were 17% of the total number of pots
that produced plants in the experiment). Sample sizes were: 117 for the yellow
morph (26 from Concow, 23 from Grass Valley, 25 from Marshall Road,
22 from Red Hills, and 21 from Bagby), 56 for the purple morph (18 from
Goodyear’s Bar, 23 from Sugar Pine, and 15 from Washington Road), 26
for the undulate morph (Trimmer), and 14 for the yellow-to-purple morph
(County Line). Thinnings were placed into paper sacks and dried at 60 °C
for several days.
Element analysis
Samples (thinnings) were finely ground, dry-ashed at 485 °C, additionally
oxidized in 1 M HNO3, and the residues dissolved in 1 M HCl. We
analyzed concentrations of nine elements: the macronutrients Ca, K, and
P, as well as the heavy metals Cu, Fe, Mg, Mn, Ni, and Zn. An inductively
coupled argon plasma spectrometer (Jarrell-Ash, ICAP 9000) was used to
determine concentrations of all elements except Ni. Nickel concentrations
were determined using an atomic absorption spectrophotometer (Instrumentation
Laboratory, IL 251).
Statistical analysis
Our main objective was to determine if plants of the various morphs and/
or populations differed significantly from each other in this common garden
2009 R.S. Boyd, M.A. Wall, S.R. Santos, and M.A. Davis 27
setting. We first used one-way analysis of variance (ANOVA) to test whether
each variable differed significantly among the morphs. If a significant influence
of morph was found for a variable, we used Fisher’s protected least
significant difference (PLSD) test to determine which morphs significantly
differed from others for that variable. Additionally, principal components
analysis (PCA) was used to: 1) determine which variable(s) best explained
variance between morphs and/or populations, and 2) visualize relationships
among morphs and/or populations. The PCAs were done on a combined
dataset of 205 samples (pots) for which we had complete information on
both morphological/phenological data and elemental concentrations from
plants from the same pot. Sample sizes were: 111 for the yellow morph (25
from Concow, 23 from Grass Valley, 22 from Marshall Road, 22 from Red
Hills, and 19 from Bagby), 55 for the purple morph (17 from Goodyear’s
Bar, 23 from Sugar Pine, and 15 from Washington Road), 25 for the undulate
morph (Trimmer), and 14 for the yellow-to-purple morph (County Line). For
the PCAs, quantitative variables (morphological variation (MV), elemental
concentration (EC) and a combined (MV+EC) dataset) were assessed by
qualitative categories (floral traits [FT] or populations [POP]), along with
the 95% confidence levels of categorical placements. These analyses were
conducted with the package FactoMineR v1.10 (Lê et al. 2008) in the R
v2.8.1 statistical software environment (R Development Core Team 2008).
Results
Morphological/phenological data
Morphs significantly varied in all measured traits (ANOVA, P < 0.05).
Post-hoc means separations of plant height data (Table 2) showed that
plants of U and Y/P morphs were taller than Y morph plants, and that P
morph plants were the smallest of all morphs. A similar size pattern was
also found for leaf length, with U and Y/P plants having the longest leaves,
Y plants with shorter leaves, and P morph plants with the shortest leaves
(Table 2). The pattern for leaf width was slightly different, with Y/P morph
plants having the widest leaves, leaves of U and Y morph plants being intermediate
in width, and P morph plants with the narrowest leaves. Scaling leaf
length to width, by using a length/width ratio and thus relativizing them,
revealed high values for all but the P morph plants (Table 2), the leaves of
which were shown to be more rounded in outline by this measure.
Features of leaves that reflected the degree of blade dissection also varied
significantly between morphs (Table 2). Leaves of the U morph were
least dissected, as revealed by several measurements. The width of the blade
from the sinus on one side of the blade to the sinus on the other side (sinus
width) was greatest for U morph plants, intermediate for the P morph, and
least for Y and Y/P plants. Lobe width was also greater in U plants and least
in Y/P plants, although the pattern was slightly different for P and Y plants
depending on where lobe width was measured (Table 2). For lobe width
measured at the middle of a leaf (lobe width middle; Table 2), P plants
28 Northeastern Naturalist Vol. 16, Special Issue 5
were equally wide as U plants, with Y plants intermediate between those
morphs and Y/P plants. For lobe width measured at the bottom of the lobe
(lobe width bottom; Table 2), there was a clear hierarchy of widths, with
U plants the widest, followed in order by P, Y, and Y/P plants. Lobe length
also reflected the more dissected nature of Y/P morph leaves, which had the
longest lobes, followed in order by Y, P, and U plants (Table 2). Scaling lobe
length to leaf width and lobe width showed a similar ranking of morphs.
Lobe length/leaf width ratios, which reflect the relative length the lobe (and
thus are large values for deeply dissected leaves), were greatest for Y/P and
Y plants, intermediate for P plants, and least for U plants. Lobe length/lobe
width middle ratios, which reflect the shape of the lobes (broad or narrow),
showed Y/P plants with the greatest values (having long, narrow lobes),
Y plants with wider lobes, and P and U plants with relatively broad lobes.
Relative sinus width (%), which scaled sinus width to leaf width, showed
the same order of morphs as sinus width when width was measured directly
in millimeters (Table 2). The U morph had the largest sinus width (44%),
the P morph an intermediate value (31%), and equally narrow sinus widths
(<15%) were found for both Y and Y/P morphs.
Elemental analysis
Elemental concentrations varied significantly among morphs for all
elements except Fe (Table 3). The P morph had significantly different
concentrations of four of the nine elements when compared to the other
Table 2. Morphological traits and flowering time (means with SE in parentheses) of S. polygaloides
morphs documented in the greenhouse common garden experiment. All traits differed
significantly among morphs (ANOVA, P < 0.05). Lettered superscripts indicate significant
differences between morph means (Fisher’s PLSD test, P < 0.05). Sample sizes were: 124 for
the yellow morph, 74 for the purple morph, 25 for the undulate morph and 17 for the yellowto-
purple morph.
Morph
Yellow-to-purple
Trait measured Purple (P) Yellow (Y) (Y/P) Undulate (U)
Plant size/phenology
Height to first flower (cm) 19C (0.62) 29B (0.65) 48A (2.5) 47A (1.3)
Time to first open flower (days) 90B (1.3) 92B (1.3) 102A (1.6) 99A (1.1)
Leaf size/form
Leaf length (mm) 35C (0.84) 46B (0.94) 55A (2.3) 51A (1.8)
Leaf width (mm) 9.3C (0.16) 10B (0.24) 12A (0.69) 10B (0.33)
Sinus width (mm) 2.8B (0.13) 1.3C (0.065) 0.96C (0.025) 4.5A (0.33)
Lobe width middle (mm) 2.6A (0.078) 1.4B (0.047) 0.85C (0.035) 2.4A (0.13)
Lobe width bottom (mm) 3.1B (0.12) 1.4C (0.062) 0.90D (0.041) 3.5A (0.22)
Lobe length (mm) 3.2C (0.083) 4.5B (0.13) 5.5A (0.35) 3.0C (0.21)
Leaf size/form ratios
Leaf length/leaf width 3.9B (0.12) 4.6A (0.088) 4.9A (0.30) 5.0A (0.21)
Lobe length/leaf width 0.69B (0.013) 0.86A (0.012) 0.92A (0.007) 0.57C (0.032)
Lobe length/lobe width middle 1.3C (0.045) 3.5B (0.15) 6.8A (0.61) 1.3C (0.11)
Relative sinus width 31B (1.3) 14C (1.2) 8.5C (0.69) 44A (3.2)
(% of leaf width)
2009 R.S. Boyd, M.A. Wall, S.R. Santos, and M.A. Davis 29
three morphs. Nickel values were greatest for P plants and less for the
other morphs. Highest values of Mg were also found for the P morph, with
intermediate levels in Y plants and lowest values in Y/P and U plants.
Plants of the P morph also had the least concentrations of P (phosphorus)
and Mn compared to the other morphs.
Several other differences between morphs were also revealed (Table 3).
The U morph had significantly higher or lower concentrations than all
other morphs for three of the nine elements examined. The U morph had
significantly greater levels of Zn than all other morphs. This morph also
had the most K, with P and Y morphs intermediate, and the Y/P morph
having the least. Calcium levels were highest in P and Y morphs, intermediate
in the Y/P morph, and least in the U morph. The Y/P morph was
significantly higher or lower than all other morphs for only one element
(K), for which it had the least concentration (Table 3). The Y morph had
no elements for which it had greater or lesser concentrations than all other
morphs. A difference among morphs in Cu concentration was also documented,
although the morphs did not separate clearly from one another in
the post-hoc test (Table 3).
Principal components analysis (PCA)
Consistent with the ANOVAs, all morphs were significantly distinguishable
by morphological variation or elemental concentration in one or both
dimensions of the PCA (Figs. 2a–d). For morphological/phenological traits,
the first and second dimensions explained 46.8% and 17.5%, respectively,
of variability among the morphs (Fig. 2a). In this case, the variable which
best described the first dimension was relative sinus width, while that of the
second dimension was leaf length, both of which were significantly different
Table 3. Elemental concentrations (dry mass basis, means with SE in parentheses) of plants of
the four S. polygaloides morphs grown in the greenhouse common garden experiment. Superscripts
denote elements for which ANOVA revealed significant differences among morphs (P <
0.05): means for morphs with different superscripts are significantly different (Fisher’s PLSD
test, P < 0.05). Sample sizes were: 117 for the yellow morph, 56 for the purple morph, 26 for
the undulate morph, and 14 for the yellow-to-purple morph.
Morph
Yellow-to-purple
Element Purple (P) Yellow (Y) (Y/P) Undulate (U)
Macronutrients
Ca (%) 3.08A (0.054) 3.16A (0.044) 2.65B (0.099) 2.11C (0.061)
K (%) 2.26B (0.15) 2.08B (0.13) 1.38C (0.21) 3.59A (0.072)
P (%) 0.515B (0.025) 0.800A (0.025) 0.795A (0.050) 0.791A (0.032)
Heavy metals
Cu (μg/g) 5.34C (0.996) 4.55C (0.798) 6.86B,C (3.16) 10.2A,B (1.19)
Fe (μg/g) 73.3 (13.7) 57.5 (4.30) 61.2 (8.54) 43.3 (7.16)
Mg (μg/g) 4620A (150) 3580B (70) 2520C (120) 3600C (90)
Mn (μg/g) 88.4B (3.15) 116A (3.53) 111A (8.42) 111A (5.92)
Ni (μg/g) 9030A (236) 7630B (150) 7500B (454) 7500B (343)
Zn (μg/g) 743B (21.9) 725B (20.1) 662B (51.7) 859A (29.5)
30 Northeastern Naturalist Vol. 16, Special Issue 5
Figure 2a. Principal components analysis (PCA) of MV × FT (morphological variation
[quantitative variable] by floral traits [qualitative category]). Filled symbols
signify morph type and represent barycentres (i.e., means) of samples’ placement
within particular morph categories, with 95% confidence levels within a category
given by ellipses.
Figure 2b. Principal components analysis (PCA) of MV × POP (morphological variation
[quantitative variable] by populations [qualitative category]). Filled symbols
signify morph type and represent barycentres (i.e., means) of samples’ placement
within population categories (see Table 1 for population codes), with 95% confidence
levels within a category given by ellipses. Colors in Figure 2b reflect floral morph of
each population as shown in legend for Figure 2a.
2009 R.S. Boyd, M.A. Wall, S.R. Santos, and M.A. Davis 31
Figure 2c. Principal components analysis (PCA) of EC × FT (elemental concentration
[quantitative variable] by floral traits [qualitative category]). Filled symbols signify
morph type and represent barycentres (i.e., means) of samples’ placement within
particular morph categories, with 95% confidence levels within a category given by
ellipses.
Figure 2d. Principal components analysis (PCA) of EC × POP (elemental concentration
[quantitative variable] by populations [qualitative category]). Filled symbols
signify morph type and represent barycentres (i.e., means) of samples’ placement
within population categories (see Table 1 for population codes), with 95% confidence
levels within a category given by ellipses. Colors in Figure 2d reflect floral morph of
each population as shown in legend for Figure 2c.
32 Northeastern Naturalist Vol. 16, Special Issue 5
Figure 2e. Principal components analysis (PCA) of MV+EC × FT (combined morphological
variation and elemental concentration [quantitative variable] by floral
traits [qualitative category]). Filled symbols signify morph type and represent
barycentres (i.e., means) of samples’ placement within population categories, with
95% confidence levels within a category given by ellipses.
across the four morph categories (Fig. 2a; Supplementary Table 1: available
online at https://www.eaglehill.us/nena/nena-suppl-files/n16sp5-Boyd-s1,
and for BioOne subscribers at http://dx.doi.org/10.1656/N811bb.s1).
Elemental concentration also distinguished the morphs, with Zn and Ni, and
Mg and Ni, being the variables which best described the first and second
dimensions, respectively (Supplementary Table 1: available online at
https://www.eaglehill.us/nena/nena-suppl-files/n16sp5-Boyd-s1, and for
BioOne subscribers at http://dx.doi.org/10.1656/N811bb.s1). Here, the
first and second dimensions explained 28.5% and 19.3%, respectively, of the
variability among morphs.
Morphological variation and elemental concentration also distinguished
populations within the four morphs, particularly among Y and P plants
(Figs. 2b,d). For example, two and three distinct clusters of Y populations
are apparent based on morphological and phenological traits and elemental
concentration, respectively (Fig. 2b). Likewise, while P populations
formed a tight and overlapping cluster when only morphological variation
was considered (Fig. 2b), two groups were discernable based on elemental
concentration (Fig. 2d). While the single-population U and Y/P plants
tended to segregate from Y and P populations (Figs. 2b,d), the elemental
concentration of the County Line (CL) Y/P population overlapped with two
Y populations (Marshall Road [MR] and Bagby [B]: Fig. 2d). Interestingly,
variation in morphological/phenological traits (Fig. 2b) as well as elemental
2009 R.S. Boyd, M.A. Wall, S.R. Santos, and M.A. Davis 33
Figure 2f. Principal components analysis (PCA) of MV+EC × POP (combined
morphological variation and elemental concentration [quantitative variable] by
populations [qualitative category]). Filled symbols signify morph type and represent
barycentres (i.e., means) of samples’ placement within population categories (see
Table 1 for population codes), with 95% confidence levels within a category given
by ellipses. Colors in Figure 2f reflect floral morph of each population as shown in
legend for Figure 2e.
concentration (Fig. 2d) in Y and P plants appears to show a geographical arrangement,
with populations from similar latitudes (Table 1) arranged in a
north to south manner along the second PCA dimension.
Analysis of the combined morphological variation and elemental concentration
datasets produced similar patterns to those discussed above.
Specifically, the first and second dimensions explained 30.1% and 14.5%,
respectively, of variability among the morphs (Fig. 2e). Here, the morphological/
phenological trait relative sinus width and the elemental concentrations of
Mg, K, and Ni were the variables that best described the first dimension, with
height to first flower and K and P concentrations best describing the second
dimension (Supplementary Table 1). At the population level, U and Y/P plants
were distinct from those of Y and P, with plants from the latter two morphs
subdividing into 2–3 distinguishable populations or clusters (Fig. 2f).
Discussion
Analysis of morphological and phenological features of the four S. polygaloides
morphs showed differences between them in a common garden setting.
In general, the U and Y/P morph plants were larger than Y and P morph plants,
with larger leaves (Table 2). On the other hand, U and Y/P morphs differed
greatly from each other in degree of leaf lobing. Leaves of U morph plants had
wide sinuses and shallow lobes, whereas Y/P plants had very narrow sinuses
34 Northeastern Naturalist Vol. 16, Special Issue 5
and long narrow lobes. Comparison of Y and P morph plants, which were best
represented in the dataset due to their wider geographic ranges, showed differences
between them in plant height and leaf lobe characteristics (sinus width,
lobe width, lobe length, and the ratios measured). We conclude that the four
morphs of S. polygaloides differ from one another in traits other than the floral
ones that we used to initially define these morphs (Wall and Boyd 2006).
Elemental analysis also showed significant variation among the morphs.
The P morph had significantly more Ni and Mg, and less P and Mn, than other
morphs, while the U morph had more Zn and K, and less Ca, than other morphs
(Table 3). These differences support the suggestion that these morphs differ
physiologically from each other, as shown by their differing responses to the
same growth conditions.
The PCAs supported the above results, showing that the morphs were
distinct from one another in both morphological/phenological (Fig. 2a) and
elemental traits (Fig. 2c). The PCA of the combined morphological/phenological
and elemental datasets showed clear separation of the four morphs
from one another (Fig. 2e). The PCAs also allowed us to explore variation
within the Y and P morphs, as multiple populations of those morphs were
included in the study. We found Y morph populations separated into two or
three clusters along a north–south geographic axis (Figs. 2b,d,f), showing
that additional variability occurs within the Y morph. The P morph populations
showed greater consistency in their morphological/phenological traits
and clustered together closely in Fig. 2b, but we found marked divergence of
the GB population from the other two in elemental concentrations (Fig. 2d).
These findings suggest that Y and P morphs may be subdivided further upon
more detailed study, perhaps reflecting isolation and divergence of these
populations on the patchy serpentine habitats of the western Sierra Nevada
(Alexander et al. 2007).
Two of the morphs we studied (the U and Y/P morphs) are, to our knowledge,
extremely limited in geographic distribution. The Y/P morph’s floral
color change suggested it was intermediate (perhaps as a hybrid) between the
Y and the P morphs, yet that was not supported by the morphological and elemental
data. For example, plants of the Y/P morph were taller than either the
P or the Y morphs and had the narrowest leaf lobes of all morphs studied. They
also were not intermediate between P and Y morphs in element concentrations
(Table 3). Placement of the Y/P population in the PCAs (Figs. 2b,d,f) also
showed it was not intermediate between the Y and P populations in PC space.
Thus, our data suggest this morph is not a hybrid between Y and P morphs. Genetic
sequence data would be very helpful in testing this question.
The other geographically limited morph is the U morph, which is found
in the Kings River serpentine locality (Alexander et al. 2007). This serpentine
area is separated from the nearest northern serpentine area by about 70
km (Alexander et al. 2007). The geographic isolation of this serpentine area,
which to our knowledge is the southern-most locality of S. polygaloides, suggests
an opportunity for genetic isolation and thereafter divergence from the
2009 R.S. Boyd, M.A. Wall, S.R. Santos, and M.A. Davis 35
other (more northern) S. polygaloides populations. We found the U morph to
be relatively distinctive both morphologically and in elemental composition
(Figs. 2b,d,f) relative to the more common Y and P morphs. Again, genetic
sequence data may be able to resolve the evolutionary relationship between
the relatively isolated U morph and the other morphs of S. polygaloides.
While differences in elemental make-up of these plants could result from
genetic differentiation between the morphs, it also may have an ecological
function. For example, hyperaccumulated Ni has been suggested as an
elemental plant defense against natural enemies (see review in Boyd 2007).
If this is the case, and Ni level is positively correlated with risk of attack by
natural enemies, the P morph’s greater ability to hyperaccumulate Ni may
reflect a greater risk from natural enemies in those populations. It is also possible
that the P morph has a greater Ni uptake ability due to other ecological
factors, such as lower available Ni levels in the higher-elevation (Table 1)
serpentine soils of P morph populations.
Our experiment showed that these four morphs are different in both morphological
traits and elemental composition when grown in a greenhouse
common garden. These differences, along with the varying floral traits used
to define the morphs, indicate genetic divergence between the populations
represented in our study (Linhart and Grant 1996). If breeding barriers
genetically isolate these morphs from one another, then these morphs probably
should be considered biological species. Unfortunately, we do not yet
know if these morphs hybridize under either laboratory or field conditions.
Currently, no cases where these morphs are sympatric have been observed,
suggesting that biological and/or geographic barriers in the field may prevent
natural hybridization. We note that greenhouse-grown S. polygaloides does
not spontaneously set seed, implying that pollinators are required for sexual
reproduction. Thus, the differing floral traits of these morphs may be due to
their association with differing pollinators, and this variation in pollinators
may result in barriers to hybridization even if sympatry occurs. The relationships
of these morphs to each other, and to other Streptanthus taxa, may be
clarified by study of chloroplast or nuclear DNA sequences. Initial work by
Mayer and Soltis (1994) placed S. polygaloides within the genus as sister to
S. tortuosus, but that study used a single low-elevation S. polygaloides population
from El Dorado County (that, based on our current knowledge of the
ranges of these morphs, was the yellow morph). Inclusion of other morphs
in such studies would be helpful to determine if they should be recognized
as separate taxa.
If one or more morphs are recognized as separate taxa, the question of
their taxonomic level (varieties? species?) will need to be considered. As
we noted in the Introduction, S. polygaloides is distinctive enough within
the genus Streptanthus that Greene (1904) suggested it be moved to the
monotypic genus Microsemia. Reeves et al. (1981), when they discovered
S. polygaloides was the only Ni hyperaccumulator in the genus (and one of
only several Ni hyperaccumulators in continental North America), suggested
36 Northeastern Naturalist Vol. 16, Special Issue 5
this distinctive biochemical trait supported recognition of Microsemia. As
we pointed out above, Mayer and Soltis (1994) suggested S. polygaloides
occupies a phylogenetic position within Streptanthus based on chloroplast
DNA sequences, so that varietal level recognition would be congruent with
their molecular results. In addition, since we report here that all four morphs
hyperaccumulate Ni, and no other species of Streptanthus does (Kruckeberg
and Reeves 1995, Reeves et al. 1981), the hyperaccumulation trait further
suggests a relatively close relationship among the four morphs. This result
also suggests future recognition of morphs, if warranted by the additional
studies described above, at the varietal rather than species rank.
Our results also have relevance for the applied use of S. polygaloides for
phytomining of Ni. Phytomining is the use of a hyperaccumulator plant to
remove metal from soil so it can be recovered from the biomass (Pilon-Smits
and Freeman 2006). Nicks and Chambers (1998) conducted a study with the
Y morph (at the Red Hills site, which was one of our sources of Y morph
seeds; Table 1) to examine the economic feasibility of using S. polygaloides
to extract Ni from serpentine soils. Our study showed that P morph plants
contained significantly more Ni than plants of other morphs when grown on
soil of the same Ni concentration, indicating that P morph plants may be a
better choice for phytomining. However, we also found that plants of this
morph are the smallest (in terms of height to first flower, leaf length, and
leaf width; Table 2). If those size data indicate that P morph plants have less
biomass than other morphs, then the decreased biomass may counter the
positive effect of the greater Ni concentration in P morph biomass. Certainly,
our results do show that there is significant variation among populations of S.
polygaloides, and this variation may justify actions to protect and conserve
those potentially valuable genetic resources (Whiting et al. 2004).
Acknowledgments
We wish to thank Guest Editor Susan Lambrecht and two anonymous reviewers
for suggestions and comments on an earlier version of this manuscript. Portions of
this research were accomplished when the first author was Mellon Visiting Scholar
at Rancho Santa Ana Botanic Garden, Claremont, CA.
Literature Cited
Alexander, E.B., R.G. Coleman, T. Keeler-Wolf, and S.P. Harrison. 2007. Serpentine
Geoecology of Western North America: Geology, Soils, and Vegetation. Oxford
University Press, New York, NY, USA.
Baker, A.J.M., S.P. McGrath, R.D. Reeves, and J.A.C. Smith. 2000. Metal hyperaccumulator
plants: A review of the ecology and physiology of a biological resource
for phytoremediation of metal-polluted soils. Pp. 85–107, In N. Terry and
G.S. Bañuelos (Eds.). Phytoremediation of Contaminated Soil and Water. CRC
Press, Boca Raton, fl, USA. 389 pp.
Boyd, R.S. 2007. The defense hypothesis of elemental hyperaccumulation: Status,
challenges, and new directions. Plant and Soil 293:153–176.
Brooks, R.R. 1987. Serpentine and its Vegetation: A Multidisciplinary Approach.
Dioscorides Press, Portland, OR, USA.
2009 R.S. Boyd, M.A. Wall, S.R. Santos, and M.A. Davis 37
Brooks, R.R., J. Lee, R.D. Reeves, and T. Jaffré, T. 1977. Detection of nickeliferous
rocks by analysis of herbarium specimens of indicator plants. Journal of Geochemical
Exploration 7:49–77.
Greene, E.L. 1904. Certain West American cruciferae. Leaflets of Botanical Observation
and Criticism 1:81–90.
Harrison, S. and B.D. Inouye. 2002. High β diversity in the flora of Californian serpentine
“islands.” Biodiversity and Conservation 11:1869–1876.
Harrison, S., H.D. Safford, J.B. Grace, J.H. Viers, and K.F. Davies. 2006. Regional
and local species richness in an insular environment: Serpentine plants in California.
Ecological Monographs 76:41–56.
Kruckeberg, A.R. 1957. Variation in fertility of hybrids between isolated populations
of the serpentine species, Streptanthus glandulosus Hook. Evolution
11:185–211.
Kruckeberg, A.R. 1958. The taxonomy of the species complex, Strepthanthus glandulosus
Hook. Madroño 14:217–248.
Kruckeberg, A.R. 1969. Soil diversity and the distribution of plants with examples
from western North America. Madroño 20:137–154.
Kruckeberg, A.R. 1984. California Serpentines: Flora, Vegetation, Geology, Soils,
and Management Problems. University of California Press, Berkeley, CA, USA.
Kruckeberg, A.R., and R.D. Reeves. 1995. Nickel accumulation by serpentine species
of Streptanthus (Brassicaceae): Field and greenhouse studies. Madroño
42:458–469.
Lê, S., J. Josse, and F. Husson. 2008. FactoMineR: An R package for multivariate
analysis. Journal of Statistical Software 25:1–18.
Linhart, Y.B., and M.C. Grant. 1996. Evolutionary significance of local genetic differentiation
in plants. Annual Review of Ecology and Systematics 27:237–277.
Mayer, M.S., and P.S. Soltis. 1994. The evolution of serpentine endemics: A chloroplast
DNA phylogeny of the Streptanthus glandulosus complex (Cruciferae).
Systematic Botany 19:557–574.
Mittermeier, R.A., P.R. Gil, M. Hoffman, J. Pilgrim, T. Brooks, C.G. Mittermeier, J.
Lamoreux, and G.A.B. da Fonseca. 2005. Hotspots Revisited: Earth’s Biologically
Richest and Most Threatened Terrestrial Ecoregions. University of Chicago
Press, Chicago, IL, USA.
Nicks, L.J., and M.F. Chambers. 1998. A pioneering study of the potential for phytomining
of nickel. Pp. 313–325, In R.R. Brooks (Ed.). Plants that Hyperaccumulate
Heavy Metals: Their Role in Phytoremediation, Microbiology, Archaeology,
Mineral Exploration, and Phytomining. CAB International, Wallingford, UK.
Pilon-Smits, E.A.H., and J.L. Freeman. 2006. Environmental cleanup using plants:
Biotechnological advances and ecological considerations. Frontiers in Ecology
and Environment 4:203–210.
R Development Core Team. 2008. R: A language and environment for statistical
computing. R Foundation for Statistical Computing, Vienna, Austria. Available
online at http://www.R-project.org.
Reeves, R.D. 1992. The hyperaccumulation of nickel by serpentine plants. Pp.
252–277, In A.J.M. Baker, J. Proctor, and R.D. Reeves (Eds.). The Vegetation of
Ultramafic (Serpentine) Soils. Intercept, Andover, UK.
Reeves, R.D. and A.J.M. Baker. 2000. Metal-accumulating plants. Pp. 193–229, In I.
Raskin and B.D. Ensley (Eds.). Phytoremediation of Toxic Metals: Using Plants
to Clean Up the Environment. John Wiley and Sons, New York, NY, USA.
38 Northeastern Naturalist Vol. 16, Special Issue 5
Reeves, R.D., R.R. Brooks, and R.M. Macfarlane. 1981. Nickel uptake by Californian
Streptanthus and Caulanthus with particular reference to the hyperaccumulator
S. polygaloides A. Gray (Brassicaceae). American Journal of Botany
68:708–712.
Wall, M.A., and R.S. Boyd. 2006. Melanotrichus boydi (Heteroptera: Miridae) is
a specialist on the nickel hyperaccumulator Streptanthus polygaloides (Brassicaceae).
Southwestern Naturalist 51:481–489.
Whiting, S.N., R.D. Reeves, D. Richards, M.S. Johnson, J.A. Cooke, F. Malaisse, A.
Paton, J.A.C. Smith, J.S. Angle, R.L. Chaney, R. Ginocchio, T. Jaffré, R. Johns,
T. McIntyre, G.W. Purves, D.E. Salt, H. Schat, F.J. Zhao, and A.J.M. Baker. 2004.
Research priorities for conservation of metallophyte biodiversity and their potential
for restoration and site remediation. Restoration Ecology 12:106–116.


 The Northeastern Naturalist is a peer-reviewed journal that covers all aspects of natural history within northeastern North America. We welcome research articles, summary review papers, and observational notes.