Northeast Natural History Conference 2011: Selected Papers
2012 Northeastern Naturalist 19(Special Issue 6):101–114
Coefficients of Conservatism for the Vascular Flora of
New York and New England: Inter-state Comparisons and
Expert Opinion Bias
Jason T. Bried1,2, Kerry L. Strout3, and Theresa Portante3,*
Abstract - The floristic quality index is a widely used method for ecological condition
assessments in the United States. The foundation of the index is the conservatism concept,
which estimates a species’ ecological sensitivity or propensity to occur in areas
least altered by humans. Plant species are assigned coefficients of conservatism (CoC)
where ruderal and exotic species receive the lowest scores, competitors and matrix species
intermediate scores, and remnant-dependent species the highest scores. The method
has spread to over half of the United States, but New York and New England still lack
CoC coverage. With funding from the Environmental Protection Agency and using nine
of the region’s most experienced botanists, an effort was undertaken to select CoC for
the complete vascular flora of each New England state and New York State. Frequency
distributions and rank correlations of CoC varied widely among states, except that each
flora contained a large proportion of exotic species. Few taxa were scored with low confidence,
although CoC at the extreme ends of the scale tended to be scored with higher
confidence than more intermediate CoC. Differences in mean CoC and other summary
measures for two botanists working independently on the same state indicate estimator
bias in the ranking process, and calls for additional expert opinions, more careful instruction,
and calibration of botanists, or the use of objective scoring methods.
Introduction
Human activities cause measurable and often predictable shifts in patterns of
vegetation (Hobbs 1997, Tilman 1999, USEPA 2002), and floristic quality indices
have emerged as a means of quantifying those patterns. Floristic quality assessment
(Swink and Wilhelm 1994, Taft et al. 1997) is a widely used method for
ecological condition assessments in the United States. This species-weighted approach
can help to evaluate restoration and mitigation success, prioritize sites of
conservation interest, and identify high quality natural areas (Herman et al. 1997,
Taft et al. 2006). It can help to define the least-altered conditions needed for restoration
projects (Allison 2002, Bowles and Jones 2006, Cretini et al. 2011, Jog et
al. 2006, Poling et al. 2003), and provides an alternative to relying on high species
richness or presence of rare species to value areas for protection. Floristic quality
assessment is not intended as a stand-alone indicator, but rather should be used in
conjunction with other ecological metrics (e.g., Hargiss et al. 2008, Mack 2007).
The foundation of floristic quality assessment is the conservatism concept
(Wilhelm 1977). Conservatism is an estimate of a species’ ecological sensitivity
1Albany Pine Bush Preserve Commission, 195 New Karner Road, Albany, NY 12205. 2Current
address - Department of Zoology, Oklahoma State University, 501 Life Sciences West,
Stillwater, OK 74078. 3New England Interstate Water Pollution Control Commission, 116
John Street, Lowell, MA 01852. *Corresponding author - TPortante-Lyle@neiwpcc.org.
102 Northeastern Naturalist Vol. 19, Special Issue 6
or propensity to occur in least-altered conditions. The concept is loosely allied
with the competition-stress-disturbance model of plant ecology (Grime 1974),
and therefore derives from colonization and survival strategies and adaptation to
post-disturbance successional stages (Bowles and Jones 2006, Taft et al. 1997).
Species with high conservatism values are sensitive to anthropogenic stress and
therefore restricted to minimally altered natural areas (“remnant-dependent”),
whereas species with lower values are more likely to persist in or readily invade
degraded areas (Spyreas and Matthews 2006). Botanists assign coefficients of
conservatism (CoC) where ruderal and exotic species receive the lowest scores
(integers 0 to 3), competitors and matrix species intermediate scores (4 to 6), and
remnant-dependent species the highest scores (7 to 10) (Andreas and Lichvar
1995). For an area of interest, average conservatism of the complete or representative
species assemblage is used as an estimate of the area’s floristic quality
(Bried and Edinger 2009, Cohen et al. 2004, Ervin et al. 2006, Lopez and Fennessy
2002, Matthews 2003, Miller and Wardrop 2006, Nichols et al. 2006).
Plant species are assigned CoC relative to other species in the local flora
(Taft et al. 1997, Wilhelm and Ladd 1988). Stratifying the assignment by ecologically
meaningful units (ecoregion, habitat type, etc.) may reduce estimator
bias and improve accuracy (Bourdaghs et al. 2006, Cohen et al. 2004, Milburn
et al. 2007), but traditionally, the CoC have been assigned at the scale of an
entire state. State-based rankings at least recognize that, due to varying ecological
tolerance across the species’ range, score validity declines as distance
from the origin of assignment increases (Bourdaghs et al. 2006, Herman et al.
2006, Rothrock and Homoya 2005). Originally developed in the late 1970s to
help assess prairies and open, undeveloped lands in the Lower Lake Michigan
region (Swink and Wilhelm 1979, Wilhelm 1977), the coverage has spread to
over half of the United States (Medley and Scozzafava 2009). With the recent
development of full or partial CoC lists for Delaware, New Jersey, and Pennsylvania,
the idea has caught on in the Mid-Atlantic and Northeast. There remains,
however, a lack of CoC coverage across New York and New England; recent
floristic quality estimates of a rare New York wetland type relied on New Jersey
and Pennsylvania coefficients (Bried and Edinger 2009).
In light of this gap, and the growing interest in using floristic quality assessment
across the region, an effort was undertaken to assign CoC to the complete
vascular flora of New York and New England. This paper documents the project
method and explores major patterns in the aggregate CoC data, testing for differences
in central tendency, variation, and distributional shapes among states and
between botanists. It follows closely a presentation delivered at the 2011 Northeast
Natural History Conference in Albany, NY.
Methods
At its March 2007 meeting, the New England Biological Assessment of
Wetlands Workgroup designated the development of a regional Floristic Quality
Assessment as a priority project. This group, composed of state, federal, and
2012 J.T. Bried, K.L. Strout, and T. Portante 103
academic wetland managers and scientists, has been testing wetland assessment
techniques in the Northeast since its inception in 1998. The New England Interstate
Water Pollution Control Commission, which has supported the Workgroup
by coordinating meetings and workshops on wetland assessment and seeking
additional funds for specialized regional projects, took charge of planning,
implementation, and oversight. Although the project was facilitated by wetlandfocused
organizations and funded by the Environmental Protection Agency’s
wetlands division, the final product is applicable to any non-crop, non-horticultural
plant communities of New York and New England.
A technical advisory committee of state, federal, and academic participants
was formed to assist with the project. The committee released a request for
qualifications seeking botanists to assign CoC to upland, wetland, and coastal
vascular plant species of the New England states and New York State. Proposals
were reviewed and scored by the committee based on technical merit, performance
capability, budget, and timeline. Following this review, New England
Interstate Water Pollution Control Commission partnered with nine of the region’s
most experienced botanists, including Don Schall (Connecticut), Matt
Arsenault and Sue Gawler (Maine), Ted Elliman (Massachusetts), Dan Sperduto
(New Hampshire), Dave Werier and Steve Young (New York), Rick Enser
(Rhode Island), and Art Gilman (Vermont). Each botanist was responsible for
their state of expertise.
An introductory meeting was held to provide background on floristic quality
assessment concepts, set forth instructions and timelines, and distribute preliminary
lists of vascular plant species for each state. Preliminary lists were extracted
from the PLANTS database (http://plants.usda.gov/java/) and later refined by the
botanists using best available sources, such as the New York Flora Atlas (Weldy
and Werier 2011). Botanists were asked to assign CoC according to the basic criteria
in Table 1 and to think about the statewide “average behavior” or ecological
tolerance of each species. For purposes of floristic quality assessment, ecological
tolerance is considered against disturbances and stressors occurring outside
of the environmental variation to which the species is evolutionarily adapted. A
species that needs periodic or annual disturbance (e.g., fire) may still be highly
Table 1. Guiding definitions for coefficients of conservatism (CoC) assigned to the vascular flora
of New York and New England.
CoC Criteria
0 Non-native with wide range of ecological tolerances. Often these are opportunistic of
intact undisturbed habitats.
1 to 2 Native invasive or widespread native that is not typical of (or only marginally typical
of) a particular plant community; tolerant of anthropogenic disturbance.
3 to 5 Native with an intermediate range of ecological tolerances and may typify a stable
native community, but may also persist under some anthropogenic disturbance.
6 to 8 Native with a narrow range of ecological tolerances and typically associated with a
stable community.
9 to 10 Native with a narrow range of ecological tolerances, high fidelity to particular habitat
conditions, and sensitive to anthropogenic disturbance.
104 Northeastern Naturalist Vol. 19, Special Issue 6
conservative (see Taft et al. 1997 for a detailed exposition of these concepts).
Botanists were asked to select CoC using primarily their field experience and
literature knowledge and without consulting other botanists. For each CoC, they
assigned a personal confidence rating from 1 (low) to 5 (high).
A follow-up meeting provided botanists the opportunity to discuss any concerns
about the protocol and specific species, and share their CoC lists. Botanists
then had the opportunity to refine their scores and reconcile any major differences
of opinion (for states with two assigners) before submitting final lists.
Analysis
We graphed frequency distributions and cumulative percent distributions for
the CoC and confidence ranks. Additionally, we compiled statistics of central
tendency (mean, median), dispersion (standard deviation, interquartile range),
and shape (skewness, kurtosis) for the CoC distributions of each state. Spearman’s
rank correlation was used to evaluate associations of CoC assigned to
taxa commonly scored in all states. These analyses were done for all taxa (n =
440, exotics included) and for taxa ranked with confidence of 4 (n = 216); no
taxa commonly scored by all botanists received a confidence rank of 5. To assess
initial estimator bias, a Monte Carlo test was used to compare means, standard
deviations, skewness, and kurtosis (n = number of native taxa) between the two
botanists for Maine and New York. This analysis was performed on the independent
initial scorings by each botanist and not after they discussed their results.
Conservatism coefficients were shuffled between botanists and within rows
(i.e., within taxa) 1000 times using Resampling Stats v4.0 (written by S. Blank,
©2010, Resampling Stats Inc., Arlington, VA). The difference between statistics
was recomputed over randomizations, with significance approximated by how
many pseudo-differences equaled or exceeded the original. We repeated the test
using all native taxa and only the native taxa ranked with full confidence (score
= 5) by both botanists, under an expectation that estimator bias would decrease
with increasing confidence.
Results
A cumulative total of 4511 vascular plant taxa (1437 non-native with ≈1.5%
considered introduced to some states but not others) were scored during this
project and are available online at http://www.neiwpcc.org/wetlands/nebawwg.
asp. The total number of taxa scored by each state ranged from 1556 to 2611.
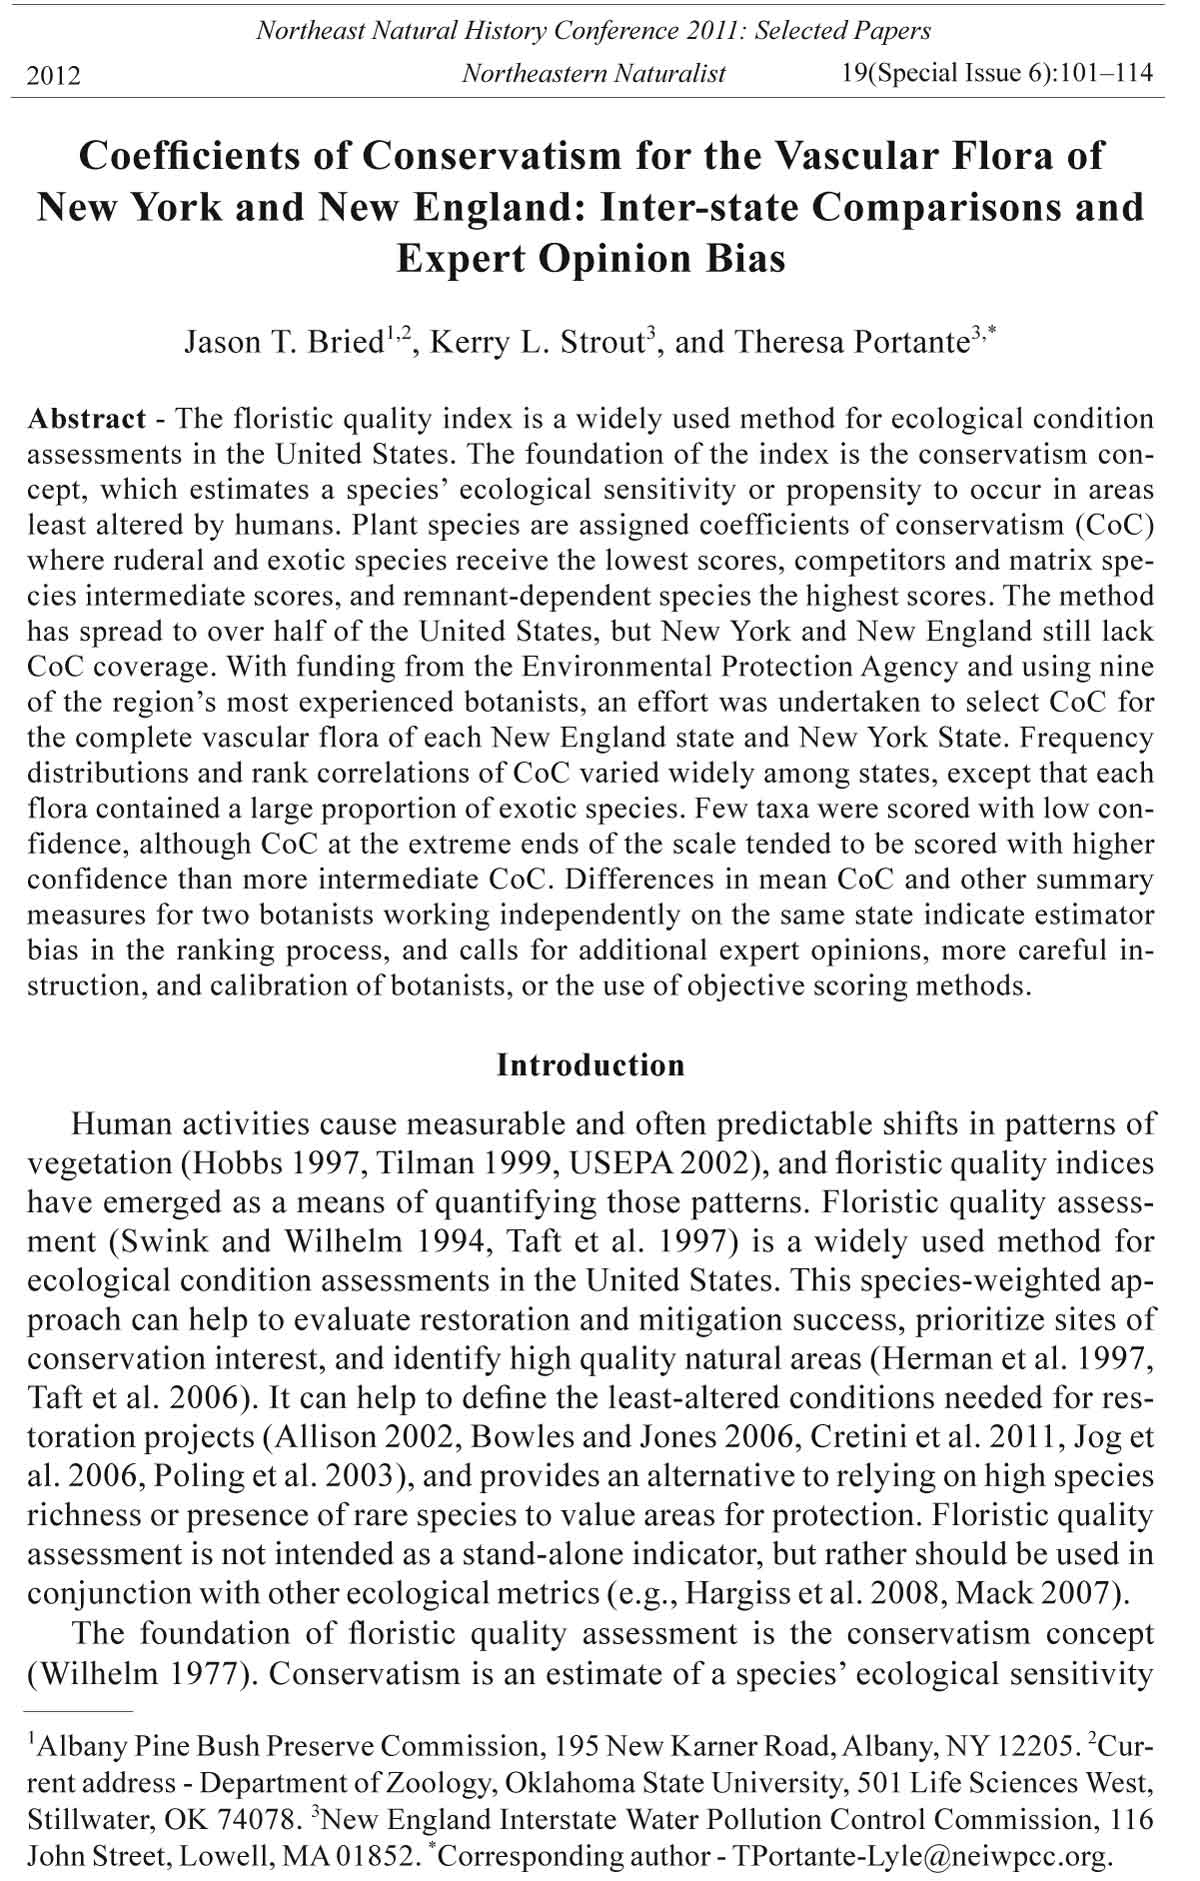
Distributions of conservatism rankings varied among states, but each had a mode
CoC = 0 (Fig. 1), indicating many exotic species. Based on the graphs (Fig. 1)
and summary statistics (Table 2), the Connecticut, Massachusetts, and Vermont
distributions appeared flatter (less peaked) and less skewed than the New Hampshire
and Rhode Island distributions. Differences revealed by the distributional
shapes were more dramatic than revealed by the central tendency and variation
measures (Table 2). Few taxa were scored with low confidence (Fig. 2), although
CoC at the extreme ends of the scale tended to be scored with higher confidence
than more intermediate CoC. Rank correlations among all pair combinations of
2012 J.T. Bried, K.L. Strout, and T. Portante 105
Figure 1. Frequency distributions of conservatism coefficients designated by five of the
region’s most experienced botanists (one botanist per state). The lower right graph compares
the distributions based upon cumulative percentages.
Table 2. Summary statistics for the distributions in Figure 1, excluding non-native species (SD =
standard deviation, IQR = interquartile range).
State Mean Median SD IQR Skewness Kurtosis
CT 6.60 7 2.36 4 -0.323 -0.940
MA 5.45 5 2.38 4 0.143 -0.956
NH 4.85 5 2.01 3 0.340 -0.787
RI 5.17 5 2.09 4 0.500 -0.741
VT 6.09 6 2.21 4 -0.186 -0.951
106 Northeastern Naturalist Vol. 19, Special Issue 6
states and botanists ranged from 0.41 to 0.70 using total taxa, and from 0.37 to
0.74 using only the confidently ranked taxa (Table 3).
The aggregate CoC also differed between botanists, depending on the statistic
under consideration. Kurtosis distinctions were clear in each of four comparisons,
whereas means and skewness differed in two comparisons (Table 4). The
two botanists for New York differed by each metric using all taxa, but only in
terms of distributional shape for the confidently ranked taxa. Contrary to expectations,
there was evidence of clear (P < 0.001) or marginal (0.01 < P < 0.05)
overall differences between the Maine botanists using confidently ranked taxa,
but not according to means or skewness of all taxa. For both Maine and New
Figure 2. Frequency distributions of botanist self-rated confidence (1 = low, 5 = high)
in assigning conservatism coefficients, excluding exotic species. The lower right graph
compares the distributions based upon cumulative percentages.
2012 J.T. Bried, K.L. Strout, and T. Portante 107
York, the proportion of species receiving the same score increased and the difference
between botanists decreased when using only the confidently ranked taxa
instead of all taxa (Figs. 3, 4). Also for both states, a zero difference was found
more frequently at the extremes of the conservatism scale (1–2 and 9–10) than at
intermediate levels.
Table 3. Spearman’s rank correlations of conservatism coefficients using the commonly scored
total taxa, including exotics, among the seven states and nine botanists (“NY1” and “NY2” denote
New York botanists one and two, likewise for Maine). Values in parentheses are the rank correlations
for the confidently ranked taxa (rank of 4, no taxa commonly scored by all nine botanists
received a confidence rank of 5).
NH CT MA RI VT NY1 NY2 ME1 ME2
NH 1.00
CT 0.49 1.00
(0.48)
MA 0.63 0.64 1.00
(0.67) (0.66)
RI 0.54 0.56 0.61 1.00
(0.53) (0.59) (0.61)
VT 0.58 0.49 0.58 0.44 1.00
(0.60) (0.45) (0.60) (0.42)
NY1 0.54 0.59 0.64 0.57 0.65 1.00
(0.51) (0.61) (0.70) (0.57) (0.58)
NY2 0.59 0.59 0.70 0.57 0.70 0.85 1.00
(0.58) (0.61) (0.74) (0.56) (0.68) (0.85)
ME1 0.65 0.41 0.58 0.52 0.54 0.44 0.50 1.00
(0.68) (0.37) (0.61) (0.50) (0.61) (0.46) (0.54)
ME2 0.64 0.52 0.61 0.59 0.50 0.53 0.56 0.59 1.00
(0.63) (0.54) (0.68) (0.65) (0.58) (0.55) (0.60) (0.60)
Table 4. Summary statistics and Monte Carlo-based significance for the patterns in Figures 3 and 4
(“Conf = 5” includes the subset of species ranked with full confidence by both botanists).
State Species Botanist comparison Mean SD Skewness Kurtosis
ME All 1 5.26 2.24 0.083 -1.010
2 5.28 1.97 0.010 -0.692
P value 0.350 less than 0.001 0.366 less than 0.001
Conf = 5 1 5.44 2.33 0.008 -1.088
2 5.58 2.12 -0.089 -0.803
P value 0.018 less than 0.001 0.064 less than 0.001
NY All 1 6.19 2.32 -0.054 -1.113
2 5.83 2.24 0.214 -0.774
P value less than 0.001 less than 0.001 less than 0.001 less than 0.001
Conf = 5 1 5.67 2.51 0.227 -1.160
2 5.57 2.57 0.466 -0.935
P value 0.100 0.089 less than 0.001 less than 0.001
108 Northeastern Naturalist Vol. 19, Special Issue 6
Discussion
Distributions of CoC for the New England states and New York State evoked
the irregular distributions for Michigan (Herman et al. 1997) more than the gradual
step patterns documented elsewhere (Bowers and Boutin 2008, Herman et al. 2006,
Milburn et al. 2007). Several previous CoC lists (Herman et al. 1997, Oldham
et al. 1995, Rothrock and Homoya 2005) contained high percentages of species
perceived as having high degrees of fidelity to a narrow range of synecological
parameters (i.e., CoC = 9 or 10); in contrast, relatively few species were perceived
that way for New York and New England. This finding suggests increasing degradation
of natural areas throughout the region, or simply reflects inherent biases in
botanist’ experience or CoC interpretation (discussed further below).
The wide variation in CoC frequency distributions among states underscores
the need to update any prior New York and New England assessments that used
Figure 3. Comparison of conservatism coefficients between botanists for New York using
all native taxa and only the confidently ranked native taxa (score = 5). Percentages denote
relative proportions of the total taxa ranked.
2012 J.T. Bried, K.L. Strout, and T. Portante 109
CoC from neighbor states (i.e., Bried and Edinger 2009). Clear distinction in
distributional shapes also suggests that a floristic quality assessment in one state
will have a different meaning from the assessment in another state. Consequently,
caution is suggested when comparing floristic quality estimates from different
states. This was additionally supported by the variable rank correlations of CoC
among states. Our findings further imply that state lists should not be combined
into composite CoC for the region. These recommendations make intuitive ecological
sense. For example, species may be at their edge of range in one state but
centered or widespread in another (Bourdaghs et al. 2006), leading to divergent
thinking on CoC. Edge-of-range species for a given state could receive a higher
CoC even though the species is not actually conservative at the scale of its entire
range; the converse scenario may also be true. This situation may explain
the weaker rank correlations among states located farther apart in the region.
Because of this ambiguity, we recommend that botanists designate CoC based
Figure 4. Comparison of conservatism coefficients between botanists for Maine using all
native taxa and only the confidently ranked native taxa (score = 5). Percentages denote
relative proportions of the total taxa ranked.
110 Northeastern Naturalist Vol. 19, Special Issue 6
primarily on ecological tolerance (or sensitivity) and propensity to occur in
human-disturbed habitats (or least-altered conditions) rather than on geographic
or habitat ranges.
Although the contemporary Northeast has a high proportion of exotic species
in its flora, floristic quality assessment usually is applied to local plant
assemblages that tend to have proportionately few exotic species. Exotic species
rarely have substantial effect on the floristic quality estimate, especially in
species-rich communities, which helps explain why these indices often yield the
same conclusions when calculated with and without exotic species (Bourdaghs
et al. 2006, Cohen et al. 2004, DeBerry 2006, Taft et al. 1997). Nevertheless, it
seems prudent to include exotic species in attempts to assess the floristic quality
or “naturalness” of an area, and sometimes just one exotic species can have
disastrous effects on ecosystem pattern and function (Ervin et al. 2006, Francis
et al. 2000).
Studies of floristic conservatism have cautioned that disparity in botanist
opinions may ultimately affect interpretations of floristic quality (Bourdaghs et
al. 2006, Cohen et al. 2004, Landi and Chiarucci 2010). Although differences
of opinion may exist at the species level, floristic quality assessment is based
on relative aggregate conservatism. We found mixed evidence for aggregate
differences between two botanists working in Maine and New York. Similar to
our findings, Landi and Chiarucci (2010) reported significant variation among
independently assigned CoC, along with weaker agreement between botanists
for species with intermediate scores. However, expert-derived versus data-generated
CoC were similar in a study of prairie pothole complexes in North Dakota
(Mushet et al. 2002). While the CoC are established based on subjective expert
opinion, application of the CoC for individual site evaluations is carried out
objectively (Andreas et al. 2004, Herman et al. 1997). Despite the subjectivity
in assigning CoC, floristic quality assessment has repeatedly shown an inverse
correlation across a gradient of increasing habitat degradation (Cohen et al. 2004,
Ervin et al. 2006, Lopez and Fennessy 2002, Miller and Wardrop 2006).
Similar efforts in other parts of the country have placed more species at ruderal
or conservative ends of the CoC scale than at intermediate levels (Cohen et
al. 2004, Herman et al. 2006). In the current study, there was tendency to assign
extreme rankings (1–2 and 9–10) with greater confidence, suggesting that the
most tolerant and sensitive species are easier to assess and have relatively stable
ecological behavior (Rothrock and Homoya 2005). However, the low percentage
of CoC = 1 in this project may reflect uncertainty about the scoring concepts
rather than a perception that native species occur infrequently outside of intact
natural areas. The alternating step pattern for Rhode Island clearly suggests a
preference for assigning certain ranks over others, which is not surprising given
that two or three ranks may have the same definition (Table 1). Emphasis on categories
along the scale rather than integer values may be a prudent approach for
applying index calculations (see, for example, Taft et al. 2006).
The confusion over scoring criteria and the inherent bias of expert opinion
call for clear instruction and careful calibration of the mental process, such as
2012 J.T. Bried, K.L. Strout, and T. Portante 111
found in the Colorado project (Rocchio 2007). Panel discussions (e.g., Andreas
et al. 2004, Mushet et al. 2002, Taft et al. 1997) may help to mitigate the potential
for “conceptual drift” of fully independent CoC assignment, but dominant
personalities can sometimes override the discussion. Objective methods or
data-derived CoC should therefore be considered. Mushet et al. (2002) divided
a large sample of prairie pothole wetlands into five habitat quality categories
and selected CoC based on species occurrence and exclusivity to each category.
Kutcher (2011) presented a similar idea but incorporated a more rigorous analysis
of species’ fidelity and specificity. Rocchio (2007) used species occurrence rates
along a human disturbance gradient to measure the accuracy of expert-derived
CoC. Subjectivity bias may be tempered during index calculations by combining
expert-derived CoC with relative frequency, dominance, or other quantitative
species information (e.g., Tu et al. 2009).
A preliminary list of CoC is now available for the vascular plants known
from each New England state and New York State (http://www.neiwpcc.org/
wetlands/nebawwg.asp). We say “preliminary” in part because this project used
only one or two botanists per state whereas similar efforts have used a core team
of 4–10 botanists to cover a single state (Bernthal 2003, Herman et al. 1997,
Milburn et al. 2007). We encourage further discussion and refinement of the
lists over time using additional expert opinions or objective scoring methods.
Furthermore, the New England Interstate Water Pollution Control Commission
will be working with the New England Biological Assessment of Wetlands
Workgroup to evaluate this tool for monitoring and assessment of wetland
condition in the Northeast. Potential topics of discussion and future research
include: (1) Which metric shows the strongest relationship to anthropogenic
disturbance (mean CoC, mean CoC weighted by species richness, etc) and
how does this metric perform relative to other biological condition indicators?
(2) How does the sampling approach (e.g., habitat stratification, area sampled,
time of sampling) affect floristic quality estimates? (3) Does the method perform
similarly among different community types? These questions have been
explored in other regions (Bourdaghs et al. 2006, Cohen et al. 2004, Ervin et
al. 2006, Johnston et al. 2009, Matthews et al. 2005, Miller and Wardrop 2006,
Nichols et al. 2006, Taft et al. 2006) and should be addressed for the Northeast.
In the meantime, the Northeast has the basic ingredient to facilitate floristic
quality assessment, a potentially valuable tool for restoration monitoring, site
prioritization efforts, and identification of high quality natural areas.
Acknowledgments
This project was developed under a Wetland Program Development Grant (No. WD
83418301) awarded by the US Environmental Protection Agency to the New England
Interstate Water Pollution Control Commission, with in-kind support from the Maine
Natural Areas Program, New Hampshire Department of Environmental Services, and
the Albany Pine Bush Preserve Commission. Special thanks to each of our contract
botanists (Matt Arsenault, Ted Elliman, Rick Enser, Sue Gawler, Art Gilman, Don
Schall, Dan Sperduto, David Werier, and Steve Young), the New England Biological
112 Northeastern Naturalist Vol. 19, Special Issue 6
Assessment of Wetlands Work Group, all members of the technical advisory committee,
Chris Faulkner, and Emily Bird. Also thanks to Brook Herman, Suneeti Jog, Tom
Kutcher, and Gary Ervin for reviewing the manuscript prior to submission. John Taft
and two anonymous reviewers offered many constructive criticisms that greatly improved
the manuscript.
Literature Cited
Allison, S.K. 2002. When is a restoration successful? Results from a 45-year-old tallgrass
prairie restoration. Ecological Restoration 20:10–17.
Andreas, B., and R. Lichvar. 1995. A floristic quality assessment system for northern
Ohio. Wetlands Research Program Technical Report WRP-DE-8. US Army Corps of
Engineers, Waterways Experiment Station, Vicksburg, MS.
Andreas, B.K., J.J. Mack, and J.S. McCormac. 2004. Floristic quality assessment index
(FQAI) for vascular plants and mosses for the State of Ohio. Ohio Environmental
Protection Agency, Division of Surface Water, Wetland Ecology Group, Columbus,
OH. 219 pp.
Bernthal, T.W. 2003. Development of a floristic quality assessment methodology for Wisconsin.
Wisconsin Department of Natural Resources, Bureau of Integrated Science
Services, Madison, WI. PUB-SS-986 2003. 19 pp.
Bourdaghs, M., C.A. Johnston, and R.R. Regal. 2006. Properties and performance of the
floristic quality index in Great Lakes coastal wetlands. Wetlands 26:718–735.
Bowers, K., and C. Boutin. 2008. Evaluating the relationship between floristic quality
and measures of plant biodiversity along stream bank habitats. Ecological Indicators
8:466–475.
Bowles, M., and M. Jones. 2006. Testing the efficacy of species richness and floristic
quality assessment of quality, temporal change, and fire effects in tallgrass prairie
natural areas. Natural Areas Journal 26:17–30.
Bried, J.T., and G.J. Edinger. 2009. Baseline floristic assessment and classification of
pine barrens vernal ponds. Journal of the Torrey Botanical Society 136:128–136.
Cohen, M.J., S. Carstenn, and C.R. Lane. 2004. Floristic quality indices for biotic
assessment of depressional marsh condition in Florida. Ecological Applications
14:784–794.
Cretini, K.F., J.M. Visser, K.W. Krauss, and G.D. Steyer. 2011. Development and use of
a floristic quality index for coastal Louisiana marshes. Environmental Monitoring and
Assessment DOI: 10.1007/s10661-011-2125-4.
DeBerry, D.A. 2006. Floristic quality index: Ecological and management implications in
created and natural wetlands. Ph.D Dissertation. The College of William and Mary,
Gloucester Point, VA.
Ervin, G.N., B.D. Herman, J.T. Bried, and D.C. Holly. 2006. Evaluating non-native
species and wetland indicator status as components of wetland floristic assessment.
Wetlands 26:1114–1129.
Francis, C.M., J.J.W. Austen, J.M. Bowles, and B. Draper. 2000. Assessing floristic quality
in southern Ontario woodlands. Natural Areas Journal 20:66–77.
Grime, J.P. 1974. Vegetation classification by reference to strategies. Nature 250:26–31.
Hargiss, C.L. M., E.S. DeKeyser, D.R. Kirby, and M.J. Ell. 2008. Regional assessment of
wetland plant communities using the index of plant community integrity. Ecological
Indicators 8:303–307.
2012 J.T. Bried, K.L. Strout, and T. Portante 113
Herman, B.D., J.D. Madsen, and G.N. Ervin. 2006. Development of coefficients of conservatism
for wetland vascular flora of north and central Mississippi. GeoResources
Institute Report Number 4001, Mississippi State University, Starkville, MS. 15 pp.
Herman, K.D., A.A. Reznicek, L.A. Masters, G.S. Wilhelm, M.R. Penskar, and W.W.
Brodowicz. 1997. Floristic quality assessment: Development and application in the
state of Michigan (USA). Natural Areas Journal 17:265–279.
Hobbs, R.J. 1997. Can we use plant functional types to describe and predict responses to
environmental change? Pp. 66–90, In T.M. Smith, H.H. Shugart, and F.I. Woodward
(Eds.). Plant Functional Types: Their Relevance to Ecosystem Properties and Global
Change. Cambridge University Press, Cambridge, UK.
Jog, S., K. Kindscher, E. Questad, B. Foster, and H. Loring. 2006. Floristic quality as
an indicator of native species diversity in managed grasslands. Natural Areas Journal
26:149–167.
Johnston, C.A., J.B. Zedler, M.G. Tulbure, C.B. Frieswyk, B.L. Bedford, and L. Vaccaro.
2009. A unifying approach for evaluating the condition of wetland plant communities
and identifying related stressors. Ecological Applications 19:1739–1757.
Kutcher, T.E. 2011. Integrating rapid assessment with biological and landscape indicators
of freshwater wetland condition. Rhode Island Natural History Survey, University
of Rhode Island, Kingston, RI. 48 pp. + Appendices.
Landi, S., and A. Chiarucci. 2010. Is floristic quality assessment reliable in humanmanaged
ecosystems? Systematics and Biodiversity 8:269–280.
Lopez, R.D., and M.S. Fennessy. 2002. Testing the floristic quality assessment index as
an indicator of wetland condition. Ecological Applications 12:487–497.
Mack, J.J. 2007. Developing a wetland IBI with statewide application after multiple testing
iterations. Ecological Indicators 7:864–881.
Matthews, J.W. 2003. Assessment of the floristic quality index for use in Illinois, USA,
wetlands. Natural Areas Journal 23:53–60.
Matthews, J.W., P.A. Tessene, S.M. Wiesbrook, and B.W. Zercher. 2005. Effect of area
and isolation on species richness and indices of floristic quality in Illinois, USA wetlands.
Wetlands 25:607–615.
Medley, L., and M. Scozzafava. 2009. Moving toward a national floristic quality assessment:
considerations for the EPA National Wetland Condition Assessment. National
Wetlands Newsletter 31(1):6–9.
Milburn, S.A., M. Bourdaghs, and J.J. Husveth. 2007. Floristic quality assessment for
Minnesota wetlands. Minnesota Pollution Control Agency, St. Paul, MN. 197 pp.
Miller, S.J., and D.H. Wardrop. 2006. Adapting the floristic quality assessment index
to indicate anthropogenic disturbance in central Pennsylvania wetlands. Ecological
Indicators 6:313–326.
Mushet, D.M., N.H. Euliss, Jr., and T.L. Shaffer. 2002. Floristic quality assessment of
one natural and three restored wetland complexes in North Dakota, USA. Wetlands
22:126–138.
Nichols, J.D., J.E. Perry, and D.A. DeBerry. 2006. Using a floristic quality assessment
technique to evaluate plant community integrity of forested wetlands in southeastern
Virginia. Natural Areas Journal 26:360–369.
Oldham, M.J., W.D. Bakowsky, and D.A. Sutherland. 1995. Floristic Quality Assessment
System for Southern Ontario. Natural Heritage Information Centre, Ontario Ministry
of Natural Resources, Peterborough, ON, Canada.
Poling, T.C., M.G. Banker, L.M. Jablonski, and D.R. Geiger. 2003. Quadrat-level floristic
quality index reflects shifts in composition of a restored tallgrass prairie (Ohio).
Ecological Restoration 21:144–145.
114 Northeastern Naturalist Vol. 19, Special Issue 6
Rocchio, J. 2007. Floristic quality assessment indices for Colorado plant communities.
Colorado Natural Heritage Program, Colorado State University, Fort Collins, CO.
234 pp.
Rothrock, P.E., and M.A. Homoya. 2005. An evaluation of Indiana’s floristic quality assessment.
Proceedings of the Indiana Academy of Science 114:9–18.
Spyreas, G., and J.W. Matthews. 2006. Floristic conservation value, nested understory
floras, and the development of second-growth forest. Ecological Applications
16:1351–1366.
Swink, F., and G. Wilhelm. 1979. Plants of the Chicago Region. Revised and expanded
edition with keys. Morton Arboretum, Lisle, IL.
Swink, F., and G. Wilhelm. 1994. Plants of the Chicago Region. Fourth Edition. Indiana
Academy of Science, Indianapolis, IN. 900 pp.
Taft, J.B., G.S. Wilhelm, D.M. Ladd, and L.A. Masters. 1997. Floristic quality assessment
for vegetation in Illinois: A method for assessing vegetation integrity. Erigenia
15:3–95.
Taft, J.B., C. Hauser, and K.R. Robertson. 2006. Estimating floristic integrity in tallgrass
prairie. Biological Conservation 131:42–51.
Tilman, D. 1999. The ecological consequences of changes in biodiversity: A search for
general principles. Ecology 80:1455–1474.
Tu, W., X. Gao, N. Wu, and S. Liu. 2009. A novel method for floristic quality assessment
using the vegetation of the Jiuding Mountain, Sichuan, China as an example. Nordic
Journal of Botany 27:61–68.
US Environmental Protection Agency (USEPA). 2002. Methods for evaluating wetland
condition: Using vegetation to assess environmental conditions in wetlands. Office of
Water, Washington, DC. EPA-822-R-02-020.
Weldy, T., and D. Werier. 2011. New York Flora Atlas. (S.M. Landry and K.N. Campbell
[original application development], Florida Center for Community Design and Research,
University of South Florida). New York Flora Association, Albany, NY.
Wilhelm, G. 1977. Ecological assessment of open land areas in Kane County, Illinois.
Kane County Urban Development Division, Geneva, IL.
Wilhelm, G., and D. Ladd. 1988. Natural areas assessment in the Chicago region.
Transactions of the North American Wildlife and Natural Resources Conference
53:361–375.


 The Northeastern Naturalist is a peer-reviewed journal that covers all aspects of natural history within northeastern North America. We welcome research articles, summary review papers, and observational notes.