Northeast Natural History Conference 2011: Selected Papers
2012 Northeastern Naturalist 19(Special Issue 6):115–128
Distributions of Natural Heritage Program Communities
and their Use as Surrogates for Rare Species in New York
State Parks
George R. Robinson*
Abstract - Biodiversity distributions can be quantified as alpha (taxonomic richness),
and beta (compositional heterogeneity) components. In both cases, accurate and detailed
assessments require substantial resources, so surrogate measures have been proposed and
tested. Scientists from the New York Natural Heritage Program (NHP), working in over
140 New York State Parks, recorded occurrences of 128 different ecological communities,
98 significant (rare or exemplary) ecological communities, and 312 rare species. I
used their data to test whether community distributions were valid surrogates for rare
species diversity at alpha and beta levels. I found that (1) alpha patterns among the State
Parks were similar for NHP significant communities and rare species; (2) beta patterns
were contrasting, such that NHP significant communities were weak surrogates at this
level; (3) alpha distributions were poor predictors of Beta distributions among parks; and
(4) a large fraction of beta diversity is attributable to variation in geographic region, but
most State Parks and all State Park Regions make unique contributions.
Introduction
Measuring and interpreting patterns of biodiversity distributions remain
core research topics in ecology, with the added element of urgency in their application
to conservation planning and management. The dominant metric in
conservation remains species-level alpha diversity, counts of taxa (± relative
abundances) within defined areas—information that demands time and resources,
but omits key information such as species composition (Sarkar et al.
2006). The primary elements of interest to conservation are rare species and
their subspecific taxa, which by definition are infrequent, cryptic, or otherwise
difficult to document across their natural ranges, so determining their status
may require indirect means. The common approach to this dilemma is the use
of surrogate data, including “coarse filter” assessment (Noss 1987, Noss and
Cooperrider 1994).
There appear to be three main categories of surrogates in biological conservation.
The first is species richness, as applied in species-area relations (SAR). The
information is coarse because, in the absence of data on abundance and composition,
it gives no insight into the status of particular species. SAR has been
used to model “effective” sizes of parks and preserves in fragmented landscapes
(reviewed in Harrison and Bruna 1999, Robinson and Quinn 1992), to identify
critical gaps in conservation coverage (Davis et al. 1990, Scott et al. 1987), and to
predict changes in species diversity with loss of habitat area in rapidly changing
*Department of Biological Sciences, State University of New York, Albany, NY 12222;
grobins@albany.edu.
116 Northeastern Naturalist Vol. 19, Special Issue 6
landscapes (Brooks et al. 1999, Pimm et al. 1995; but see He and Hubbell 2011
for a critique on methodologies).
The second category involves the use of particular species as surrogates, such
as “umbrella” and “indicator” species. In these applications, detailed knowledge
of the status of one or a few species guides the stewardship of many others, and
protecting a well-studied focal species is assumed to contribute to the preservation
of other, more obscure organisms. For example, safeguarding populations
of large, wide-roaming carnivores may secure habitat for a fuller spectrum of
native biota (Thorne et al. 2006), or the status of a habitat specialist may serve
as an indication of the condition of a rare ecosystem (Launer and Murphy 1994).
These kinds of extrapolations are not without flaws (Andelman and Fagan 2000),
particularly when more common taxa are used as surrogates for legally protected
species and subspecies (Murphy et al. 2011). However, surrogate species have
been validated at relatively large spatial scales (Andersen and Majer 2004, Pearman
et al. 2006) and in cross-taxa analyses (Oliver et al. 1998, Su et al. 2004).
The third category is the use of species assemblages and communities as
surrogates for other elements of biodiversity, such as habitat diversity and rare
taxa (Noon et al. 2003, Reyers et al. 2001, Williams et al. 2006). Ecological
communities are temporally and spatially variable, and can be characterized
to include or exclude certain kinds of species and geological features (Morin
1999, Mueller-Dombois and Ellenberg 1974, Whittaker 1975). As such, they
lack the firmer definitions accorded to species, particularly with respect to
their durability (Hunter et al. 1988). However, community classification systems
have descriptive value at regional (sub-biome) scales (e.g., Barbour and
Billings 1988). For stewardship purposes, ecological communities, once classified,
can be mapped and monitored (Grossman et al. 1999, Jennings 2000).
In addition, when standards and protocols are maintained, they can be treated
as candidates for protection in their own right (Noss 1987). The New York
Natural Heritage Program (NHP) has its own community classification system
(Edinger et al. 2002, Reschke 1990), based on the NatureServe (2002) methods,
in which communities are delineated in over 200 categories. Within this
system, natural communities are distinguished from anthropogenic (“cultural”)
communities, and rare natural communities receive an additional designation
as “significant” communities. In this paper, I draw on NHP records for New
York State Parks to examine how distributions of communities can serve as
surrogates for other measures of biodiversity distributions.
Sarkar et al. (2006) distinguish between “true” surrogates and “estimator”
surrogates for conservation planning. An example of the former would be highly
accurate and detailed information on a rare species’ distribution, abundance, and
viability. Although directly relevant to conservation, this is considered surrogate
information, because it portrays only a fraction of the full breadth of biodiversity
that could be measured. Estimator surrogates are more commonly employed, for
practical reasons, including the urgency inherent in most conservation planning.
Examples include counts of different species assemblages, such as ecological
communities, and extend to higher levels of ecological organization. An estimator
surrogate is most useful for conservation planning when it can be tested
2012 G.R. Robinson 117
directly against other measurements of biodiversity (Sarkar et al. 2006, Tognelli
2005, Williams et al. 2006).
The two main questions addressed here are: (1) How are NHP communities
and rare species distributed within the New York State Park system? (2) Do
NHP communities serve as valid surrogates for rare species? To answer the first
question, I compared frequencies of NHP ecological communities among State
Parks (on the basis of park size), among 11 State Park regions, and between the
State Park system and the fuller statewide database. To answer the second, I used
regression models and accumulation curves to test whether frequencies of NHP
significant communities predicted frequencies of rare species within and among
State Parks. For both questions, comparisons were made on the basis of alpha distributions
(simple counts of community types and species) and beta distributions
(how evenly each community type or species is distributed) among individual
State Parks and State Park Regions.
Methods
Data sources
The New York State Office of Parks, Recreation, and Historic Preservation
(OPRHP) operates 176 State Parks, well distributed across the state (maps at:
NYS OPRHP 2011a), and organized into 12 State Park regions. During 1999–
2004, the NY Natural Heritage Program (NHP) surveyed the majority of State
Parks under a State Lands Assessment contract, supported by the NY State Biodiversity
Research Institute (NY NHP 2005a). NHP has continued to maintain and
update the information, including additions of new records through field surveys.
Although the effort did not include full species inventories, the underlying work
was systematic, standardized, and reviewed. The dataset is useful and interesting
because multiple taxonomic groups were studied, most State Parks were included,
and the parks are geographically well dispersed. The NHP survey began with
over 140 parks, documenting the presence and locations of rare species and ecological
communities, the latter classified according to the NHP system (Reschke
1990, Edinger et al. 2002). Records of one or more NHP ecological communities
are available for 134 New York State Parks.
A total of 8605 NHP ecological community records were produced (many with
multiple occurrences inside a given park), representing 128 different NHP community
types (over 2/3 of the 176 natural communities in Edinger et al. [2002]).
I collapsed multiple occurrences of the same NHP community type to one record
per park, reducing the count to 1156 records in the 134 parks, a mean of 8.30
different natural communities per park. There were an additional 291 records
for NHP significant communities, whose designation is based on determinations
of rarity in NY State, or their status as outstanding examples of the more common
natural communities (NY NHP 2005b). These records are stored separately
as NHP Element Occurrences, and mapped and recorded in the same statewide
database as rare species. As with NHP ecological communities, multiple occurrences
of NHP significant communities were reduced to one record of each per
park, yielding 230 records, located in 80 State Parks, with a mean of 2.88 NHP
significant communities per park. In 29 cases, a single significant community was
118 Northeastern Naturalist Vol. 19, Special Issue 6
mapped to include more than one State Park, and in each case, it was assigned to
that park that had been determined as its primary location. My rationale here was
the understanding that NHP staff conduct most ground-level community surveys
at primary locations, and maps are later extrapolated from imagery (J. Lundgren,
NYNHP, Albany, NY, pers. comm.)
Rare species were recorded in 102 State Parks in several categories, three of
which were used here: vascular plants, vertebrates, and invertebrates. The mean
count was 5.55 total rare species per park. Two other NHP categories—unique
animal assemblages and nonvascular plants—were excluded because they were
limited to a few parks and based on less systematic inventories. The two datasets
used for this paper (State Park NHP community maps and statewide NHP Element
Occurrences) contained records validated as of December 2009.
Analytical procedure
NHP ecological and significant communities were treated as taxonomic entities,
and analyzed for alpha diversity (counts per State Park), for comparison with
counts of rare species. Only parks with non-zero counts were used in each case,
for two reasons: first, zero values steepen regression curves and inflate degrees of
freedom; second, although the data represent substantial effort by NHP scientists,
surveys were not exhaustive, so absence of records is not conclusive evidence
for true zero values. Although less frequent than the full set of NHP ecological
communities, NHP significant communities proved to be better predictors of rare
species counts, and were used in comparisons of beta diversity (heterogeneity of
distributions) among State Parks. For beta tests, parks were also grouped in State
Park regions, because beta distributions are scale-dependent (e.g., MacNally et
al. 2004, Stevens and Willig 2002, Veech and Crist 2007), so grouping parks by
region can reveal geographic properties of their beta distributions.
Alpha distributions. Frequency distributions were compared for all NHP ecological
communities, NHP significant communities, and rare species for State
Parks that had records for each, and tested numerically with the second-order Hill
Index (reciprocal Simpson Index; Magurran 2004):
1 / Σpi
2,
where pi is the relative frequency of each community type or species. Counts of
communities and species per park were regressed on park size (both variables
log-transformed), as in a species-area analysis (MacArthur and Wilson 1967), to
test for area-related distribution patterns. To test for surrogacy, rare species were
separated into vascular plants, vertebrates, and invertebrates, and their individual
and pooled numbers per park were regressed on counts of NHP ecological and
NHP significant communities per park. Data were organized and manipulated
using SQL-based software (MS Access™ 2007, MS Visual FoxPro™ 9.0), and
statistical analyses were performed using SYSTAT™ 11. Logarithmic transforms
were made using the formula ln(x + 1).
Beta distributions. Beta diversity has a variety of ecological definitions (reviewed
in Anderson et al. 2010, Jost 2007, Koleff, et al. 2003, Tuomisto 2010), but
the common objective is quantifying compositional heterogeneity. In the case of
New York State Parks, high beta of NHP significant communities or rare species
2012 G.R. Robinson 119
would indicate heterogeneity in their distributions, sometimes referred to as high
“complementarity” (Lund and Rahbek 2002, Williams et al. 2006). Beginning with
the original concept (Whittaker 1972), graphical methods have been particularly
useful for describing beta distributions. I prepared accumulation curves, similar
to those employed in conservation planning (Sarkar et al. 2006) and in more general
assessments of species diversity in parks and preserves (Quinn and Harrison
1988, Robinson and Quinn 1992). Unlike rarefaction curves, which tabulate the
cumulative number of taxa versus the number of individuals encountered (Magurran
2004), the cumulative number of community types or species is re-tabulated as
each State Park is added. Steeper accumulation rates indicate greater heterogeneity,
i.e., greater individual contributions per park.
For this analysis, it was necessary to set a starting point and a pattern for accumulating
parks and NHP records. The State Parks included range in size from
4 ha to >27,000 ha, and contain from 1 to 13 NHP significant community types
and 1 to 28 rare species each. Therefore, rather than random ordering, I found it
more informative to rank them in order of alpha diversity, from highest to lowest
counts of NHP significant communities, incrementing cumulative counts as
parks are added. This approach allows direct comparisons between alpha and
beta distributions, and between NHP significant communities and rare species. In
addition, accumulation rates were tabulated as quartiles of NHP significant communities
and species, noting the number of parks required to reach each quartile.
All parks with at least one significant community and/or one rare species were
included (n = 139). The same analyses were repeated for State Parks pooled into
eleven OPRHP regions. A twelfth region, which is limited to historic sites within
the Adirondack and Catskill Parks, was excluded.
Results
Alpha distributions
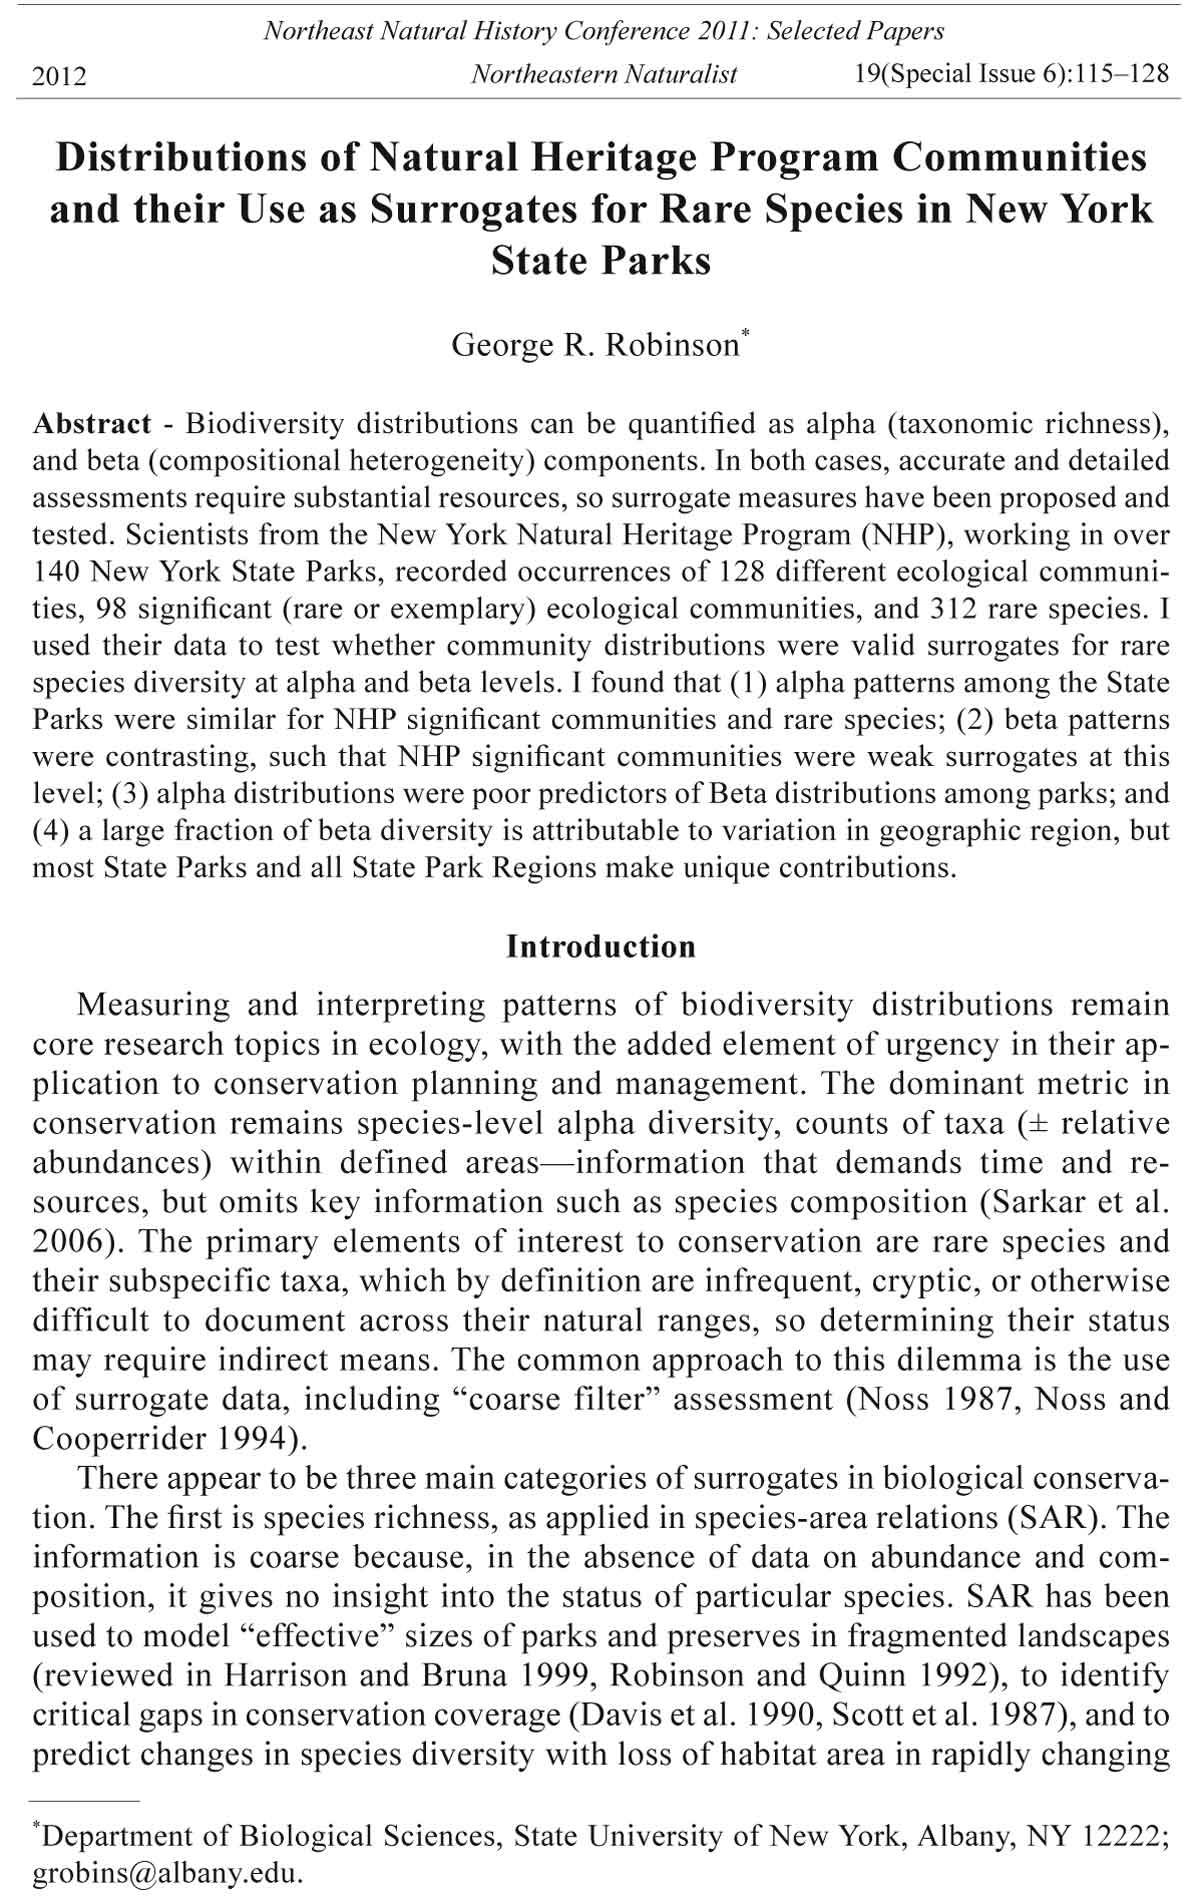
NHP ecological communities appear more evenly distributed (Fig. 1a) than
NHP significant communities or rare species (Fig. 1b, c), and this finding is
supported by inverse Simpson values (1/D = 38.84, 43.91, and 42.41, for NHP ecological
communities, NHP significant communities, and rare species, respectively).
For all three categories, alpha diversity increased with park size (Fig. 2a–c), with
regression slopes in the same ranges as species-area curves reported for continental
shelf islands and other park systems (MacArthur and Wilson 1967, Quinn and Harrison
1988). There was an approximate 1:1 relationship between NHP significant
communities and rare plants per park, with declining ratios for vertebrates and invertebrates
(Table 1). Counts of NHP significant communities were correlated with
counts of NHP ecological communities (R2 = 0.382, P < .01), but NHP significant
communities were two-to-four times more likely to predict the occurrence of rare
species in all categories, with higher correlation coefficients (Table 1).
Beta distributions
Beta diversity of NHP significant communities was relatively high among the
State Parks studied, with many lower-ranked parks (those with fewer significant
community types) contributing to the cumulative total (Table 2, Fig. 3a). The
120 Northeastern Naturalist Vol. 19, Special Issue 6
accumulation curve for rare species was considerably steeper, indicating that the
majority of rare species are not members of the NHP significant communities
recorded. In both categories, most parks need to be included for a full representation
(77/80 of those with NHP significant communities, and 128/132 for those
with rare species; Table 3). At the regional level, beta distributions were more
Figure 1. Frequency distributions for
(a) New York Natural Heritage Program
(NHP) ecological communities, (b) NHP
significant communities (naturally rare
or outstanding examples of more common
communities), and (c) rare species
in New York State Parks. Data limited
to parks with at least one record in each
case (a: n = 134; b: n = 80; c: n = 102).
2012 G.R. Robinson 121
consolidated, with two State Park Regions (in rank order, the Long Island Region
and the Palisades Region) contributing half the cumulative count for NHP
significant communities and two-thirds for rare species (Fig. 3b). However, even
the least diverse region (New York City), with only two parks totaling 105 ha,
Figure 2. Diversity-area relationships
in New York State Parks, for (a) 128
NHP ecological communities in 134
parks, (b) 98 NHP significant communities
in 80 parks, and (c) 312
rare species in 102 parks. Regression
slopes (95% CI): (a) 0.284 (0.168),
R2 = 0.395, P < .001; (b) 0.258 (0.071),
R2 = 0.253, P < .001; (c) 0.271 (0.083),
R2 = 0..297, P < .001.
122 Northeastern Naturalist Vol. 19, Special Issue 6
Table 1. Least-squares regression results for tests of counts of rare species versus counts of NHP
ecological communities and NHP significant communities per park in New York State Parks
containing one or more of each community type. In all cases, F-tests against a slope of zero are
significant (P < 0.001).
Category Coefficient 95% CI R2
a. NHP ecological communities (n = 134 parks)
Vascular plants 0.36 0.11 0.24
Vertebrates 0.19 0.06 0.20
Invertebrates 0.11 0.04 0.24
Pooled rare species 0.69 0.17 0.33
b. NHP significant communities (n = 80 parks)
Vascular plants 1.28 0.32 0.46
Vertebrates 0.68 0.19 0.40
Invertebrates 0.26 0.12 0.19
Pooled rare species 2.35 0.47 0.57
Table 2. Minimum number of New York State Parks required to accumulate each quartile of total
NHP significant community types and rare species in Fig. 3a.
Cumulative Parks
Beta Category Quartile number required
NHP significant communities
1 25 3
2 49 9
3 73 23
4 98 77
Rare species
1 78 5
2 155 14
3 233 51
4 312 128
Table 3. Minimum number of New York State Park Regions required to accumulate each quartile of
total NHP significant communities among New York State Park Regions in Fig. 3b.
Cumulative Regions
Beta Category Quartile number required
NHP significant communities
1 25 1
2 49 2
3 73 4
4 98 11
Rare species
1 78 1
2 155 2
3 233 5
4 312 11
contributed. As a result, the full complement of NHP significant communities and
rare species can be acquired only through inclusion of all regions.
2012 G.R. Robinson 123
Discussion
Alpha and beta distributions are requisite information for effective conservation
planning and management (Davis et al. 1990, Ferrier et al. 2000, Kessler et
al. 2009, Margules and Pressey 2000, Sarkar 2006), yet assessing either requires
investments of precious time and scarce talent. As a partial solution to deficits
in alpha-level information, surrogate measures have been proposed and tested,
with some notable successes (e.g., Andersen and Majer 2004, Launer and Murphy
1994, Lund and Rahbek 2002, Oliver et al. 1998, Su et al. 2004, Thorne
et al. 2006, Tognelli 2005). Tests for surrogacy at the Beta level appear to be
less frequent, but include correlations among taxonomic groups (Clough et al.
2007, Pharo et al. 1999, Sætersdala et al. 2003), congruence among related taxa
(Terlizzi et al. 2009), and at least one comparison between assemblages and
species (Ward et al. 1999). The latter study found that the most effective way to
accumulate species in a marine reserve system was to accumulate a diversity of
habitats, rather than species assemblages. In this paper, I used a well-defined set
of assemblages that also captures a range of habitat diversity, NHP community
classifications (Edinger et al. 2002, Reschke 1990), to test whether they may
serve as surrogates for the subset of species listed as rare in New York State,
looking at both alpha and beta distributions.
My main findings were that (1) alpha distribution patterns among New York
State Parks were similar for NHP significant communities and rare species, and
parks with more NHP significant communities had more rare species in three taxonomic
categories and as a pooled set; (2) beta distributions were divergent among
parks and among State Park Regions, with species accumulating more slowly than
Figure 3. Accumulation curves for 98 NHP significant communities and 312 rare species
in 139 individual New York State Parks containing at least one rare species or NHP signifi
cant community. (a) Parks ranked in order of number of NHP significant community
types per park (rank 1 = 13, rank 12 = 0); upper curve (closed triangles) = rare species,
lower curve (open circles) = NHP significant communities. (b) Parks pooled into 11 New
York State Park Regions, ranked in order of number of NHP significant community types
(rank 1 = 36, rank 12 = 3); upper curve (closed triangles) = rare species, lower curve
(open circles) = NHP significant communities.
124 Northeastern Naturalist Vol. 19, Special Issue 6
NHP significant communities; (3) alpha distributions were poor predictors of beta
distributions, and many of the least diverse parks (those with the fewest NHP signifi
cant communities) make unique contributions to the rare species pool; and (4) a
large fraction of beta diversity is attributable to variation in geographic region, but
most parks and all State Park Regions make unique contributions.
The first finding offers some support for the use of NHP significant communities
as surrogates for rare species. Both have similar frequency distributions and similar
relationships to park size, with large parks containing more of each, although
with considerable scatter around the regression lines. Part of this residual variation
is explained by the second finding, which would indicate that higher communitylevel
diversity tracks higher species-level diversity. Abundance of the more
common NHP ecological communities was correlated with abundance of NHP signifi
cant communities, on a per park basis, but they were not distributed in ways that
made them useful surrogates for rare species, even at the alpha level.
A simple explanation for the first two findings is that they are redundant—
that most of the rare species are embedded in NHP significant communities. The
third finding negates that explanation, because rare species accumulate at a much
lower rate, and continue to accumulate in parks with no records of NHP signifi-
cant communities. Added to this, the fourth finding tends to rule out the validity
of NHP significant communities as conservation “estimator” surrogates (Sarkar
et al. 2006) for rare species. Although State Parks and State Park Regions with
the highest alpha diversity contribute disproportionately, most parks and all regions
are needed to build the full species pool, i.e., to maximize gamma diversity
(Whittaker 1975) within the agency’s holdings.
The last finding demonstrates that much of the beta diversity among parks
is attributable to their wide geographic distribution. Despite their relative small
total surface area (less than 1% of the state is occupied by all 176 State Parks combined)
and small average individual area (median = 130 ha), the parks harbor a wide
range of different ecosystems. In addition, they are not randomly dispersed, but
tend to occur in unique settings. For example, almost half are located in coastal
zones, where they represent some of the last remaining natural coastal habitats,
while others were established to preserve unique geological settings or other natural
features that support rare or unusual fauna and flora (Robinson, in press).
Although my results indicate that NHP significant communities were weak
surrogates, they have special conservation value in and of themselves (Noss
1987). Unique plant communities have long been featured in descriptions of
parks and preserves (e.g., Muir 1909), and in practice, they are given their own
protected status in New York State Park Master Plans (NYS OPRHP 2011b). An
added benefit is that ecological communities tend to be less vulnerable to degradation
or collection than individual species, so their locations can be shared more
freely for management planning and educational purposes (Robinson, in press).
An unusual feature of this study is that two categories of rarity were compared.
By definition, rare taxa and assemblages should have heterogeneous
distributions, but unless they are highly nested (most rare species are members of
rare assemblages), there is no a priori reason to assume that they have equivalent
beta distributions. They did not in this case, and most State Parks contributed
2012 G.R. Robinson 125
differently to one or the other category. One possible explanation is that the NHP
significant communities reflect different environmental prerequisites, for example
area-based constraints. Significant communities in some cases are delineated
for their relative size, and a look at the NHP database of Element Occurrences
in State Parks shows that mean mapped area for NHP significant communities is
478 ha, equivalent to the mean for vertebrates (532 ha), but much greater than
that for vascular plants (10 ha) or invertebrates (37 ha), and the bulk of the records
(496/768) are occurrences of plants or invertebrates. Although these values
tend to be estimates rather than finely delineated ranges, it seems clear that NHP
significant communities occupy larger areas than most rare species. Furthermore,
as part of their definition, the significant communities are found in relatively
pristine conditions, whereas rare species may occur in pockets that are embedded
in less pristine circumstances. These and other unmeasured variables may help
explain the divergent beta patterns.
State parks throughout the United States are heavily visited for recreational
use (Siikamȁki 2011), but they also share responsibilities for stewardship of natural
resources (Robinson 2012), a responsibility given explicit recognition in New
York State (NYS OPRHP 1993, 2011b). The NHP surveys covered in this paper
lend special emphasis and clarity to those responsibilities, and demonstrate that
the State Parks are valuable reservoirs of biodiversity. Literature on conservation
planning includes critical evaluations of conservation “portfolios”, with a goal of
maximizing conservation value by shedding parks and preserves that are overly
redundant, and replacing them with holdings that raise overall levels of protected
biodiversity (e.g., Fuller et al. 2010, Margules and Pressey 2000, Pressey et al.
1994). However, the exceptionally high beta diversity among New York State
Parks demonstrates that the agency manages a valuable conservation portfolio
with high levels of complementarity among parks, and with crucial contributions
from all geographic sectors.
Acknowledgments
Database access and assistance were provided by the NYS Natural Heritage Program,
with thanks to D.J. Evans, Nick Conrad, Tara Salerno, and Julie Lundgren. Field inventories
for the State Parks were conducted by many NHP scientists, including D.J. Evans, Tim
Howard, Julie Lundgren, David Van Luven, Paul Novak, Kathy Schneider, Kim Smith,
Troy Weldy, and Steve Young, funded by a grant from the NY State Biodiversity Research
Institute to Principal Investigator Tom Lyons, Director of Natural Resources, NYS OPRHP.
Thanks to many NY State Park scientists for advice and feedback, as well as Amanda Stein
(US NPS) and John Davis (UAlbany), and to three astute reviewers. Financial support was
provided by the NY Natural Heritage Trust (Contract NHT-548-09-01).
Literature Cited
Andelman, S.J., and W.F. Fagan. 2000. Umbrellas and flagships: Efficient conservation
surrogates or expensive mistakes? Proceedings of the National Academy of Sciences
97:5954–5959.
Andersen, A.N., and J.D. Majer. 2004. Ants show the way Down Under: Invertebrates
as bioindicators in land management. Frontiers in Ecology and the Environment
2:291–298.
126 Northeastern Naturalist Vol. 19, Special Issue 6
Anderson, M.J., T.O. Crist, J.M. Chase, M. Vellend, B.D. Inouye, A.L. Freestone, N.J.
Sanders, H.V. Cornell, L.S. Comita, K.F. Davies, S.P. Harrison, N.J.B. Kraft, J.C.
Stengen, and N.G. Swenson. 2010. Navigating the multiple meanings of Beta diversity:
A roadmap for the practicing ecologist. Ecology Letters 14:19–28.
Barbour, M.G., and W.D. Billings. 1988. North American terrestrial vegetation. Cambridge,
New York, NY. 434 pp.
Brooks, T.M., S.L. Pimm, and J.O. Oyugi. 1999. Time lag between deforestation and bird
extinction in tropical forest fragments. Conservation Biology 13:1140–1150.
Clough, Y., A. Holzschuh, D. Gabriel, T. Purtauf, D. Kleijn, A. Kruess, I. Steffan-Dewenter,
and T. Tscharntke. 2007. Alpha and beta diversity of arthropods and plants in
organically and conventionally managed Wheat fields. Journal of Applied Ecology
44:804–812.
Davis, F.W., Stoms, D.M., Estes, J.E., Scepan, J. and Scott, J.M. 1990. An information
systems approach to the preservation of biological diversity. International Journal of
Geographical Information Systems 4:55–78.
Edinger, G.J., D.J. Evans, S. Gebauer, T.G. Howard, D.M. Hunt, and A.M. Olivero. 2002.
Ecological communities of New York State. Second Edition. New York Natural Heritage
Program, New York State Department of Environmental Conservation, Albany,
NY. Available online at http://www.nynhp.org/. Accessed 12 November 2010.
Ferrier, S., R.L. Pressey, and T.W. Barrett. 2000. A new predictor of the irreplaceability
of areas for achieving a conservation goal, its application to real-world planning, and
a research agenda for further refinement. Biological Conservation 93:303–325
Fuller, R.A., E. McDonald-Madden, K.A. Wilson, J. Cowardine, H.S. Grantham, J.E.M.
Watson, C.J. Klein, D.C. Green, and H. Possingham. 2010. Replacing underperforming
protected areas achieves better conservation outcomes. Nature 466:365–367.
Grossman D.H, P. Bourgeron, W.-D.N. Buisch, D. Cleland, W. Platts, G.C. Ray, C.R. Roberts,
and G. Roloff. 1999. Principles for ecological classification. Pp. 353–393, In R.C.
Szaro, N.C. Johnson, W.T. Sexton, and A.J. Malk (Eds.). Ecological stewardship: A
common reference for ecosystem management. Vol. II. Elsevier Science, Oxford, UK.
Harrison, S., and E. Bruna. 1999. Habitat fragmentation and large-scale conservation:
What do we know for sure? Ecography 22:225–232.
He, F., and S.P. Hubbell. 2011. Species-area relationships always overestimate extinction
rates from habitat loss. Nature 473:368–371.
Hunter, M.I., G.L. Jacobson, Jr., and T. Webb III. 1988. Paleoecology and the coarsefi
lter approach to maintaining biological diversity. Conservation Biology 2:375–385.
Jennings, M.D. 2000. Gap analysis: Concepts, methods, and recent results. Landscape
Ecology 15:5–20.
Jost, L. 2007. Partitioning diversity into independent alpha and beta components. Ecology
88:2427–2439.
Kessler, M., S. Abrahamczyk, M. Bos, D. Buchori, D.D. Putra, S.R. Gradstein, P. Höhn,
J. Kluge, F. Orend, R. Pitopang, S. Saleh, C.H. Schulze, S.G. Sporn, I. Steffan-
Dewenter, S.S. Tjitrosoedirdjo, and T. Tscharntke. 2009. Alpha and beta diversity
of plants and animals along a tropical land-use gradient. Ecological Applications
19:2142–2156.
Koleff, P., K.J. Gaston, and J.J. Lennon. 2003. Measuring beta diversity for presenceabsence
data. Journal of Animal Ecology 72:367–382.
Launer, A.E., and D.D. Murphy. 1994. Umbrella species and the conservation of habitat
fragments: A case study of a threatened butterfly and a vanishing grassland ecosystem.
Biological Conservation 69:145–153.
Lund, M., and C. Rahbek. 2002. Cross-taxon congruence in complementarity and conservation
of temperate biodiversity. Animal Conservation 5:163–171.
2012 G.R. Robinson 127
MacArthur, R.H., and E.O. Wilson. 1967. The Theory of Island Biogeography. Princeton
University Press, Princeton, NJ.
MacNally, R., E. Fleishman, L.P. Bulluck, and C.J. Betrus. 2004. Comparative influence
of spatial scale on beta diversity within regional assemblages of birds and butterflies.
Journal of Biogeography 31:917–929.
Magurran, A.E. 2004. Measuring Biological Diversity. Blackwell, Malden, MA.
Margules, C.R., and R.L. Pressey. 2000. Systematic conservation planning. Nature
405:243–253.
Morin, P.J. 1999. Community Ecology. Blackwell, London, UK. 320 pp.
Mueller-Dombois, D., and H. Ellenberg. 1974. Aims and Methods of Vegetation Ecology.
Wiley, New York, NY. 547 pp.
Muir, J. 1909. Our National Parks. Houghton Mifflin, New York, NY. 382 pp.
Murphy, D.D., P.S. Weiland, and K.W. Cummins. 2011. A critical assessment of the use
of surrogate species for conservation planning in the Sacramento-San Joaquin Delta,
California (USA). Conservation Biology 25:873–878.
NatureServe. 2002. NatureServe Element Occurrence Data Standard. Available online at
http://www.natureserve.org/prodServices/eodata.jsp. Accessed 13 October 2009.
New York Natural Heritage Program (NY NHP). 2005a. Biodiversity in New York’s
State Park system: Summary of findings. Report for the New York State Office of
Parks, Recreation and Historic Preservation. Albany, NY. Available online at http://
nysparks.state.ny.us/environment/biodiversity.aspx. Accessed 8 September 2008.
NY NHP. 2005b. Rarity rank definitions and community system definitions. Available
online at http://www.acris.nynhp.org/ranks.php. Accessed 22 February 2009.
New York State Office of Parks, Recreation and Historic Preservation (NYS OPRHP)
1993. Fostering environmental stewardship: A first report on managing and protecting
the natural and cultural resources of the New York State Park system. Albany, NY.
NYS OPRHP. 2011a. State parks. Available online at http://nysparks.state.ny.us/parks/.
Accessed 3 August 2011.
NYS OPRHP. 2011b. Master plans. Available online at http://nysparks.state.ny.us/insideour-
agency/master-plans.aspx. Accessed 7 June 2011.
Noon, B.R, D.D. Murphy, S.R. Beissinger, M.L. Shaffer, and D. DellaSala. 2003. Conservation
Planning for US National Forests: Conducting Comprehensive Biodiversity
Assessments. BioScience 53:1217–1220.
Noss, R.F. 1987. From plant communities to landscapes in conservation inventories. A
look at the Nature Conservancy (USA). Biological Conservation 41:11–37.
Noss, R.F., and A.Y. Cooperrider. 1994. Saving Nature’s Legacy: Protecting and Restoring
Biodiversity. Island Press, Washington, DC. 416 pp.
Oliver, I., A.J. Beattie, and A. York. 1998. Spatial fidelity of plant, vertebrate, and invertebrate
assemblages in multiple-use forest in eastern Australia. Conservation Biology
12:822–25.
Pearman, P.B., M.R. Penskar, E.H. Schools, and H.D. Enander. 2006. Identifying potential
indicators of conservation value using natural heritage occurrence data. Ecological
Applications 16:86–201.
Pharo, E.J., A.J. Beattie, and D. Binn. 1999. Vascular plant diversity as a surrogate for
bryophyte and lichen diversity. Conservation Biology 13:282–292.
Pimm, S.L., G.J. Russell, J.L. Gittleman, and T.M. Brooks. 1995. The future of biodiversity.
Science 269:347–350.
Pressey, R.L., I.R Johnson, and P.D. Wilson. 1994. Shades of irreplaceability: Towards a
measure of the contribution of sites to a reservation goal. Biodiversity and Conservation
3:242–262.
128 Northeastern Naturalist Vol. 19, Special Issue 6
Quinn, J.F., and S.P. Harrison. 1988. Effects of habitat fragmentation and isolation on
species richness: Evidence from biogeographic patterns. Oecologia 75:132–140.
Reschke, C. 1990. Ecological communities of New York State. NY Natural Heritage
Program, Latham, NY.
Reyers, B., D.H.K. Fairbanks, A.S. Van Jaarsveld, and M. Thompson. 2001. Priority
areas for the conservation of South African vegetation: A coarse-filter approach. Diversity
and Distributions 7:79–95.
Robinson, G.R. In Press. Assessing the conservation significance of a state park system,
New York, USA. Natural Areas Journal.
Robinson, G.R., and J.F. Quinn. 1992. Habitat fragmentation and the design of nature
reserves. Pp. 223–248, In S.K. Jain and L. Botsford (Eds.). Applied Population Biology.
Kluwer Academic, Dordrecht, Netherlands.
Sætersdala, M., I. Gjerdea, H.H. Blom, P.G. Ihlen, E.W. Myrseth, R. Pommerescheb, J.
Skartveitb, T. Solhøyb, and O. Aas. 2003. Vascular plants as a surrogate species group
in complementary site selection for bryophytes, macrolichens, spiders, carabids,
staphylinids, snails, and wood-living polypore fungi in a northern forest. Biological
Conservation 115:21–31.
Sarkar, S. R.L. Pressey, D.P. Faith, C.R. Margules, T. Fuller, D.M. Stoms, A. Moffett,
K.A. Wilson, K.J. Williams, P.H. Williams, and S. Andelman. 2006. Biodiversity conservation
planning tools: Present status and challenges for the future. Annual Review
of Environment and Resources 31:123–159.
Scott, J.M., B. Csuti, J. Jacobi, and J.E. Estes. 1987. Species richness, a geographic approach
to protecting future biological diversity. BioScience 37:782–788.
Siikamȁki, J. 2011. Contributions of the US state park system to nature recreation. Proceedings
of the National Academy of Sciences 108:14031–14036.
Stevens, R.D., and M.R. Willig. 2002. Geographical ecology at the community level:
Perspectives on the diversity of new world bats. Ecology 83:545–560.
Su, C., D.M. Debinski, M.E. Jakubauska, and K. Kindscher. 2004. Beyond species richness:
Community similarity as a measure of cross-taxon congruence for coarse-filter
conservation. Conservation Biology 18:167–73.
Terlizzi, A., M.J. Anderson, S. Bevilacqua, S. Fraschetti, M. Włodarska-Kowalczuk,
and K.E. Ellingsen. 2009. Beta diversity and taxonomic sufficiency: Do higherlevel
taxa reflect heterogeneity in species composition? Diversity and Distributions
15:450–458.
Thorne, J.H., D. Cameron, and J.F. Quinn. 2006. A conservation design for the central
coast of California and the evaluation of the Mountain Lion as an umbrella species.
Natural Areas Journal 26:137–148.
Tognelli, M. 2005. Assessing the utility of surrogate groups for the conservation of South
American terrestrial mammals. Biological Conservation 121:409–417.
Tuomisto, H. 2010. A diversity of beta diversities: Straightening up a concept gone awry.
Part 2. Quantifying beta diversity and related phenomena. Ecography 33:23–45.
Veech, J.A., and T.O. Crist. 2007. Habitat and climate heterogeneity maintain beta
diversity of birds among landscapes within ecoregions. Global Ecology and
Biogeography16:650–656.
Ward, T.J., M.A. Vanderklift, A.O. Nicholls, and R.A. Kenchington. 1999. Selecting
marine reserves using habitats and species assemblages as surrogates for biological
diversity. Ecological Applications 9:691–698.
Whittaker, R.H. 1972. Evolution and measurement of species diversity. Taxon 21:213–251.
Whittaker, R.H. 1975. Communities and Ecosystems. Macmillan, New York, NY. 385 pp.
Williams, P.H., D. Faith, L. Manne, W. Sechrest, and C. Preston. 2006. Complementarity
analysis: Mapping the performance of surrogates for biodiversity. Biological Conservation
128:253–264.


 The Northeastern Naturalist is a peer-reviewed journal that covers all aspects of natural history within northeastern North America. We welcome research articles, summary review papers, and observational notes.