2013 SOUTHEASTERN NATURALIST 12(1):171–196
Seasonality and Spatial Variation in Nekton Assemblages
of the Lower Apalachicola River
Robert Gorecki1,* and Matthew B. Davis1
Abstract - The results of statistical analyses conducted on monthly trawl and seine data
collected from a multiyear fisheries-independent monitoring program, between July 2006
and March 2009 on the lower Apalachicola River, FL were used to determine which
regions of the river, and what time of year should be further studied to determine if and
how freshwater flow alterations affect the nekton. Differences in nekton community
structure were clear between each of the 3 predefined habitat regions for shoreline seine
catches. Deepwater trawled habitats showed a distinct difference between the upper
river channel and both distributary regions, and less pronounced differences between
the two distributary regions. The strongest pattern in seasonality of nekton communities
coincides with seasonal fluctuations in recruitment of juveniles into the estuary and the
periods of greatest salinity differences in the marshgrass-dominated lower distributary
region for shoreline and deepwater habitats. Seasonal variations in community structure
were evident and mostly likely dominated by recruitment, whereas the response of organisms
to fluctuations in salinity may be dictated by their relative position within the
lower reaches of the Apalachicola River system. Our results suggest that future studies
of the effects of changes in flow on nekton assemblages in the lower Apalachicola River
would best be performed during the dry season in the upper and lower portions of the
distributary region.
Introduction
The Apalachicola River and Apalachicola Bay system in the Florida Panhandle
is one of the most biologically productive and relatively undeveloped
river-dominated estuarine systems in the southeastern United States. The lower
Apalachicola River encompasses varying habitats from freshwater hardwood
swamps to saltwater marshes (Livingston 1983). The area supports a thriving
sport and commercial fishery that lands 90% of the state’s oysters and has the
third-highest shrimp catch in Florida (Chanton and Lewis 1999). The Apalachicola
River basin drains an area of roughly 30,900 km² and includes tributaries
from Florida, Georgia, and Alabama. It has the greatest river flow rate in Florida
and is the only river in Florida that originates in the Piedmont of the Appalachian
Mountains. The alluvial freshwater flow of the Apalachicola River is the
most important factor controlling seasonal nutrient and salinity levels within the
Apalachicola Bay system (Livingston 1983).
As the global population increases human needs and demands for freshwater
continue to grow, the ecological consequences can be substantial if the needs of
freshwater ecosystems and species are neglected in water-management programs
¹Fish and Wildlife Research Institute, Florida Fish and Wildlife Conservation Commission,
350 Carroll Street, Eastpoint, FL 32328. *Corresponding author- Bob.Gorecki@
myfwc.com.
172 Southeastern Naturalist Vol. 12, No. 1
(Richter et al. 2003). On the Apalachicola River and throughout the world, reduced
periods of rainfall and increased water withdrawal in the upper portions
of watersheds have raised concerns about the effects of reduced freshwater flow
on biodiversity and freshwater ecosystems (Chanton and Lewis 1999, Livingston
1997, Livingston et al. 1997, Richter et al. 2003). Flow alterations due to
anthropogenic actions and changing climate may reduce biological production
and further harm already depleted populations in the Apalachicola River and Bay
system (Livingston et al. 1997).
The broad range of variability in physical and biological parameters of estuarine
systems necessitates the use of long-term data sets in order to detect
meaningful patterns and trends in each system (Tsou and Matheson 2002).
Little is known about the diversity of the fish and mobile macroinvertebrates
(nekton) in the tidal reaches of the Apalachicola River (FWC-FMRI 2000),
despite previous nekton research conducted in Apalachicola Bay (Chanton
and Lewis 1999; FDEP-FMRI 1998; Livingston 1997; Livingston et al. 1977,
1997; Subrahmanyam and Coultas 1980). We investigated seasonal and spatial
variations in the nekton community of the lower Apalachicola River basin
to assess what time of year and which regions of the river should be studied
further to determine how and whether alterations in freshwater flow affect the
nekton of the Apalachicola River.
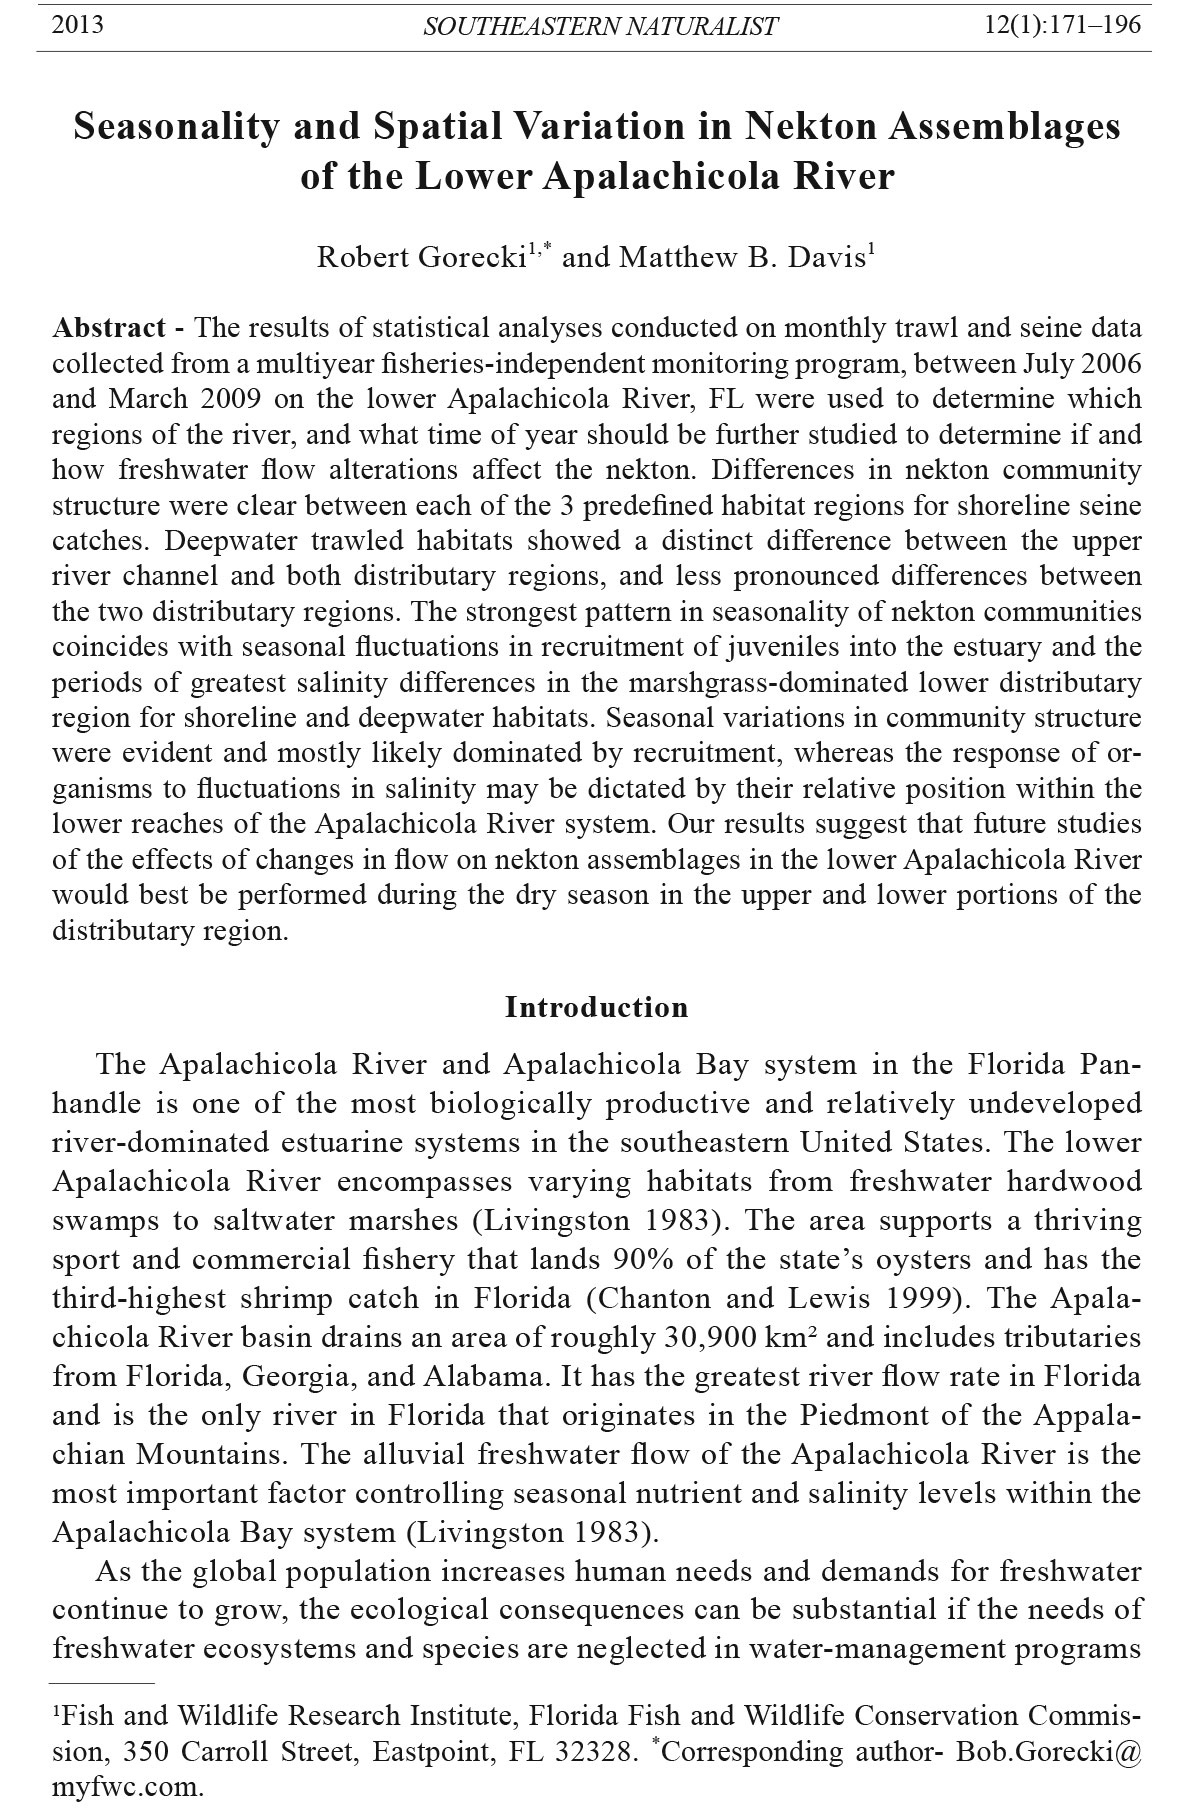
Study Area
The sampling area is located in the lower Apalachicola River and its distributaries
and was stratified into three regions based on differences in habitat and
salinity (Fig. 1). The marshgrass-dominated lower distributary region (MLD),
which begins at river mile 0 and extends to the tree-line on the river located
near river mile 5, typically has higher salinities (0.2–11.4 ppt) than the other
regions. The shoreline vegetation in this region consists of varying compositions
of marsh grasses: Spartina spp. (cordgrass), Scirpus spp. (bulrush), Phragmites
australis Cavanilles, Trinius, and Steudel (Common Reed), Typha spp. (cattails),
and Cladium spp. (sawgrass). The bottom substrate consists of sandy mud with
patchy areas of bottom vegetation including Chara spp. (muskgrass), Vallisneria
spp. (tapegrass), and Ruppia spp. (widgeon grass). The forested upper distributary
region (FUD), which begins at the tree-line (river mile 5) and extends to the
point of division of the main river channel into the distributary portion of this
river system (river mile 11), is characterized by mostly mixed hardwood, as well
as cypress and tupelo swamp shorelines, with oligohaline conditions (0.1–4.7
ppt). Bottom substrate and vegetation are similar to those of the MLD region,
except that Ruppia spp. was not detected. The upper river channel region (URC;
river miles 11–22) is characterized by tupelo, cypress, and hardwood swamp,
steeper banks, freshwater salinities (0.1 ppt), and an array of small narrow tributaries.
Bottom substrates are similar to those of the other regions, while bottom
vegetation is less widespread and consists mainly of Chara spp. and Limnophila
2013 R. Gorecki and M.B. Davis 173
sessiloflora Vahl and Blume (Asian Marshweed). While the URC is longer than
the other two regions, this is largely due to there being a lack of visible differences
in habitat and no measured differences in salinity throughout this region.
The downstream extent of the URC is at the division of the main river channel
into the distributary portion of this river system where the FUD begins, and the
upstream extent of the URC at mile 22 coincides with the upstream extent of the
tidal signal in this river system.
Methods
Sampling
Nekton was sampled monthly from July 2006 through March 2009 with
a 21.3-m center-bag seine (3.2-mm stretched mesh) and a 6.1-m otter trawl
(38-mm stretched mesh and a 3-mm mesh liner) that targeted smaller fishes
Figure 1. Map of
the lower Apalachicola
River
s h o w i n g t h e
three sampling
r e g i o n s . T h e
sampled waters
are highlighted,
and the black
lines delineate
borders between
the 3 sampling
regions.
174 Southeastern Naturalist Vol. 12, No. 1
(generally of 15–100 mm standard length). Seines were deployed in shoreline
habitats with water depths ≤1.8 m; while some of the Apalachicola river system’s
shoreline has steeper banks with water depths >1.8 m, these areas were
not sampled with the seine due to the limitations of the gear. Trawl collections
were deployed in deepwater habitats at depths of 1.8–7.6 m. Seine and trawl
samples were collected monthly at sites selected according to a stratified random
sampling design. Each of the three regions was divided into grid cells of
0.1′ lat × 0.1′ long, and 32 of these cells were randomly selected for sampling
each month in the MLD (11 sites per month, 4 trawl tows, 7 seine hauls), FUD
(9 sites per month, 3 trawl tows, 6 seine hauls), and URC (12 sites per month, 6
trawl tows, 6 seine hauls) regions. To sample the steep banks of the Apalachicola
River and its distributaries, seines were deployed by boat in a semi-ellipse
along the shoreline, and then hand-pulled onshore (approximate sampling area
= 68 m²). The otter trawl was deployed in the river channel from a slowly moving
vessel (0.5–1.0 m/s). Trawl tows were made against current flow, which
varied with tide and wind conditions. Boat speed was adjusted in an attempt to
cover 185 m during a 5-min tow, but actual tow distance was calculated from
GPS coordinates. Catch per unit effort (CPUE) for both types of sampling gear
are reported as number of animals per 100 m².
All fish and selected invertebrates (recreationally or commercially important
species, e.g., Litopenaeus setiferus L. [White Shrimp] and Callinectes
sapidus Rathbun [Blue Crab]) were identified in the field to the lowest
possible taxonomic level (usually species). Juveniles of several species
(Farfantepenaeus spp. <15 mm postorbital head length, Lepomis spp. <20 mm
standard length, Eucinostomus spp. <40 mm standard length, and Gobiosoma
spp. <20 mm standard length) were identified only to genus because of difficulty
in accurately identifying them to species in the field (e.g., Matheson
and McEachran 1984). Additionally, all Menidia spp. and Brevoortia spp.
were identified only to genus due to frequent hybridization and the impracticality
of diagnostic characters (Duggins et al. 1986, Echelle and Echelle
1997, Greenwood et al. 2007). For each species collected on a given sampling
trip, representative samples were retained to verify field identifications. Any
specimens that could not be positively identified in the field were taken back
to the laboratory for identification. Water chemistry data (temperature, salinity,
dissolved oxygen, and pH) were recorded starting at a depth of 0.2 m and
subsequently at every 1.0-m interval to just above the bottom. Mean values of
measured water-chemistry parameters were used in analyses.
Data analyses
We conducted multivariate analyses to investigate the temporal and spatial
patterns of nekton assemblages in the Apalachicola River (PRIMER
v6, PRIMER-E Ltd., UK; Clarke and Gorley 2006). Data from trawl tows
and seine hauls were analyzed separately utilizing square-root-transformed
monthly mean densities (fish per 100 m²) to improve normality and reduce the
2013 R. Gorecki and M.B. Davis 175
influence of patchy but abundant species. Bray-Curtis similarities (Bray and
Curtis 1957) were calculated for each pair of samples, and the relationships
between all samples were displayed graphically using non-metric multidimensional
scaling (MDS). MDS was also used to determine seasonal patterns
in nekton assemblages in conjunction with CLUSTER analysis as shown in
Clarke (1993). Two-way and one-way analysis of similarities (ANOSIM; explained
in Clarke 1993) were used to examine temporal (i.e., seasonal) and
spatial (i.e., river region) differences in nekton community structure. The
sampling data were stratified into three regions based on the differences in
habitat and salinity discussed earlier. Based on MDS plots and CLUSTER
dendrograms (Figs. 2–5), sampling data were divided into seasons. For most
habitats and river regions there were two seasons: the wet season (January–
April) and the dry season (May–December). The cutoff for selecting clusters
was set at 40% since this level seemed to show a temporal trend in both the
CLUSTER dendrograms and the CLUSTER overlays on the MDS plots and
showed three seasons: the wet season (January–April), a warm dry season
(May–September), and a cool dry season (October–December). Shoreline
habitats in the URC had three seasonal groupings with a cluster selection
cutoff of 60% showing the best temporal trend. Thus, the monthly catch data
dictated the division between seasons for further analyses, which correlated
to apparent historic seasonal changes in water flow and rainfall according
to the data in Light et al. (2006), while the URC seemed to also be influenced
by other factors during the dry season. We used similarity percentage
(SIMPER) analysis to determine characteristic groups of nekton, based on
definitions provided by Deegan et al. (2000), for each region. Correlations
between nekton abundance and environmental variables (measured during
biological sampling) were investigated by comparing Bray-Curtis similarities
with normalized salinity, dissolved oxygen, and temperature measurements
using the BIOENV routine (explained by Clarke 1993) in PRIMER. Finally,
a distance matrix was created for monthly samples following the methods
of Tsou and Matheson (2002), wherein the distance between November and
December and the distance between November and October was one, the
distances between November and January and between November and September
was two, etc. This matrix and the respective Bray-Curtis similarity
matrix for each habitat (collection method) were then applied to the RELATE
routine in Clarke and Warwick (2001) to investigate correlations between seasonal
patterns and community structure, similar to the process used in Tsou
and Matheson (2002) and Idelberger and Greenwood (2005). Utilizing this
procedure, the greater and closer to 1 that ρ is indicates a stronger monthly
relationship to changes in nekton abundance. Likewise, for smaller ρ-values
temporal cycles of change in nekton abundance are much weaker. Comparing
temporal relationships in this manner was done to obtain greater confidence in
ANOSIM tests for seasonality due to the high stress levels on MDS plots.
176 Southeastern Naturalist Vol. 12, No. 1
Figure 2. Shoreline
data [seined
habitats] MDS
plots displaying
the relationship
of nekton species
composition
by month
for each region:
a) marshgrassdominated
lower
distributary, b)
forested upper
distributary, and
c) upper river
channel, for
seine catches in
the lower Apalachicola
River,
J u l y 2 0 0 6 –
March 2009
(2D stress =
0.18–0.21). The
numbers represent
months (1
= January, 2 =
February, etc.).
The circles overlaid
on these
plots represent
g r o u p s f r o m
cluster analyses
that are ≥40%
similar.
2013 R. Gorecki and M.B. Davis 177
Figure 3. Shoreline data [seined
habitats] CLUSTER dendrograms
displaying the relationship of nekton
species composition by month
for each region: a) marshgrassdominated
lower distributary, b) forested
upper distributary, and c) upper
river channel, for seine catches in
the lower Apalachicola River, July
2006–March 2009. The numbers
along the x-axis represent months
(1 = January, 2 = February, etc.) and
symbols denote seasons.
178 Southeastern Naturalist Vol. 12, No. 1
Figure 4. Deepwater
data MDS
plots displaying
the relationship
of nekton species
composition
by month
for each region:
a) marshgrassd
o m i n a t e d
lower distributary
b) forested
upper distributary,
and c) upper
river channel,
for trawl
catches in the
lower Apalachicola
River,
J u l y 2 0 0 6 –
March 2009
(2D stress =
0.18–0.21). The
numbers represent
months
(1 = January,
2 = February,
etc.). The circles
overlaid on
these plots represent
groups
f rom clus ter
analyses that
are ≥40% similar.
2013 R. Gorecki and M.B. Davis 179
Figure 5. Trawl data, deepwater
habitats, CLUSTER dendrograms
displaying the relationship of nekton
species composition by month for
each region: a) marshgrass-dominated
lower distributary, b) forested
upper distributary, and c) upper
river channel, for seine catches in
the lower Apalachicola River, July
2006–March 2009. The numbers
along the x-axis represent months
(1 = January, 2 = February, etc.) and
symbols denote seasons.
180 Southeastern Naturalist Vol. 12, No. 1
Results
Water temperatures at sampling sites in the Apalachicola River ranged from
10.2 to 31.1 °C and were similar in all three sampling regions each season
(Fig. 6a). The MLD region was the only region to show a seasonal salinity trend,
typically low in winter (0.2–0.4 ppt) and higher throughout the rest of the year
(1.2–11.4 ppt) (Fig. 6b). In the FUD region, salinity ranged from 0.1 to 4.7 ppt
with a mean of 1.3 ppt, and salinity in the URC was consistent throughout the
study at 0.1 ppt (Fig. 6b). Dissolved oxygen was similar in all regions, ranging
from 4.4 to 10.9 mg/l (Fig. 6c). Dissolved oxygen minima coincided with periods
of high temperature and elevated salinity.
Figure 6. Variability in mean a) water temperature, b) salinity, and c) dissolved oxygen
concentration recorded at the sample sites, July 2006–March 2009. Error bars indicate
standard error. Data are divided by region: marshgrass-dominated lower distributary
(MLD), forested upper distributary (FUD), and upper river chann el (URC).
2013 R. Gorecki and M.B. Davis 181
A total of 314,042 animals was collected from 626 seine hauls and 424 trawl
tows (Table 1). A total of 122 taxa, including 114 species of fish and 8 selected
species of macroinvertebrates, was represented. Species richness was generally
greatest from August through November (77–89 taxa collected) and least from
January through April (57–64 taxa collected) (Appendix 1).
A total of 107,374 animals, representing 113 species, was collected in seine
hauls, accounting for a mean density estimate of 252 animals/100 m2 (Table 1).
The 10 most abundant taxa (n = 84,139) represented 78.4% of the total seine
catch. Anchoa mitchilli (Bay Anchovy) (n = 19,949) and Trinectes maculatus
(Hogchoker) (n = 19,416) were the most abundant taxa collected, accounting for
36.7% of the total catch; T. maculatus was the most frequent taxon caught (65%
occurrence) (Table 1).
A total of 206,668 animals, represented by 94 species, were collected in trawl
tows, accounting for a mean density estimate of 65.9 animals/100 m2 (Table 1).
A. mitchilli (n = 141,420) was the most abundant species collected, accounting
Table 1. Catch statistics for 10 dominant taxa collected in six hundred twenty-six 21.3-m centerbag
seine samples and four hundred twenty-four 6.1-m otter trawl samples during Apalachicola
River stratified-random sampling, July 2006–March 2009. Percent (%) is the percent of the total
catch represented by that taxon; percentage occurrence (% occur) is the percentage of samples in
which that taxon was collected.
Fish caught
Species n % % occur
21.3-m center-bag seine
Anchoa mitchilli 19,949 19.0 26.0
Trinectes maculatus 19,416 18.0 66.5
Brevoortia spp. 10,753 10.0 9.4
Menidia spp. 9713 9.0 29.4
Cyprinella venusta 7502 7.0 34.0
Lucania parva 4159 3.9 22.4
Eucinostomus spp. 3289 3.1 31.3
Notropis petersoni 3170 3.0 29.2
Mugil cephalus 3131 2.9 7.0
Notropis texanus 3057 2.8 22.5
Subtotal 84,139 78.0
Totals 107,374 100.0
6.1-m otter trawl
Anchoa mitchilli 141,420 68.0 41.5
Litopenaeus setiferus 14,865 7.2 18.4
Micropogonias undulatus 14,682 7.1 26.9
Trinectes maculatus 9174 4.4 51.4
Cynoscion arenarius 7813 3.8 21.5
Eucinostomus spp. 3445 1.7 26.2
Ictalurus punctatus 2989 1.4 34.9
Leiostomus xanthurus 3073 1.5 22.2
Callinectes sapidus 1529 0.7 43.6
Notropis texanus 1400 0.7 23.3
Subtotal 200,390 97.0
Totals 206,668 100.0
182 Southeastern Naturalist Vol. 12, No. 1
for 68.3% of the trawl catch (Table 1). The taxa most frequently collected in trawl
tows were T. maculatus (51.4% occurrence) and C. sapidus (43.6% occurrence).
Community structure in shoreline habitats
The spatial variation in nekton communities associated with shoreline
habitats (sampled by seining) of the lower Apalachicola River was significantly
different between the three river-study regions as shown by the two-way
ANOSIM (season and region) results (ANOSIM R = 0.670, P = 0.01). Overall,
pairwise comparisons revealed that the difference in community structure between
adjacent regions increased with distance upstream. There were major
differences in community structure, with some species overlap, between the
MLD and FUD regions (ANOSIM R = 0.468, P = 0.01) and somewhat more
pronounced differences between the FUD and URC regions (ANOSIM R =
0.569, P = 0.01). Significant and pronounced differences were evident between
community structures in the MLD and URC regions (ANOSIM R =
0.993, P = 0.01). The ANOSIM results and MDS plot suggest a relationship
between abundance and river region that is related to changes in salinity
(Fig. 7). The two-dimensional stress for the MDS plot of seine catches for all
regions was moderate (0.16), indicating that two dimensions do not fully represent
the similarities/dissimilarities of the regions.
Results from SIMPER analysis defined the shift from dominance by marine
transients to freshwater species in shoreline habitats with increasing distance
upstream. In the MLD region, the community was characterized by marine
Figure 7. Shoreline data MDS plots displaying the relationships between nekton species
composition and salinity by river region (M = marshgrass-dominated lower distributary,
F = forested upper distributary, U =upper river channel) for seine catches in the lower
Apalachicola River, July 2006–March 2009 (2D stress = 0.16). The size of the bubble
surrounding each data point corresponds to the average monthly salinity for that region
of the river; larger bubbles indicate relatively greater salinity.
2013 R. Gorecki and M.B. Davis 183
transients (Menidia spp., C. sapidus, Eucinostomus spp., A. mitchilli, Ctenogobius
boleosoma [Darter Goby], and Lagodon rhomboides [Pinfish]). In the FUD
region, the community comprised a mixture of marine transients (T. maculatus,
C. sapidus, Eucinostomus spp., Menidia spp.) and freshwater species (Lepomis
macrochirus [Bluegill], Micropterus salmoides [Largemouth Bass], Notropis
petersoni [Coastal Shiner], and Lepomis microlophus [Redear Sunfish]). In the
URC region, the community was dominated by freshwater species (Cyprinella
venusta [Blacktail Shiner], Notropis texanus [Weed Shiner], L. macrochirus,
N. petersoni, and Labidesthes sicculus [Brook Silverside]) and two marine transients
(T. maculatus and Callinectes sapidus).
Because of the differences in nekton assemblages between the three regions,
each region was examined for seasonal variations separately by both
one-way ANOSIM and comparisons of Bray-Curtis similarity matrices for the
monthly distance matrix and nekton community matrices using the RELATE
procedure. The farthest downstream MLD region showed the strongest trend
in seasonal variation (ANOSIM R = 0.600, P = 0.01; RELATE ρ = 0.535, P =
0.001), with January–April (the rainy season) displaying a different nekton
assemblage from that seen throughout the rest of the year (Figs. 2a, 3a). Community
differences along seasonal scales were also seen in the FUD region
(ANOSIM R = 0.331, P = 0.01; RELATE ρ = 0.395, P = 0.001), although not
as pronounced (Figs. 2b, 3b). The URC region showed small seasonal differences
(ANOSIM R = 0.243, P = 0.016) reinforced by the evidence of a small
difference between months based on the RELATE procedure (ρ = 0.311, P =
0.001) (Figs. 2c, 3c). Pairwise comparisons between the 3 seasons suggested
by cluster analysis indicates no difference between the warm dry and cool
dry seasons (ANOSIM R = 0.110, P = 0.065), slight differences between the
wet and warm dry season (ANOSIM R = 0.217, P = 0.002), and major differences
in community structure between wet and cool dry seasons (ANOSIM
R = 0.480, P = 0.001). SIMPER analysis indicates that the differences in the
community structure between the wet and dry seasons in the MLD and FUD
regions are a result of lower abundances of Menidia spp., A. mitchilli, Eucinostomus
spp., Lucania parva (Rainwater Killifish), N. petersoni, C. sapidus,
and C. boleosoma and greater abundances of Brevoortia spp., T. maculatus,
Gambusia holbrooki (Eastern Mosquitofish), L. rhomboides, and Mugil
cephalus (Striped Mullet) during the winter. SIMPER analyses indicated that
differences in community structure between the wet, warm dry, and cool dry
months in the URC region were due to increased abundance of T. maculatus
and M. cephalus and decreased abundance of most other taxa during the
winter wet season. The results also indicated that increased abundance of
mostly freshwater taxa (C. venusta, N. texanus, L. macrochirus, N. petersoni,
L. sicculus, and Opsopoeodus emilia [Pugnose Minnow]), as well as a few
marine transients (Eucinostomus spp., C. sapidus, and A. mitchilli), began in
the warm dry season and continued through the cool dry season, and that the
abundance of these taxa were greatly reduced in the wet season.
184 Southeastern Naturalist Vol. 12, No. 1
Community structure in deepwater habitats
In the deepwater habitats sampled by trawling, spatial community structure
was significantly different between river study regions as shown by the two-way
ANOSIM (season and region) results (ANOSIM R = 0.517, P = 0.01). Overall,
the greatest difference in community structure occurred between the MLD and
URC regions (ANOSIM R = 0.903, P = 0.01), followed by differences between
the URC and FUD regions (ANOSIM R = 0.368, P = 0.01), and the FUD and
MLD regions (ANOSIM R = 0.238, P = 0.01). Similar to the pattern seen in
shoreline habitats, the differences in community structure between regions increased
linearly with distance upstream. The MDS plot and ANOSIM results
suggest that differences in these distinct regionally based groupings are related
to changes in salinity (Fig. 8). The two-dimensional stress for the trawl MDS
plot was 0.18, again indicating that the two dimensions do not fully represent the
similarities/dissimilarities of the different regions.
SIMPER analyses defined a community shift from dominance by marine
transients to dominance by freshwater species with increasing distance upstream.
In the MLD region, community structure was characterized by the
marine transients (A. mitchilli, Micropogonias undulatus [Atlantic Croaker],
L. setiferus, Cynoscion arenarius [Sand Weakfish], and C. sapidus). In the
FUD region, the community comprised mostly marine transients (T. maculatus,
C. sapidus, Eucinostomus spp., A. mitchilli) and one freshwater species
(Ictalurus punctatus [Channel Catfish]). Meanwhile, the URC region was
Figure 8. Deepwater data MDS plots displaying the relationship of nekton species composition
by region (M = marshgrass-dominated lower distributary, F = forested upper
distributary, U = upper river channel) for trawl catches in the lower Apalachicola River,
July 2006–March 2009 (2D stress = 0.14). The bubble surrounding each data point corresponds
to the average monthly salinity for that region of the river; larger bubbles indicate
relatively greater salinity.
2013 R. Gorecki and M.B. Davis 185
dominated by two freshwater species (I. punctatus and N. texanus) and a marine
transient (T. maculatus).
We also separately examined seasonal variations in community structure for
each river region in deepwater habitats by one-way ANOSIM and the previously
discussed use of the RELATE procedure and monthly distance matrix because of
the differences in nekton assemblages between regions. The nekton communities
in the MLD region (ANOSIM R = 0.545, P = 0.01; RELATE ρ = 0.409, P = 0.001;
Figs. 4a, 5a) and the FUD region (ANOSIM R = 0.559, P = 0.01; RELATE ρ =
0.333, P = 0.001; Figs. 4b, 5b) showed the strongest difference in seasonal variation,
with January–April (the rainy season) clearly displaying a different nekton
assemblage from that seen throughout the rest of the year. The URC region
showed a very small seasonal difference (ANOSIM R = 0.266, P = 0.01; RELATE
ρ = 0.307, P = 0.001; Figs. 4c, 5c). SIMPER analysis suggests that temporal shifts
in community structure are due to decreased abundance of most dominant taxa
(i.e., N. texanus, T. maculatus, I. punctatus, A. mitchilli, Eucinostomus spp.) during
the wet season in all three river regions, whereas abundance of M. undulatus
and Leiostomus xanthurus (Spot) in the MLD region of the river increased during
the rainy season.
Correlations between fish abundance and environmental variables
Each region was examined separately for seasonal variations, and all regions
were analyzed collectively to evaluate correlations between spatial
variation in nekton assemblages and physical factors. As expected, of all
measured environmental factors, salinity was the most strongly correlated
with spatial differences in nekton assemblages between the three river regions
in both shoreline (BIOENV ρ = 0.459) and deepwater (BIOENV ρ = 0.309)
habitats and supported the MDS plots (Figs. 7, 8). The inclusion of other
measured physical factors in the analysis resulted in smaller BIOENV coefficients.
In shoreline habitats of the URC region, nekton assemblages were most
highly correlated with the combination of temperature and dissolved oxygen
(BIOENV ρ = 0.273). The inclusion of salinity had no effect on the BIOENV
coefficient, probably due to the lack of variation during the study. The pattern
in nekton assemblages was most highly correlated with the combination
of temperature and salinity (BIOENV ρ = 0.357) for shoreline habitats in the
FUD region, whereas the pattern in the MLD region was most highly correlated
with a combination of salinity, temperature, and dissolved oxygen
(BIOENV ρ = 0.461). In deepwater habitats, the pattern in nekton assemblages
was most highly correlated with temperature (BIOENV ρ = 0.314) in the URC
region, with the combination of salinity and temperature (BIOENV ρ = 0.310)
in the FUD region, and with a combination of salinity, temperature, and dissolved
oxygen (BIOENV ρ = 0.544) in the MLD region.
The RELATE procedure indicated that the influence of seasonal changes on
nekton communities was greatest in the MLD region (ρ = 0.535) and decreased
moving upstream through the FUD (ρ = 0.395) and URC (ρ = 0.311) regions. This
186 Southeastern Naturalist Vol. 12, No. 1
pattern of a greater correlation between variation in nekton community and seasonal
changes was also evident in deepwater habitats from the URC region (ρ =
0.307) through the FUD region (ρ = 0.333) and into the MLD region (ρ = 0.409).
This agrees with the pattern observed in the CLUSTER dendrograms, MDS plots,
and ANOSIM results for both trawl and seine catches (Figs. 2–5).
Discussion
Multivariate statistical analyses of our data revealed patterns in the spatial
distribution of species within both shoreline and deepwater habitats throughout
the lower Apalachicola River basin. Species assemblages in the URC region
were characterized by freshwater species and were significantly different from
those of the brackish distributaries. Marine transient species dominated nekton
assemblages in the mesohaline MLD region, whereas the oligohaline FUD region
represented a transitional area of suitable conditions for both marine transient
and freshwater species. These results are similar to findings by Gelwick et al.
(2001) in Matagorda Bay estuary on the Texas Coast, where the system was
separated into regions based on salinity differences ranging from fresh (salinity
< 5) to estuarine water (salinity > 15). Between regions, significant differences
in nekton assemblages were attributed to the dif ferences in salinity.
Our results are largely based on two distinct seasons that corresponded
to one wet and one dry season. This division is supported by the historical
flow levels reported by Light et al. (2006); they reported that distinct peaks
in flow occurred in January through April and that flow levels were typically
lower throughout the rest of the year. Greenwood et al. (2007) found little
evidence of nekton seasonality in the upper reaches of the Alafia River estuary,
which they attributed to both reduced penetration of marine and estuarine
transient species and to domination by low-salinity and freshwater assemblages.
Similarly, the URC and the FUD regions of the Apalachicola River
were dominated by freshwater taxa and marine transient species tolerant of
low salinities. The strongest patterns in seasonality of nekton communities
corresponded with the periods of greatest salinity fluctuations within the
MLD region and are supported by high correlations for salinity in BIOENV
results. A decreasing correlation between salinity and nekton assemblages as
you go upstream is evident in BIOENV results, with salinity correlating or
explaining some of the relationship between nekton assemblages and environmental
factors in the FUD region, and correlating very little with nekton
assemblages in the URC region. This finding underscores the need for further
study of the effects of river flow in MLD and FUD portions of the system,
since nekton assemblages were hardly influenced by salinity changes in the
URC region throughout this study. Considering that salinity was the only environmental
factor that varied strongly between regions, it is not surprising
that it explained the majority of the differences in species abundances. Livingston
(1997) suggested that changes in the nekton assemblages of East Bay,
2013 R. Gorecki and M.B. Davis 187
an estuarine part of the Apalachicola Bay system, may be more directly linked
to biological interactions such as competition and predator–prey relationships.
Our study did not investigate the effects of biological interactions on
assemblages, but did find a strong correlation between environmental factors
and nekton assemblages in both shoreline and deepwater habitats of the MLD
region (BIOENV ρ = 0.461–0.544), and we feel that there is a direct link between
salinity and changes in nekton assemblages within the MLD region.
Biological interactions probably do not influence nekton assemblages in the
MLD region of the river as strongly as Livingston (1997) suggests in adjacent
East Bay.
Results of SIMPER analyses for both shoreline and deepwater habitats
indicate that the seasonal differences in nekton assemblages were primarily
due to decreased abundance of most taxa and greater abundance of Brevoortia
spp., T. maculatus, G. holbrooki, L.rhomboides, M. cephalus, M. undulatus,
and L. xanthurus during the wet season. These annual fluctuations in abundance
coincide with the period of juvenile recruitment for Brevoortia spp.,
M. cephalus, M. undulatus, L. rhomboides, and L. xanthurus. The recruitment
of many other species of nekton increased overall recruitment during the
river’s dry season, including C. arenarius, L. setiferus, A. mitchilli, Farfantepenaeus
spp., Eucinostomus spp., and many centrarchid fishes (FWC-FMRI,
St. Petersburg, FL, unpubl. data; Idelberger and Greenwood 2005; Kupschus
and Tremain 2001). Tremain and Adams (1995) attributed changes in the fish
assemblages of the Indian River Lagoon to variations in water temperature and
estuarine fish recruitment. Idelberger and Greenwood (2005) also stated that
recruitment of a majority of estuarine-dependent fish species occurred during
the period of May/June through September/October, and that another group
(e.g., L. rhomboides, L. xanthurus, and M. cephalus) showed a pattern of fall
spawning and winter recruitment into the Myaka and Peace rivers. Juvenile recruitment
seems to coincide with changes in salinity in the Apalachicola River
system but is more likely a function of a more complex interaction of biotic
(e.g., life histories and behavior) and abiotic (i.e., photoperiod and temperature
changes) factors (Kupschus and Tremain 2001).
Seine and trawl catches both displayed similar seasonal and spatial patterns
in nekton assemblages. However, a complete survey of the area using both gear
types would present a more thorough picture of effects on all species since these
two gear types sample different habitats and do not collect comparable numbers
of some species (FDEP-FMRI 1998; Appendix 1). Seasonal trends in nekton assemblages
coincide with seasonal fluctuations in salinity in the MLD and FUD
regions of the river, but there was no apparent trend or variation in salinity in the
URC region. Salinity also appeared to be relatively low throughout all three river
regions throughout the wet season. This finding indicates that further sampling
and analyses during the dry season on the MLD and FUD regions of the river
would be best for detecting whether and when changes in flow affect the river’s
nekton assemblages.
188 Southeastern Naturalist Vol. 12, No. 1
The lower Apalachicola River represents an ecologically diverse transition
zone between the estuarine Apalachicola Bay and the freshwater Apalachicola
River. The transition between estuarine and freshwater systems is most evident
in the salinity gradient and corresponding differences in nekton assemblages.
Seasonal fluctuations in juvenile recruitment into the estuary seem to dominate
seasonal shifts in community structure, whereas fluctuations in salinity may
dictate whether and when some species enter the lower portion of the river.
With increased anthropogenic demands for freshwater in the northern part of
the watershed, insights from our study may influence impending changes in
water management practices on the Apalachicola River. The results presented
here suggest future studies on the effects of changes in freshwater flow on
nekton assemblages in the lower Apalachicola River could be performed using
both trawl and seine sampling data and concentrating sampling effort to the
dry season in the FUD and MLD regions of the river would be a more efficient
use of time and funding.
Acknowledgments
We thank fisheries-independent monitoring personnel from the FWRI Apalachicola
Field Laboratory for collecting data and assisting with the preparation of this paper. We
especially thank P.W. Stevens, D. Tremain, D.A. Blewett, K. Flaherty, B. McMichael, and
C. Guenther for their insightful help in editing and discussing this document. This project
was made possible thanks to the generous funding support provided by the Florida Fish
and Wildlife Conservation Commission’s Florida Wildlife Legacy Initiative and the US
Fish and Wildlife Service’s State Wildlife Grant program (T-9 Grant Number SWG05-
017). Additional funding support for this project was provided by the Department of
the Interior, US Fish and Wildlife Service, Federal Aid for Sportfish Restoration Project
Number F-43, and Florida saltwater fishing license monies.
Literature Cited
Bray, J.R., and J.T. Curtis. 1957. An ordination of upland forest communities of southern
Wisconsin. Ecological Monographs 27:325–349.
Chanton, J.P., and F.G. Lewis. 1999. Plankton and dissolved inorganic carbon isotopic
composition in a river-dominated estuary: Apalachicola Bay, Florida. Estuaries
22(3):575–583.
Clarke, K.R. 1993. Non-parametric multivariate analyses of changes in community structure.
Australian Journal of Ecology 18:117–143.
Clarke, K.R., and R.N. Gorley. 2006. PRIMER V6: User Manual/Tutorial. PRIMER-E,
Plymouth, UK. 181 pp.
Clarke, K.R., and R.M. Warwick. 2001. Change in Marine Communities: An Approach
to Statistical Analysis and Interpretation, 2nd Edition. Natural Environment Research
Council, Plymouth Marine Laboratory, Plymouth, UK. 161 pp.
Deegan, L.A., J.E. Hughes, and R.A. Rountree. 2000. Salt marsh ecosystem support of
marine transient species. Pp. 333–365, In M.P. Weinstein and D.A. Kreeger (Eds.).
Concepts and Controversies in Tidal Marsh Ecology. Kluwer Academic, Dordrecht,
The Netherlands. 864 pp.
2013 R. Gorecki and M.B. Davis 189
Duggins, C.F., Jr., A.A. Karlin, K. Relyea, and R.W. Yerger. 1986. Systematics of the Key
Silverside, Menidia conchorum, with comments on other Menidia species (Pisces:
Atherinidae). Tulane Studies in Zoology and Botany 25:133–150.
Echelle, A.A., and A.F. Echelle. 1997. Patterns of abundance and distribution among
members of a unisexual-bisexual complex of fishes (Atherinidae: Menidia). Copeia
1997:249–259.
Florida Department of Environmental Protection-Florida Marine Research Institute
(FDEP-FMRI). 1998. Fisheries-Independent Monitoring Program 1998 annual data
summary report. St. Petersburg, FL. 235 pp.
Florida Fish and Wildlife Conservation Commission-Florida Marine Research Institute
(FWC-FMRI). 2000. Fisheries-Independent Monitoring Program 2000 annual data
summary report. Florida Marine Research Institute. St. Petersbu rg, FL. 293 pp.
Gelwick, F.P., S. Akin, A. Arrington, and K.O. Winemiller. 2001. Fish assemblage structure
in relation to environmental variation in a Texas Gulf coastal wetland. Estuaries
24(2):285–296.
Greenwood, M.F.D., R.E. Matheson, Jr., R.H. McMichael, Jr., and T.C. Macdonald.
2007. Community structure of shoreline nekton in the estuarine portion of the Alafia
River, Florida: Differences along a salinity gradient and inflow-related changes. Estuarine,
Coastal, and Shelf Science 74:223–238.
Idelberger, C.F., and M.F.D. Greenwood. 2005. Seasonal variation in fish assemblages
within the estuarine portions of the Myaka and Peace rivers, southwest Florida. Gulf
of Mexico Science 2:224–240.
Kupschus, S., and D. Tremain. 2001. Associations between fish assemblages and environmental
factors in nearshore habitats of a subtropical estuary. Journal of Fish Biology
58:1383–1403.
Light, H.M., K.R. Vincent, M.R. Darst, and F.D. Price. 2006. Water-level decline in the
Apalachicola River, Florida, from 1954–2004, and effects on floodplain habitats. US
Geological Survey Scientific Investigations Report 2006-5173. Re ston, VA. 83 pp.
Livingston, R.J. 1983. Resource atlas of the Apalachicola Estuary. Florida Sea Grant
College Program. Report 55.Gainesville, FL 64 pp.
Livingston, R.J. 1997. Trophic response of estuarine fishes to long-term changes in river
runoff. Bulletin of Marine Science 60(3):984–1004.
Livingston, R.J., P.S. Sheridan, B.G. McLane, F.G. Lewis III, and G.G. Kobylinski. 1977.
The biota of the Apalachicola Bay system: Functional relationships. Florida Marine
Research Publications 26:75–100.
Livingston, R.J., X. Niu, F.G. Lewis III, and C.G. Woodsum. 1997. Freshwater input to
a Gulf estuary: Long-term control of trophic organization. Ecological Applications
7(1):277–299.
Matheson, R.E., Jr., and J.D. McEachran. 1984. Taxonomic studies of the Eucinostomus
argenteus complex (Pisces: Gerreidae): Preliminary studies of external morphology.
Copeia 1984:893–902.
Richter, B.D., R. Mathews, D.L. Harrison, and R. Wigington. 2003. Ecologically sustainable
water management: Managing river flows for ecological integrity. Ecological
Applications 13(1):206–224.
Subrahmanyam, C.B., and C.L. Coultas 1980. Studies on the animal communities in two
North Florida salt marshes. Part III. Seasonal fluctuations of fish and macroinvertebrates.
Bulletin of Marine Science 30(4):790–818.
190 Southeastern Naturalist Vol. 12, No. 1
Tremain, D.M., and D.H. Adams. 1995. Seasonal variations in species diversity, abundance,
and composition of fish communities in the northern Indian River Lagoon,
Florida. Bulletin of Marine Science 57(1):171–192.
Tsou, T-S., and R.E. Matheson, Jr. 2002. Seasonal changes in the nekton community
of the Suwannee River estuary and the potential impacts of freshwater withdrawal.
Estuaries 25:1372–1381.
2013 R. Gorecki and M.B. Davis 191
Appendix 1. Listing of taxa collected in the lower Apalachicola River, Florida in July 2006 – March 2009 by region (MLD = Marshgrass-dominated Lower
Distributary, FUD = Forested Upper Distributary, URC = Upper River Channel, X = presence) with catch totals by season (dry season = May–December,
wet season = January–April) and gear.
Region Dry season Wet season
Taxon Common name MLD FUD URC Seine Trawl Seine Trawl Total
Stomolophidae
Stomolophus meleagris Agassiz Cannonball Jelly X 0 1 0 0 1
Palaemonidae
Macrobrachium ohione Smith Ohio Shrimp X X X 0 1 0 7 8
Penaeidae
Farfantepenaeus aztecus Ives Brown Shrimp X X 2 33 0 0 35
Farfantepenaeus duararum Burkenroad Pink Shrimp X 0 7 0 0 7
Farfantepenaeus spp. Penaeid Shrimp X X 531 1373 0 14 1918
Litopenaeus setiferus L. White Shrimp X X 904 14,863 0 2 15,769
Rimapenaeus constrictus Stimpson Roughneck Shrimp X X 1 250 0 0 251
Xiphopenaeus kroyeri Heller Atlantic Seabob X 0 5 0 0 5
Portunidae
Callinectes sapidus Rathbun Blue Crab X X X 1965 1303 420 226 3914
Callinectes similis Williams Lesser Blue Crab X 0 2 0 0 2
Achiridae
Trinectes maculatus Bloch & Schneider Hogchoker X X X 11,519 8708 7897 466 28,590
Acipenseridae
Acipenser oxyrinchus desotoi Mitchill Gulf of Mexico Sturgeon X X 0 2 0 0 2
Amiidae
Amia calva L. Bowfin X X 6 1 3 1 11
Aphredoderidae
Aphredoderus sayanus Gilliams Pirate Perch X X 7 0 14 0 21
Ariidae
Ariopsis felis L. Hardhead Sea Catfish X X 1 143 0 4 148
Bagre marinus Mitchill Gafftopsail Sea Catfish X 0 9 0 0 9
Atherinidae
Menidia spp. Silverside X X X 8958 4 755 10 9727
192 Southeastern Naturalist Vol. 12, No. 1
Region Dry season Wet season
Taxon Common name MLD FUD URC Seine Trawl Seine Trawl Total
Atherinopsidae
Labidesthes sicculus Cope Brook Silverside X X X 878 0 119 0 997
Membras martinica Valenciennes Rough Silverside X X 4 0 2 0 6
Batrachoididae
Porichthys plectrodon Jordan & Gilbert Atlantic Midshipman X 0 27 0 0 27
Belonidae
Strongylura marina Walbaum Atlantic Needlefish X X 3 0 0 0 3
Strongylura spp. Needlefish X X X 16 0 0 0 16
Carangidae
Caranx hippos L. Crevalle Jack X X 0 5 0 0 5
Caranx latus Agassiz Horse-eye Jack X 1 0 0 0 1
Chloroscombrus chrysurus L. Atlantic Bumper X 0 4 0 0 4
Oligoplites saurus Bloch & Schneider Leatherjacket X X X 69 0 0 0 69
Selene vomer L. Lookdown X 0 4 0 0 4
Catostomidae
Carpiodes cyprinus Lesueur Quillback X X 0 0 2 6 8
Erimyzon sucetta Lacépède Lake Chubsucker X X 3 0 1 0 4
Minytrema melanops Rafinesque Spotted Sucker X X X 46 0 4 0 50
Moxostoma spp. Redhorse X X 20 1 1 0 22
Centrarchidae
Enneacanthus gloriosus Holbrook Bluespotted Sunfish X X 43 0 4 0 47
Lepomis auritus L. Redbreast Sunfish X X 322 0 100 1 423
Lepomis gulosus Cuvier Warmouth X X X 8 0 2 0 10
Lepomis macrochirus Rafinesque Bluegill X X X 1553 16 655 13 2237
Lepomis microlophus Günther Redear Sunfish X X X 438 27 164 36 665
Lepomis punctatus Valenciennes Spotted Sunfish X X X 163 0 46 1 210
Lepomis spp. Sunfish X X X 229 0 28 0 257
Micropterus salmoides Lacépède Largemouth Bass X X X 1014 19 437 5 1475
Pomoxis nigromaculatus Lesueur Black Crappie X X 2 0 4 0 6
Clupeidae
Alosa alabamae Jordan & Evermann Alabama Shad X 1 2 0 0 3
Alosa chrysochloris Rafinesque Skipjack Shad X 1 0 0 0 1
2013 R. Gorecki and M.B. Davis 193
Region Dry season Wet season
Taxon Common name MLD FUD URC Seine Trawl Seine Trawl Total
Brevoortia spp. Menhaden X X X 766 24 9987 121 10,898
Dorosoma cepedianum Lesusur American Gizzard Shad X X X 10 3 1 0 14
Dorosoma petenense Günther Threadfin Shad X X X 483 147 0 5 635
Harengula jaguana Poey Scaled Herring X 110 0 0 0 110
Cynoglossidae
Symphurus plagiusa L. Blackcheek Tonguefish X X 113 710 0 0 823
Cyprinidae
Cyprinella venusta Girard Blacktail Shiner X X X 5486 29 2016 0 7531
Cyprinus carpio L. Common Carp X X X 2 4 2 2 10
Notemigonus crysoleucas Mitchill Golden Shiner X X X 681 0 16 0 697
Notropis longirostris Hay Longnose Shiner X 1 0 30 0 31
Notropis maculatus Hay Taillight Shiner X X 85 0 30 0 115
Notropis petersoni Fowler Coastal Shiner X X X 2793 27 377 1 3198
Notropis texanus Girard Weed Shiner X X X 2887 1359 170 41 4457
Opsopoeodus emiliae Hay Pugnose Minnow X X 118 2 34 0 154
Cyprinodontidae
Cyprinodon variegatus Lacépède Sheepshead Minnow X 1 0 0 0 1
Dasyatidae
Dasyatis sabina Lesueur Atlantic Stingray X X X 3 27 0 0 30
Elassomatidae
Elassoma okefenokee Bohlke Okefenokee Pygmy Sunfish X 5 0 1 0 6
Elassoma zonatum Jordan Banded Pygmy Sunfish X X 35 0 2 0 37
Eleotridae
Dormitator maculatus Bloch Fat Sleeper X 2 0 0 0 2
Elopidae
Elops saurus L. Ladyfish X 3 0 0 1 4
Engraulidae
Anchoa hepsetus L. Broad-striped Anchovy X X 407 4 0 0 411
Anchoa lyolepis Evermann & Marsh Shortfinger Anchovy X 1 0 0 0 1
Anchoa mitchilli Valenciennes Bay Anchovy X X X 19,533 137,067 416 4353 161,369
Ephippidae
Chaetodipterus faber Broussonet Atlantic Spadefish X 0 5 0 0 5
194 Southeastern Naturalist Vol. 12, No. 1
Region Dry season Wet season
Taxon Common name MLD FUD URC Seine Trawl Seine Trawl Total
Esocidae
Esox niger Lesueur Chain Pickerel X X X 13 0 27 0 40
Fundulidae
Adinia xenica Jordan & Gilbert Diamond Killifish X 67 0 5 0 72
Fundulus chrysotus Günther Golden Topminnow X X 18 0 21 0 39
Fundulus confluentus Goode & Bean Marsh Killifish X X 26 0 19 0 45
Fundulus grandis Baird & Girard Gulf Killifish X 57 0 10 0 67
Lucania goodei Jordan Bluefin Killifish X X X 928 0 1273 0 2201
Lucania parva Baird and Girard Rainwater Killifish X X X 3331 9 828 129 4297
Gerreidae
Eucinostomus gula Quoy & Gaimard Jenny Mojarra X 19 7 0 0 26
Eucinostomus harengulus Goode & Bean Tidewater Mojarra X X X 478 320 0 9 807
Eucinostomus spp. Mojarra X X X 3283 3413 6 32 6734
Gobiidae
Bathygobius soporator Valenciennes Frillfin Goby X 1 0 0 0 1
Tenogobius boleosoma Jordan & Gilbert Darter Goby X X X 1271 192 236 60 1759
Gobionellus oceanicus Pallas Highfin Goby X X 47 16 0 3 66
Gobiosoma bosc Lacépède Naked Goby X X 517 68 127 24 736
Gobiosoma spp. Goby X X 289 45 33 5 372
Microgobius gulosus Girard Clown Goby X X 210 24 11 1 246
Microgobius thalassinus Jordan & Gilbert Green Goby X X 33 905 1 6 945
Haemulidae
Orthopristis chrysoptera L. Pigfish X 22 18 0 0 40
Ictaluridae
Ameiurus catus L. White Catfish X X X 6 10 0 2 18
Ictalurus furcatus Valenciennes Blue Catfish X X X 3 90 2 24 119
Ictalurus punctatus Rafinesque Channel Catfish X X X 0 2787 0 202 2989
Noturus gyrinus Mitchilli Tadpole Madtom X 2 0 0 0 2
Noturus leptacanthus Jordan Speckled Madtom X 0 0 1 0 1
Lepisosteidae
Lepisosteus oculatus Winchell Spotted Gar X X X 34 1 11 0 46
Lepisosteus osseus L. Longnose Gar X X X 10 9 2 5 26
2013 R. Gorecki and M.B. Davis 195
Region Dry season Wet season
Taxon Common name MLD FUD URC Seine Trawl Seine Trawl Total
Lutjanidae
Lutjanus griseus L. Grey Snapper X X X 59 40 0 0 99
Lutjanus synagris L. Lane Snapper X 0 3 0 0 3
Moronidae
Morone saxatilis Walbaum Striped Bass X X 0 0 0 4 4
Mugilidae
Mugil cephalus L. Striped Mullet X X X 1203 0 1928 4 3135
Mugil curema Valenciennes White Mullet X 4 0 0 0 4
Ophichthidae
Myrophis punctatus Lutken Speckled Worm-eel X X 3 1 0 0 4
Paralichthyidae
Citharichthys macrops Dresel Spotted Whiff X 0 1 0 0 1
Citharichthys spilopterus Günther Bay Whiff X X 4 28 0 9 41
Etropus crossotus Jordan & Gilbert Fringed Flounder X 0 17 0 0 17
Paralichthys lethostigma Jordan & Gilbert Southern Flounder X X X 12 28 2 15 57
Percidae
Ammocrypta bifascia Williams Florida Sand Darter X 0 0 0 0 0
Etheostoma edwini Hubbs & Cannon Brown Darter X X 87 0 17 0 104
Etheostoma fusiforme Girard Swamp Darter X X 50 0 2 0 52
Etheostoma swaini Jordan Gulf Darter X 5 1 2 0 8
Percina nigrofasciata Agassiz Blackbanded Darter X X 19 15 2 5 41
Poeciliidae
Gambusia holbrooki Girard Eastern Mosquitofish X X X 677 0 662 1 1340
Heterandria formosa Girard Least Killifish X X 72 0 137 0 209
Poecilia latipinna Lesueur Sailfin Molly X X 83 0 41 0 124
Pomatomidae
Pomatomus saltatrix L. Bluefish X 1 0 0 0 1
Sciaenidae
Bairdiella chrysoura Lacépède Silver Perch X X 584 21 0 8 613
Cynoscion arenarius Ginsburg Sand Weakfish X X X 64 7679 0 134 7877
Cynoscion nebulosus Cuvier Spotted Seatrout X X 76 181 0 4 261
Leiostomus xanthurus Lacépède Spot X X 125 854 253 2219 3451
196 Southeastern Naturalist Vol. 12, No. 1
Region Dry season Wet season
Taxon Common name MLD FUD URC Seine Trawl Seine Trawl Total
Menticirrhus americanus L. Southern Kingfish X X 0 175 0 0 175
Menticirrhus saxatilis Bloch & Schneider Northern Kingfish X 0 1 0 0 1
Micropogonias undulatus L. Atlantic Croaker X X 81 7793 41 6889 14804
Pogonias cromis L. Black Drum X 0 7 0 2 9
Sciaenops ocellatus L. Red Drum X X 11 6 0 10 27
Scombridae
Scomberomorus maculatus Mitchill Spanish Mackerel X 1 16 0 0 17
Sparidae
Archosargus probatocephalus Walbaum Sheepshead X X X 27 83 3 67 180
Lagodon rhomboides L. Pinfish X X 565 164 1069 24 1822
Syngnathidae
Hippocampus erectus Perry Lined Seahorse X 1 1 0 0 2
Syngnathus louisianae Günther Chain Pipefish X X 3 16 0 0 19
Syngnathus scovelli Evermann & Kendall Gulf Pipefish X X 111 16 9 8 144
Synodontidae
Synodus foetens L. Inshore Lizardfish X X 17 67 0 0 84
Tetraodontidae
Sphoeroides nephelus Goode & Bean Southern Puffer X 0 1 0 0 1
Triglidae
Prionotus tribulus Cuvier Bighead Searobin X X 10 100 0 0 110
TOTAL 314,042


 The Southeastern Naturalist is a peer-reviewed journal that covers all aspects of natural history within the southeastern United States. We welcome research articles, summary review papers, and observational notes.