2007 SOUTHEASTERN NATURALIST 6(1):165–172
Status of Populations of the Endangered Gray Bat in the
Western Portion of its Range
D. Blake Sasse1,*, Richard L. Clawson2, Michael J. Harvey3,
and Steve L. Hensley4
Abstract - Forty-eight Myotis grisescens (gray bat) maternity colonies in Missouri,
Arkansas, and Oklahoma were monitored from 1978 to 2002 as recommended in the
US Fish and Wildlife Service recovery plan for this endangered species. Seventynine
percent of colonies were stable or increasing across 3 subpopulations in this
portion of the species’ range, and 9 of 14 (64%) actions required by the recovery plan
in this region were entirely or partially completed. This study indicates that the
dramatic decline in gray bat populations that led to its listing as endangered in 1976
may have halted and that gray bat populations appear to be recovering in the western
portion of its range.
Introduction
The endangered Myotis grisescens Howell (gray bat) inhabits caves in
the southeastern United States, where they concentrate in a small number of
winter hibernacula. In the spring, they disperse to numerous caves, where
they form colonies that are usually sexually segregated. Summer colonies
are often large, consisting of tens of thousands of bats, with some caves
harboring over 100,000 individuals. This tendency to form large aggregations
made the gray bat vulnerable to both intentional and unintentional
human disturbance, and the species suffered precipitous population declines
before its protection under the Endangered Species Act in 1976 (Brady et al.
1982, Tuttle 1979). Factors that exacerbated this decline include impoundment
of waterways, cave commercialization, natural flooding, and pesticides
(Clawson 1991, Tuttle 1979).
After the gray bat was listed as endangered, a recovery plan was developed
by an interagency recovery team of experts (Brady et al. 1982). The
plan includes goals that have to be met to down-list the species from
endangered to threatened status as well as criteria that would have to be met
for full recovery and removal from the list. The recovery plan includes
needed conservation actions, such as purchase or physical protection of
important caves, and assigns priority levels to caves used by gray bats based
on the significance of the cave to the recovery of the species as determined
by the best professional judgment of the recovery team. Down-listing the
1Arkansas Game and Fish Commission, # 2 Natural Resources Drive, Little Rock, AR
72205. 2Missouri Department of Conservation, 1110 South College Avenue, Columbia,
MO 65201. 3Tennessee Technological University, Department of Biology, Box
5063, Cookeville, TN 38505. 4US Fish and Wildlife Service, 222 South Houston, Suite
A, Tulsa, OK 74127. *Corresponding author - dbsasse@agfc.state.ar.us.
166 Southeastern Naturalist Vol. 6, No. 1
gray bat from endangered to threatened status under the Endangered Species
Act requires that 90% of the most important hibernacula be protected
and that populations at 75% of the most important maternity colonies,
designated priority 1, be documented as stable or increasing over a period of
5 years (Brady et al. 1982). This study is the first attempt to determine
trends in gray bat populations in the western portion of their range over a
25-year period and to assess progress in completing gray bat recovery plan
management objectives.
Methods
In the 1960s and 1970s, several studies examined movement patterns of
gray bats in the western portion of their range, comprising Missouri, Arkansas,
Oklahoma, and Kansas (Elder and Gunier 1978, Grigsby 1980, Harvey
et al. 1981, LaVal and LaVal 1980, Myers 1964). Based on recovery locations
of bats banded during these studies, sub-populations were described
consisting of multiple caves containing maternity colonies and their associated
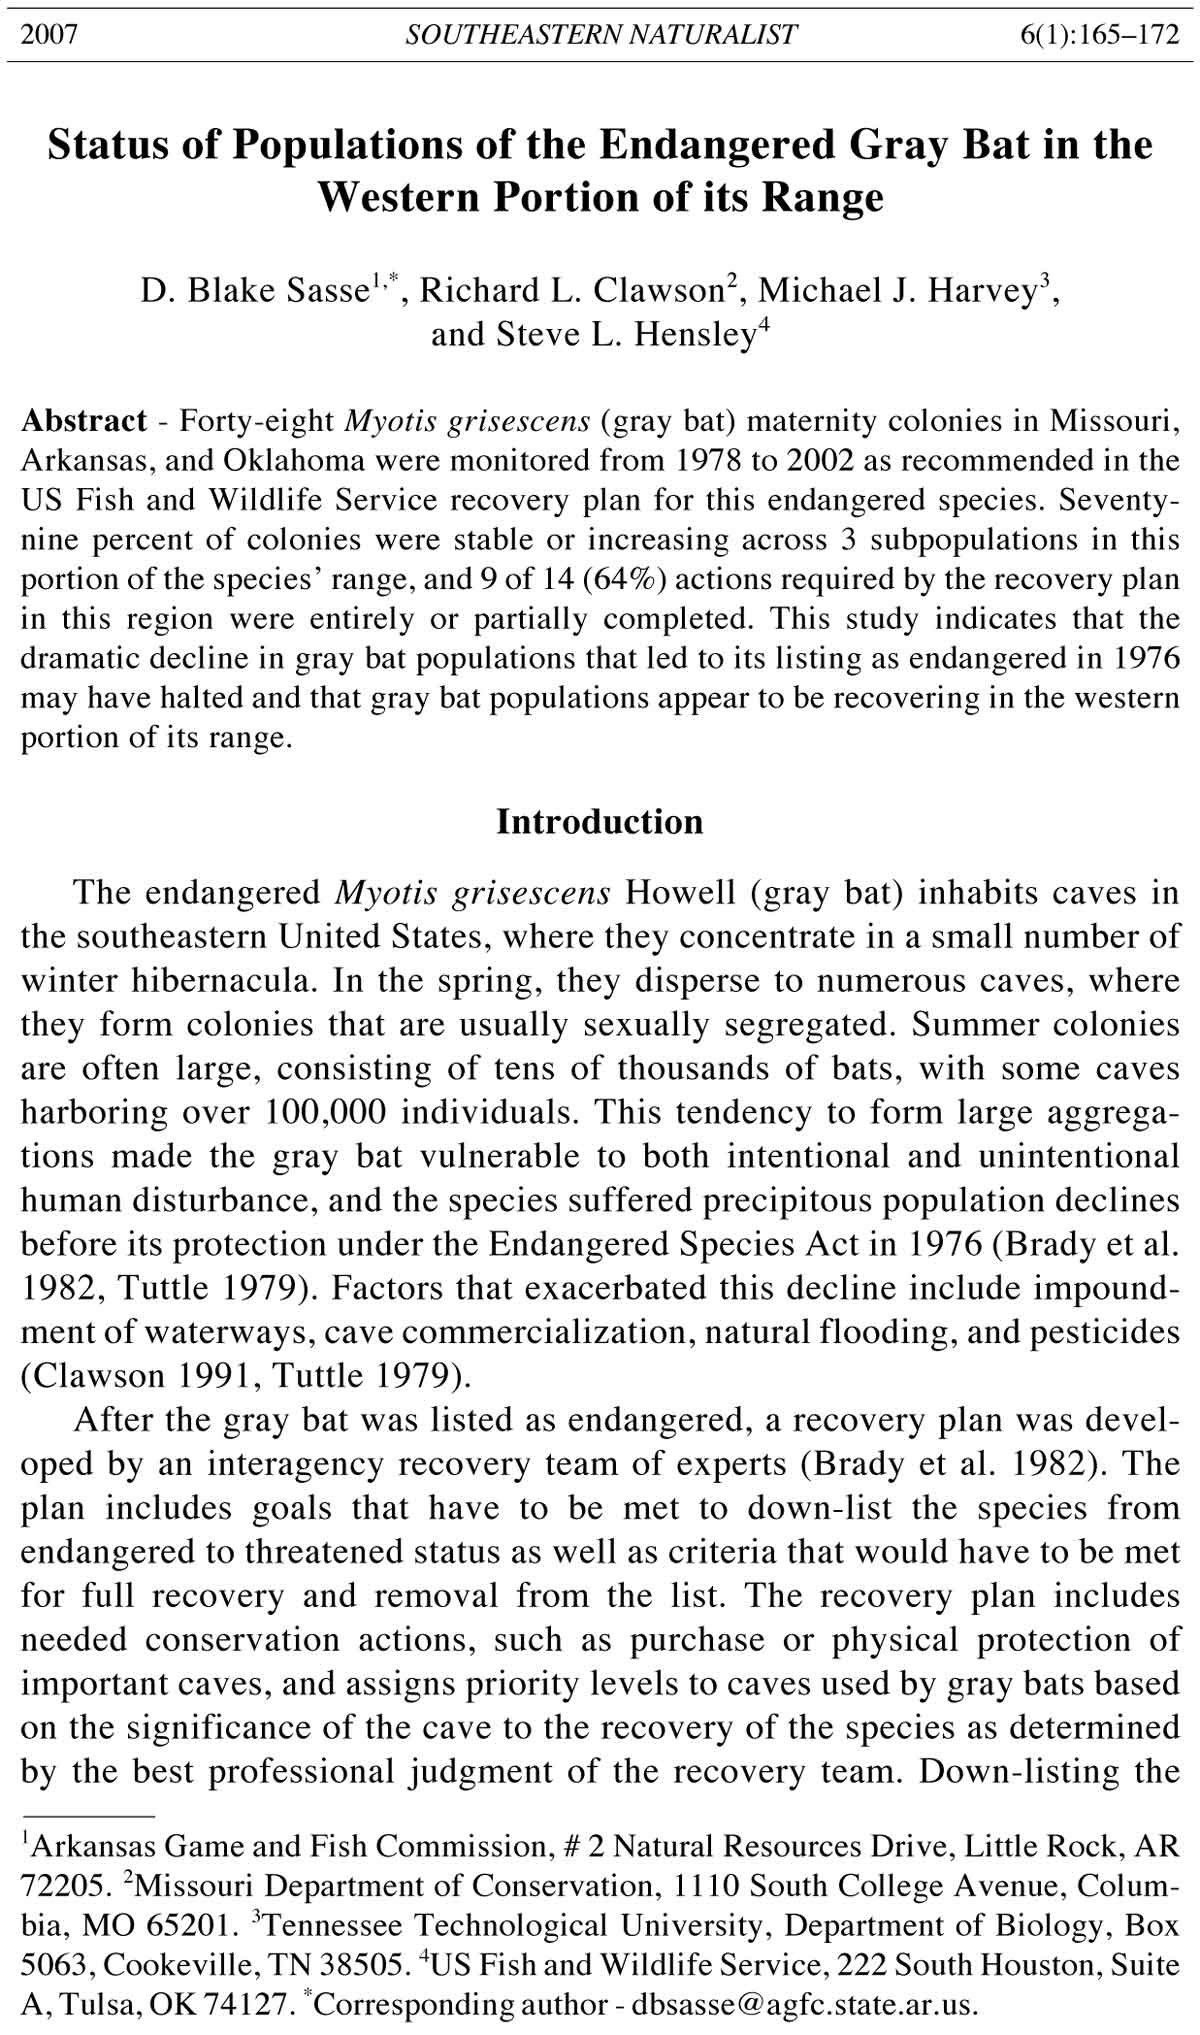
winter hibernacula. A complicated picture of migratory patterns
emerged from these studies that indicated there were 3 subpopulations in
this region that are generally independent of each other, with only occasional
movements of individuals from one subpopulation to another (Fig. 1).
From 1978–2002, we and other cooperators collected population data
from 48 maternity sites, including 6 identified as priority 1 in the gray bat
Figure 1. Sub-populations of Myotis grisescens (gray bat) in the western portion of
its range.
2007 D.B. Sasse, R.L. Clawson, M.J. Harvey, and S.L. Hensley 167
recovery plan. Seven known gray bat maternity sites west of the Mississippi
River were not included in this study. Inadequate sample sizes, lack of
consistency in use of survey techniques at some caves, or lack of quantitative
estimates precluded the use of data from Bat Cave (Miller County, MO),
Beck Cave (Hickory County, MO), Grandpa Chipley Cave (Camden County,
MO), Saltpeter Cave (Stone County, MO), Tumbling Creek Cave (Taney
County, MO), Turner Mill Spring Cave (Oregon County, MO), and
Pittsburg, KS (Robertson 2003). Three of the excluded caves (Beck Cave,
Saltpeter Cave, and Tumbling Creek Cave) were identified as priority-1 sites
in the gray bat recovery plan (Brady et al. 1982).
Population estimates of maternity colonies were made using different
techniques in each state, but have generally remained consistent at each
cave, so estimates at each site among years could be compared. This variation
in survey methodology precludes calculation of the total population in
this region or within subpopulations, but does not affect analysis of population
trends at each site.
Estimates at caves in Oklahoma were obtained by entering caves each
winter and examining guano deposited by maternity colonies the previous
summer. At each guano pile, a measuring tape was used to determine length
of the pile, and the width was measured at 1-m intervals along the axis of the
pile. This information, used to estimate area of the guano pile, was multiplied
by 1828 bats/m2 (average roosting density) to estimate colony size
(Tuttle 1975). In Missouri, population estimates were based on measurement
of the largest fresh guano pile in each maternity cave. The length and
average width of piles were measured and multiplied by 0.8, because piles
are not entirely rectangular in shape, and multiplied by 1828 bats/m2 to
estimate colony size (Tuttle 1975). In Arkansas, several methods were used,
depending on suitability at each site. At some maternity caves, visual counts
were made of bats exiting maternity caves at dusk, while at others, estimates
of the ceiling area covered by the colonies were made during the day and
multiplied by 1828 bats/m2 to estimate population size (Tuttle 1975).
Population estimates for all sites were tested to determine trends with the
Mann-Kendall test (Hollander and Wolfe 1973, Thompson et al. 1998). This
non-parametric statistical method is based upon annual positive or negative
changes in population and is useful when assumptions required for analysis
using regression techniques cannot be met. The Mann-Kendall test is appropriate
for use in analyzing population trends in cave dwelling bats since
survey techniques vary considerably in accuracy. However, this test can
only determine if the population is generally increasing or decreasing and
does not take into account the magnitude of change (Thompson et al. 1998).
Results
From 1978–2002, populations of gray bats at 21 of 48 (44%) maternity
caves showed a significantly increasing trend, 17 (35%) had no discernable
trend (were considered stable), and 10 (21%) were decreasing (Table 1). In the
168 Southeastern Naturalist Vol. 6, No. 1
northern subpopulation, 87% of maternity colonies had either stable or increasing
populations, while in the eastern subpopulation, 80% of maternity
colonies demonstrated the same pattern. In the southern region, which contained
the largest number of maternity colonies, populations were either stable
Table 1. Population trends of gray bats at maternity caves in the western portion of their range
from 1978–2002.
Number of Probability PopulationA
Cave name Data range surveys Trend valueB
Eastern subpopulation (Missouri)
Bat (Oregon County) 1978–2001 8 Increasing 0.002 9800
Bat (Dent County) C 1981–2002 10 Increasing < 0.001 40,800
Bat #2 1978–2001 10 Increasing < 0.001 46,250
Bat #3 1979–2001 10 Increasing < 0.001 17,150
Coalbank 1978–2001 8 Increasing < 0.031 8200
Cooks 1978–2000 7 No Trend 0.068–0.119 11,500
Dead Man 1981–2001 6 No Trend 0.360–0.500 8150
Roaring SpringsC 1981–2001 8 Decreasing 0.016 0
Saloon 1978–2002 8 Increasing 0.001 9250
Thrasher’s Ford 1981–2001 7 Decreasing 0.001–0.005 6550
Northern subpopulation (Missouri)
Adkins 1978–2002 10 Increasing 0.001–0.002 26,925
Bat (Texas County) 1981–1999 6 Decreasing < 0.001 0
Blackwell 1978–2001 10 Increasing < 0.001 9000
Brown #1 1981–2001 9 No Trend 0.238 39,200
Devil’s Icebox 1987–2002 8 Increasing < 0.001 10,900
Estes 1978–2002 7 No Trend 0.191–0.281 1825
Great Spirit/IncaC 1978–2002 13 Decreasing 0.021 10,900
Holton 1978–2002 7 No Trend 0.068–0.119 2600
Lower Burnt Mill 1978–2002 6 No Trend 0.235–0.360 6525
Mary Lawson 1978–2001 12 Increasing < 0.001 34,300
Mauss-MolesC 1978–2001 10 Increasing < 0.001 76,700
Piquet 1978–1989 4 Increasing < 0.042 18,500
River 1981–2001 8 Increasing < 0.054 9800
Rocheport 1988–2001 6 Increasing < 0.001 32,650
Smittle 1981–1999 8 No Trend 0.360 33,650
Southern subpopulation
Oklahoma
Adair 1981–2001 10 No Trend 0.054–0.078 6964
Anticline 1978–2001 10 Decreasing 0.023–0.036 7878
Boy Scout 1982–2001 9 Increasing < 0.001 12,500
Charley Owl 1981–2000 10 No Trend 0.108–0.146 12,100
Dressler 1981–2001 9 No Trend 0.238 4500
Spavinaw Creek 1978–2002 12 Increasing < 0.001 32,355
Twin 1981–2001 12 Increasing 0.002 22,500
Missouri
Bat (Ozark County) 1978–1994 7 No Trend 0.386–0.500 27,200
Blacksmith 1981–1997 6 Increasing 0.001–0.008 8200
Coolbrook 1978–1994 6 No Trend 0.235–0.360 5350
Maze 1978–1994 4 No Trend 0.167 8150
No Name 1980–1997 8 No Trend 0.089 1700
Rantz 1978–1994 5 No Trend 0.592 14,275
Stillhouse 1981–1997 5 Increasing < 0.008 10,200
2007 D.B. Sasse, R.L. Clawson, M.J. Harvey, and S.L. Hensley 169
or increasing at 18 of 23 (78%) sites. Adequate information was available to
analyze population trends at 6 of 9 (66%) maternity colonies identified as
priority-1 sites in the gray bat recovery plan, and of these, 4 (66%) had
increasing and 2 (33%) had decreasing population trends (Table 1).
There were 14 recovery actions listed in the gray bat recovery plan that
relate to the western portion of the range and of these, 6 (43%) were complete,
3 (21%) were partially achieved, and 5 (36%) had not yet been performed
Table 1, continued.
Number of Probability PopulationA
Cave name Data range surveys Trend valueB
Arkansas
Big Creek 1980–2002 23 Decreasing < 0.025 3068
BoneC 1979–2002 24 Increasing 0.015 136,000
Cave River 1979–2002 20 Decreasing < 0.001 50
Cave Springs 1979–2002 23 Decreasing < 0.001 2030
Horsethief 1986–2002 12 Increasing < 0.001 6800
LoganC 1979–2002 24 No trend 0.054 18,370
Newark Storm Drain 1988–2002 15 No trend 0.190–0.218 3172
Old Joe 1978–2002 25 Decreasing 0.002 6120
Summer 1982–2002 21 Decreasing 0.028 4080
AMost recent population estimate within this study period.
BMann–Kendall test.
CPriority-1 sites in the gray bat recovery plan.
Table 2. Priority actions necessary to prevent extinction of Myotis grisescens (gray bat) in the
western portion of its range (Brady et al. 1982).
Action Status
Maternity Caves
Acquire Saltpetre Cave (MO) Remains private
Acquire Maze Cave (MO) Remains private
Acquire Bat Cave (MO) Remains private
Protect Tumbling Creek Cave (MO) Bat-friendly gate installed
Acquire Bone Cave (AR) Remains private, but has been fenced under a
management agreement with between the
owner and the Arkansas Game and Fish
Commission
Protect Beck Cave (MO) Fenced
Protect Roaring Springs Cave (MO) Was leased to Missouri Department of
Conservation but the lease has expired
Acquire Logan Cave (AR) Purchased by US Fish and Wildlife Service
Protect Mauss/Moles Cave (MO) Remains unprotected but is owned by Missouri
Department of Conservation
Acquire Inca (Great Spirit Cave) (MO) Purchased by Missouri Department of
Conservation
Hibernacula
Protect Bonanza Cave (AR) Bat-friendly gate installed by US Forest Service
Acquire Coffin Cave (MO) Purchased by Missouri Department of
Conservation and fenced
Protect Chimney Cave (MO) Closure sign posted at entrance
Protect Marvel Cave (MO) Commercialized and abandoned by bats
170 Southeastern Naturalist Vol. 6, No. 1
(Table 2). Of the actions involving hibernacula, 2 (50%) were complete, 1
(25%) was partially completed, and the other is unlikely to ever be accomplished
due to changes made to the cave during commercial development.
Discussion
The population decline that led to listing of the gray bat as endangered
appears to have been halted and populations may be increasing. This study
found that in the western range 79% of maternity colonies were stable or
increasing, which is supported by several short-term evaluations in the
region (Grigsby et al. 1993, Harvey 1996, Martin et al. 2000). Grigsby et al.
(1993) observed stable or increasing populations at 4 gray bat maternity
caves in Oklahoma between 1981 and 1991. In another Oklahoma study,
populations at 4 gray bat maternity caves had remained the same or increased
between 1981 and 1999 after internal cave gates were installed
(Martin et al. 2000). Populations of gray bats in two protected Arkansas
hibernacula have steadily increased from < 100 to > 250,000 individuals in
recent years (Harvey 1996; M.J. Harvey, pers. observ.). Unfortunately,
populations from these hibernacula have not been linked to specific summer
colonies. Harvey (1996) estimated that 220,000 gray bats were found in 19
maternity and bachelor caves in Arkansas and that the population was
relatively stable or increasing in the state.
Colony-size estimates and trends in eastern populations of the gray bat
have not been fully assessed, though studies in several states also show
increasing population trends. In Kentucky, summer maternity populations
increased slightly from 1989 to 2001, while 2 summer colonies in Alabama
doubled in size from the 1980s to the early 1990s (Thomas and Best 2000,
Wethington 2001). Ellison et al. (2003) attempted a species-wide assessment
of trends in gray bat summer cave populations and found that of 76 maternity
colonies, 3 (4%) were increasing, 66 (87%) had no detectable trends, and 7
(9%) had decreasing trends.
However, despite these increases, this study, and that of Ellison et al.
(2003), revealed several weaknesses in criteria for down-listing in the 1982
recovery plan that need to be addressed prior to any decision to change the
status of this species from endangered to threatened. Given the large number
of maternity sites used by gray bats, it is unlikely that all sites can be
surveyed often enough in any given 5-year period to show a stable or
increasing population trend as required for down-listing to threatened status.
Over the 25 years of this study, 35 of 48 (73%) caves were surveyed 4–
10 times, with an average time between population counts of 3–6 years.
The database used by Ellison et al. (2003) was incomplete and suffered
from lower sample sizes for many of the same colonies included in this
study. In situations where it is possible to survey a colony on an annual
basis, a 5-year period may still not allow adequate time to examine trends,
due to impreciseness inherent in methods used to survey bat colonies of
this size (Tuttle 2003).
2007 D.B. Sasse, R.L. Clawson, M.J. Harvey, and S.L. Hensley 171
Recovery plan priority levels for hibernacula and maternity caves were
assigned based on the “biological significance, location, vulnerability, and
consensus of opinion of a variety of respondents to the cave survey”
(Brady et al. 1982). These indefinite criteria make it difficult to determine
how conservation efforts should be directed towards sites discovered since
publication of the recovery plan or towards sites whose population has
significantly changed over time (Harvey 1996). Specific priority-level criteria
should be incorporated in future plan revisions, or a process should be
developed for reassessment of priority levels on a regular basis to address
these concerns. With completion of most recovery tasks in the western
range, this portion of the recovery plan should be significantly updated to
reflect actions that remain unfinished.
When the recovery plan is revised, analyses should be performed with
modern statistical techniques to determine appropriate survey frequencies
and time intervals that support population-trend analysis. These analyses
should take into account difficulties in determining population size and
trends in cave dwelling bat species (McCracken 2003, Tuttle 2003). The
recovery plan should also focus on identifying gray bat subpopulations and
encourage coordination and synchrony of surveys of subpopulations in multiple
states, allowing interim assessments of the status of subpopulations.
The lack of such coordination in the past makes it impossible to utilize
existing monitoring data to develop population estimates for this region over
the study period.
Acknowledgments
We thank the many bat researchers who provided data and conducted or participated
in surveys over the years including Jerry Choate, Ron Redman, Bill Puckette,
Keith Martin, and Joyce Barker. Portions of this study were financed by the US Fish
and Wildlife Service through the Section 6 Endangered Species Recovery Program,
the Arkansas Game and Fish Commission, the US Forest Service, and the National
Park Service.
Literature Cited
Brady, J., T. Kunz, M.D. Tuttle, and D. Wilson. 1982. Gray bat recovery plan. US
Fish and Wildlife Service, Denver, CO. 28 pp.
Clawson, R.L. 1991. Pesticide contamination of endangered gray bats and their prey
in Boone, Franklin, and Camden counties, Missouri. Transactions of the Missouri
Academy of Science 25:13–19.
Elder, W.H., and W.J. Gunier. 1978. Sex ratios and seasonal movements of gray bats
(Myotis grisescens) in southwestern Missouri and adjacent states. American
Midland Naturalist 99:463–472.
Ellison, L.E., T.J. O’Shea, M.A. Bogan, A.L. Everette, and D.M. Schneider. 2003.
Existing data on colonies of bats in the United States: Summary and analysis of
the US Geological Survey’s Bat Population Database. Pp. 127–237, In T.J.
O’Shea and M.A. Bogan (Eds.). Monitoring Trends in Bat Populations in the
United States and Territories: Problems and Prospects. US Geological Survey,
Biological Resources Discipline, Fort Collins, CO. Information and Technology
Report USGS/BRD/ITR—2003-0003. 274 pp.
172 Southeastern Naturalist Vol. 6, No. 1
Grigsby, E.M. 1980. The gray bat, Myotis grisescens, in the southwest portion of the
Ozark plateau: Movement patterns, maternity colonies, hibernacula, and
philopatry. Ph.D. Dissertation. University of Oklahoma, Norman, OK. 96 pp.
Grigsby, E.M., W.L. Puckette, and K.W. Martin. 1993. Comparative numbers of
gray bats (Myotis grisescens) at four maternity caves in northeastern Oklahoma
in 1981 and 1991. Proceedings of the Oklahoma Academy of Science 73:35–37.
Harvey, M.J. 1996. Status and management of endangered bats in Arkansas. Proceedings
of the Annual Conference of the Southeastern Association of Fish and
Wildlife Agencies 50:246–253.
Harvey, M.J., J.J. Cassidy, and G.G. O’Hagan. 1981. Endangered bats of Arkansas:
Distribution, status, ecology, and management. Report to the Arkansas Game and
Fish Commission, US Forest Service and the National Park Service. Memphis
State University, Memphis, TN. 137 pp.
Hollander, M., and D.A. Wolfe. 1973. Nonparametric Statistical Methods. Wiley,
New York, NY. 503 pp.
LaVal, R.K., and M.L. LaVal. 1980. Ecological studies and management of Missouri
bats, with emphasis on cave-dwelling species. Terrestrial Series #8, Missouri
Department of Conservation, Jefferson City, MO. 53 pp.
Martin, K.W., W.L. Puckette, S.L. Hensley, and D.M. Leslie, Jr. 2000. Internal cave
gating as a means of protecting cave-dwelling bat populations in eastern Oklahoma.
Proceedings of the Oklahoma Academy of Science 80:133–137.
McCracken, G.F. 2003. Estimates of population sizes in summer colonies of Brazilian
free-tailed bats. Pp. 21– 30, In T.J. O’Shea and M.A. Bogan (Eds.). Monitoring
Trends in Bat Populations in the United States and Territories: Problems and
Prospects. US Geological Survey, Biological Resources Discipline, Fort Collins,
CO. Information and Technology Report USGS/BRD/ITR—2003-0003. 274 pp.
Myers, R.F. 1964. Biology of three species of myotine bats in the Ozark plateau.
Ph.D. Dissertation. University of Missouri, Columbia, MO. 210 pp.
Robertson, S.M. 2003. Population dynamics and foraging behavior of gray bats in
Pittsburg, Kansas. M.Sc. Thesis. Southwest Missouri State University, Springfield,
MO. 57 pp.
Thomas, D.P., and T.L. Best. 2000. Radiotelemetric assessment of movement patterns
of the gray bat (Myotis grisescens) at Guntersville Reservoir, Alabama. Pp.
27–39, In B.R. Chapman and J. Laerm (Eds.). Fourth Colloquium on Conservation
of Mammals in the Southeastern United States. Occasional Papers of the
North Carolina Museum of Natural Science and the North Carolina Biological
Survey, No. 12. Raleigh, NC. 92 pp.
Thompson, W.L., G.C. White, and C. Gowan. 1998. Monitoring Vertebrate Populations.
Academic Press, San Diego, CA. 365 pp.
Tuttle, M.D. 1975. Population ecology of the gray bat (Myotis grisescens): Factors
influencing early growth and development. University of Kansas Occasional
Papers of the Museum of Natural History 36:1–24.
Tuttle, M.D. 1979. Status, causes of decline, and management of endangered gray
bats. Journal of Wildlife Management 43:1–17.
Tuttle, M.D. 2003. Estimating population sizes of hibernating bats in caves and
mines. Pp. 31–39, In T.J. O’Shea and M.A. Bogan (Eds.). Monitoring Trends in
Bat Populations in the United States and Territories: Problems and Prospects. US
Geological Survey, Biological Resources Discipline, Fort Collins, CO. Information
and Technology Report USGS/BRD/ITR—2003-0003. 274 pp.
Wethington, T.A. 2001. Status and management of endangered bats in Kentucky.
Proceedings of the Annual Conference of the Southeastern Association of Fish
and Wildlife Agencies 55:389–395.


 The Southeastern Naturalist is a peer-reviewed journal that covers all aspects of natural history within the southeastern United States. We welcome research articles, summary review papers, and observational notes.