A Survey of Algal Epiphytes from Vallisneria americana Michx. (Hydrocharitaceae) in the Lower St. Johns River,
Florida
Angela E. Dunn, Dean R. Dobberfuhl, and Dale A. Casamatta
Southeastern Naturalist, Volume 7, Number 2 (2008): 229–244
Full-text pdf (Accessible only to subscribers.To subscribe click here.)
2008 SOUTHEASTERN NATURALIST 7(2):229–244
A Survey of Algal Epiphytes from Vallisneria americana
Michx. (Hydrocharitaceae) in the Lower St. Johns River,
Florida
Angela E. Dunn1, Dean R. Dobberfuhl2, and Dale A. Casamatta1,*
Abstract - Epiphytic algae may be responsible for a significant amount of primary
productivity in aquatic ecosystems, but also reduce available light, compete for nutrients,
and increase drag on their living substrates. A survey of the epiphytic algal
community of the submersed aquatic macrophyte Vallisneria americana Michx.
(Hydrocharitaceae) in the lower St. Johns River, FL was conducted over a 17-month
period. A total of 122 infrageneric taxa were collected at four sites along a 93-km
stretch of the river, yielding 32 diatoms (Bacillariophyta), 42 green algae (Chlorophyta),
45 blue-green algae (Cyanobacteria), 2 euglenoids (Euglenophyta), and
1 dinofl agellate (Pyrrophyta) taxa identified over the study period. However, only
diatoms and cyanobacteria were seen at all sampling dates, and only a Cocconeis sp.
was identified at all sites on all dates. This study provides baseline survey data of the
epiphytic algal community in order to assess future anthropogenic effects.
Introduction
Epiphytic algae are found attached and living on submersed aquatic
vegetation (SAV), which includes marine and freshwater angiosperms and
macroalgae (Cattaneo et al. 1998, Frankovich and Fourqurean 1997, Graham
and Wilcox 2000, Helfferich and McRoy 1980, Zieman and Wetzel 1980).
SAV colonize the soft, sandy sediments of coastal, estuarine, and freshwater
habitats and are key contributors to the primary productivity in these systems.
Further, SAV may act as nurseries, provide food, are important habitat for other
taxa, and alter water quality (Dennison et al. 1993, Verdelhos et al. 2005).
Increased population density in urban areas has recently led to an
increase in anthropogenic eutrophication. Biological organisms, such as
sensitive species of fish and insects have long been used to monitor aquatic
habitats (Dennison et al. 1993, Nijboer et al. 2005), but are problematic in
their mobility and lack of presence year round. However, algae make ideal
monitoring taxa since they are sessile in nature, have short generation times,
and each species has its own set of environmental tolerances and preferences
(Carrick et al. 1988, Cattaneo 1987, Kelly 1998, Lowe and Pan 1996,
Reynolds 1984). Thus, algae may provide a broader picture of the health of
the aquatic environment.
Epiphytes have several impacts on SAV. They block sunlight, leading
to a reduction in photosynthetic capabilities of SAV (Frankovich and
1Department of Biology, University of North Florida, Jacksonville, FL, 32224.
2St. Johns River Management District, Palatka, FL, 32177. *Corresponding author
- dcasamat@unf.edu.
230 Southeastern Naturalist Vol.7, No. 2
Zieman 2005, Lin et al. 1996, Orth and Moore 1983, Sand-Jensen 1977).
Epiphytes also compete with their plant substratum for phosphorous, nitrogen,
and other nutrients from the water (Borchardt 1996, Burkholder and
Wetzel 1989). Epiphytes alter fl ow rates on and around the leaves causing
turbulence and shear stress that can result in the loss of SAV biomass (Doyle
2001, Koch 1994, Riber and Wetzel 1987). The leaves of Vallisneria americana
Michx. (eel-grass) are simple in structure allowing for fl exibility to
compensate for stress on the plant structure due to wave action and water
currents (Doyle 2001, Riber and Wetzel 1987, Steinmetz et al. 2003). Epiphytes
also negatively impact boundary layers, reducing concentrations of
solutes along the macrophyte surface and in turn competing for these lower
levels of nutrients (Borchardt 1996).
Eel-grass is a perennial angiosperm with long, narrow, green to sometimes
reddish, ribbon-like leaves growing from rhizomes. The leaves of
eel-grass develop as clusters at the roots of the plant, growing to several meters
in length and up to 2.5 centimeters wide (Godfrey and Wooten 1979).
In recent years, beds of eel-grass have experienced significant die off in
the lower St. Johns River (Dobberfuhl and Hart 2006, Sagan 2005, Sagan
and Steinmetz 2003), which is problematic given their roles as an important
nursery habitat and a food source for a variety of aquatic herbivores, including
Trichechus manatus latirostris (Harlan) (Florida manatee) (Fry 1984). The
purpose of this study was to monitor the epiphytic algal community on eel-grass
in an effort to quantify and qualify the epiphytic algal community to assist in future
assessments of anthropogenic effects on similar black water systems.
Materials and Methods
Study site
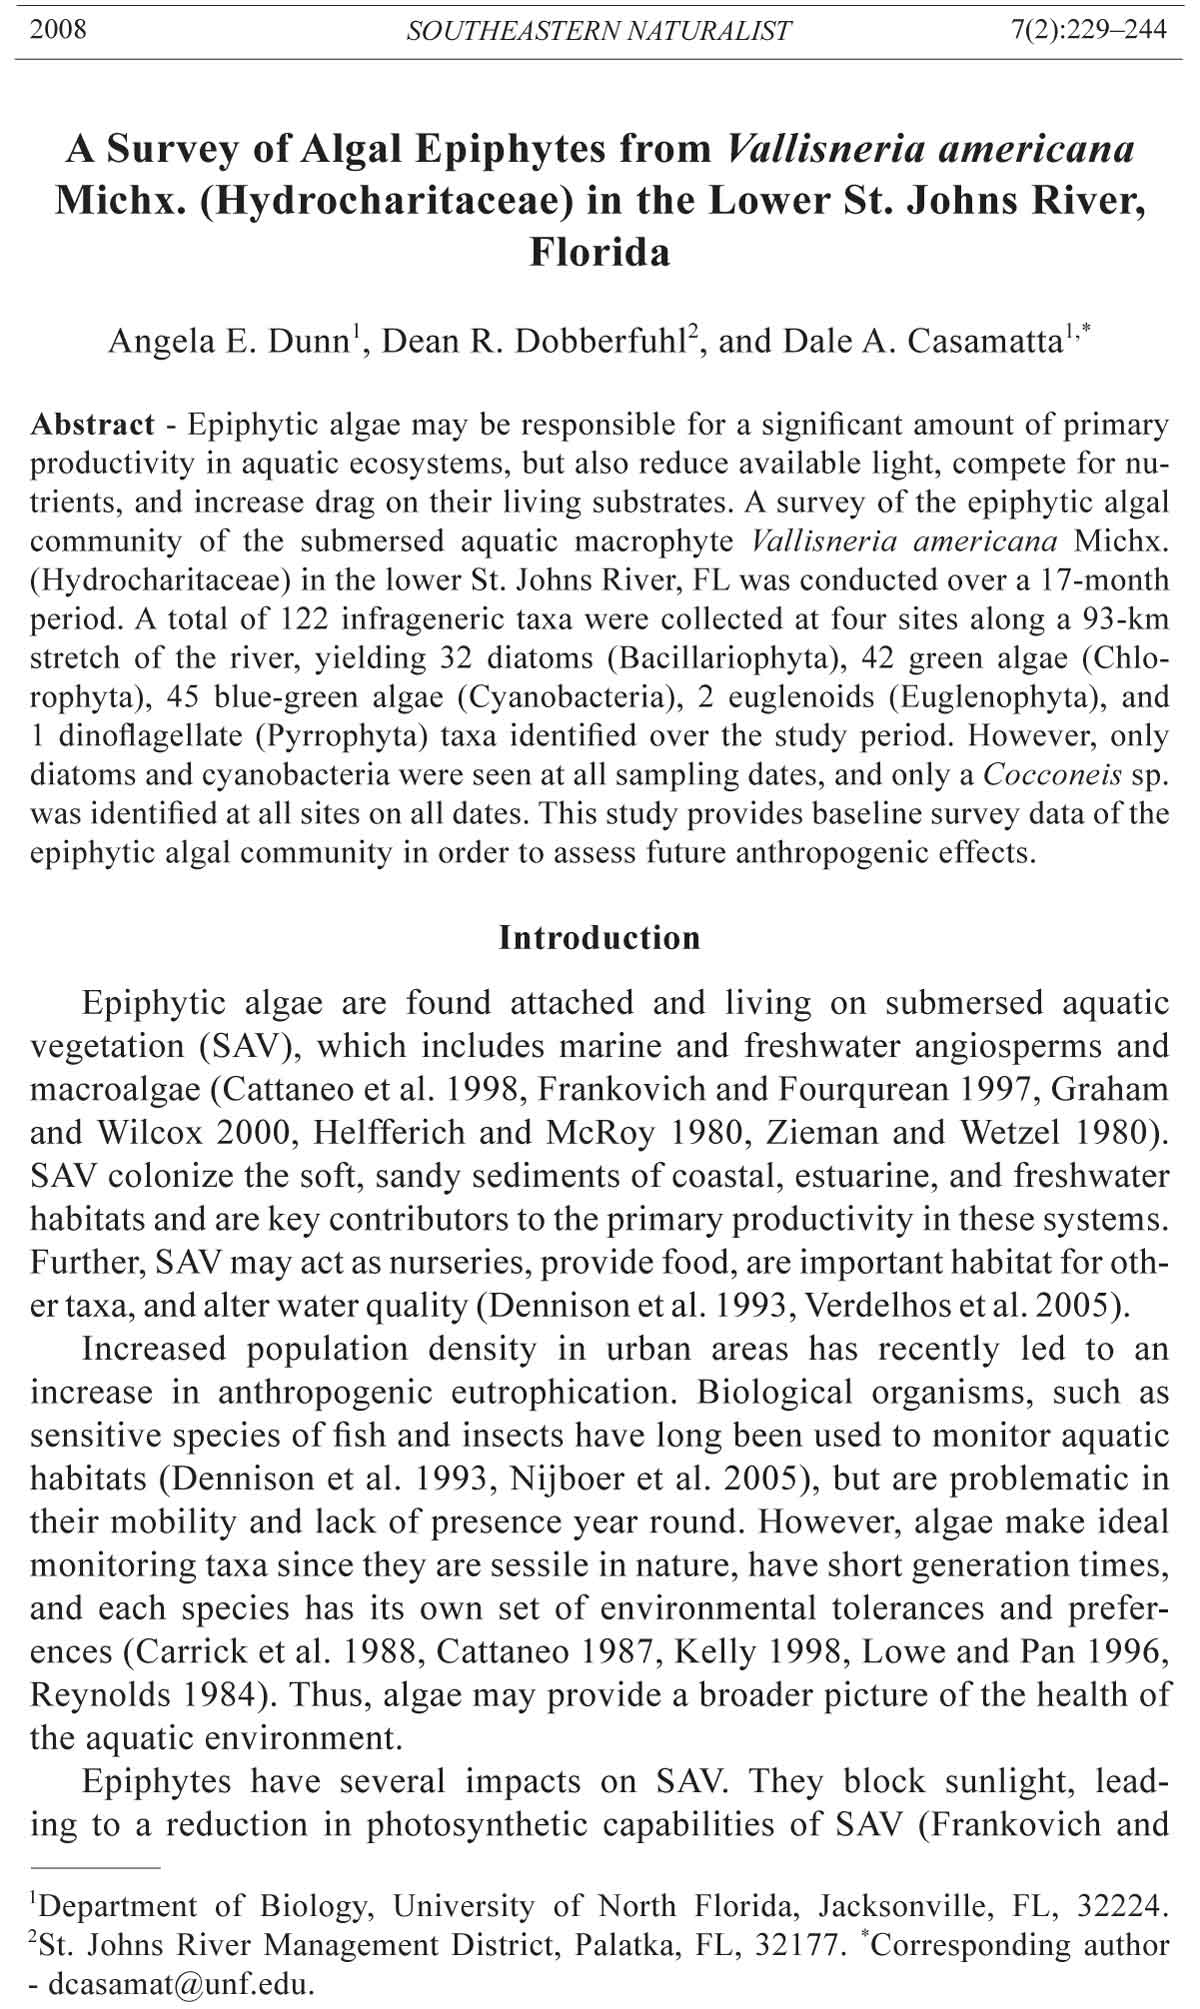
Epiphyte communities were monitored at permanent sampling sites along
a 93-km kilometer segment of the lower St. John’s River (Fig. 1). Initially,
eight sites were employed, but four were subsequently discarded (Doctors
Lake, Rice Creek, Sand Bar, and Brown’s Landing) due to macrophyte die
offs, leaving four sites in total (Bolles School, Buckman Bridge, Moccasin
Slough, and Scratch Ankle). Epiphytes were collected monthly from March
2005–August 2006.
The lower St. Johns River has essentially no vertical gradient and is
therefore strongly infl uenced by tidal effects from the Atlantic Ocean (White
et al. 2003). The Scratch Ankle site is characterized as a freshwater-lacustrine
zone because estuarine characteristics are not normally seen south of
Green Cove Springs, FL. The remaining three sites sampled for the duration
of the study are characterized as oligohaline-lacustrine since the salinity
levels are higher due to tidal effects (White et al. 2003).
Sample collection
Epiphytes were collected randomly in macrophyte beds by cutting
eel-grass leaves (minimum of 5 leaves per site) at the base and placing
2008 A.E. Dunn, D.R. Dobberfuhl , and D.A. Casamatta 231
the leaves in whirlpacks to be transported on ice to the lab. Upon arrival,
epiphytes were removed by scraping each side of the leaf from base to tip
using a glass microscope slide and the resulting sample was divided into
three equal aliquots. All leaves were scraped and measured from base to
tip. Epiphytes from the leaves of each site were pooled to decrease variability
due to plant age and variable distribution along the length of the
blade (Harden 1994). Aliquots were prepared by swirling the solution to
suspend the epiphytes and pipetting equal volumes for ash-free dry mass,
chlorophyll-a, and epiphyte identification.
Figure 1. Map of the lower St. Johns River, FL, depicting sampling sites from
study.
232 Southeastern Naturalist Vol.7, No. 2
Aliquots destined for identification and ash-free dry weight (AFDW)
measurement were preserved in 2.5% glutaraldehyde and refrigerated.
The homogenized suspension for AFDW was pipetted onto precombusted,
preweighed glass fiber filters (Gelman, Type A/E, 47 mm) and vacuum
filtered. Filters were precombusted in a muffle furnace for one hour at
400 °C. Filters were then stored in the drying oven until filtration to
reduce weight gain due to water absorption. Filters containing epiphyton
were dried at 105 °C for at least 24 h, weighed, and recorded as dry
weight (DW). Dried material was combusted at 400 °C for one hour,
and reweighed (ash weight). Epiphyte weight was recorded as ash-free
dry weight (AFDW) and calculated as the difference between DW and
the ash weight (Sagan and Steinmetz 2003).
Epiphytes were identified using standard taxonomic keys to the lowest
possible taxon (e.g., Dillard 1989, 1999, 2000; Komárek and Anagnostidis
1999, 2005; Prescott 1962) using an Olympus BX51 microscope. Width and
length of each leaf were measured (from base to tip) to obtain leaf area (cm2).
Algal quantification and biomass (based on surface area scraped) was estimated
using standard volumes and shapes (Hillebrand et al. 1999, Wetzel and Likens
1991). Epiphyte concentration was reported both as epiphyte biomass per
leaf biomass (g AFDW g DW-1) and epiphyte biomass per leaf area (mg afdw
cm-2). The aliquot for chlorophyll-a quantification was mixed with distilled
water and shaken to suspend epiphytes in the mixture. These samples were immediately
analyzed using a Turner TD-700 fl uorometer (Turner Biosystems,
Sunnyvale, CA) following standard procedures (Wetzel and Likens 1991).
Water-quality measurements, such as dissolved oxygen, conductivity,
and nitrogen and phosphorus levels, were sampled monthly at each SAV
sampling site beginning fall 1997. Water samples were collected at 0.5 m
depth within each grass bed plot. All samples were analyzed within 24 h
of collection. Both the St. Johns River Water Management District laboratory
and contracted laboratories analyzed the samples. All analyses were
performed using US Environmental Protection Agency and Florida Department
of Environmental Protection approved methods (40 CFR 100-149,
APHA 1998).
Species diversity between the sites from pooled samples was calculated
using the Shannon index of diversity (H´) (Shannon and Weaver 1949). Diversity
was determined as follows:
H´ = - Σ Pi ln Pi
where Pi = the proportion of individuals observed in category i to the total
number of individuals in the samples. Percent similarity index (Psc) (Whittaker
and Fairbanks 1958) was used to measure the structural similarity between
the sites by comparing the species number and the relative abundance.
Psc = 100 - 0.5 Σ ⏐ai - bi⏐
where ai and bi are percentages that species i is of the total in samples A and
B, respectively.
2008 A.E. Dunn, D.R. Dobberfuhl , and D.A. Casamatta 233
Results
A total of 122 infrageneric taxa were identified over the course of the
study (Appendix 1). Cocconeis sp. was the only taxon present at all sites on
all dates (Appendix 1). Twenty-eight percent of the taxa identified were common
at all sites during the study and included the diatoms Achnanthidium
spp., Aulacoseira granulata, Cocconeis sp., Cyclotella sp., Cymbella sp., Diatoma
vulgaris, Fragilaria sp., Gomphonema sp., Gyrosigma sp., Navicula
sp., Nitzschia sp., Stephanodiscus hantzschii, Synedra delicatissma, Synedra
spp., the chlorophytes Coleochaete orbicularis, Oedogonium spp., Protoderma
sp., Staurastrum sp., Stigeoclonium sp., Tetraëdon minimum, and the
cyanobacteria Anabaena sp., Aphanocapsa delicatissima, Aphanocapsa sp.,
Aphanothece sp., Chroococcus minutus, C. turgidus, Leptolyngbya spp.,
Lyngbya sp., Merismopedia spp., Oscillatoria sp., Pseudanabaena spp., and
Synechococcus sp.
Diatoms were represented by 32 taxa, or 26% of the total taxa identified.
The ubiquitous, cosmopolitan genera Achnanthidium and Cocconeis
were common throughout all sample sites. Chlorophytes represented 42
(or 34%) of the total taxa, with Oedogonium spp. (species identifications
precluded due to a lack of distinguishing reproductive organs) and
Stigeoclonium sp. identified at all sample sites during the sampling period.
Cyanobacteria represented 45 taxa (or 37%) of the total identified.
A number of filamentous forms were present in most samples, including
the genera Leptolyngbya, Lyngbya, and Pseudanabaena, as well as unicellular
forms such as Synechococcus and Chroococcus. Euglenoids and
dinoflagellates were each represented by only two and one taxa respectively,
and were not included in any of the statistical analyses due to their
rarity (less than 5 occurrences during sample period). Cyanobacteria were
the most diverse taxon collected (Table 1), but total algal biovolume was
dominated by diatoms at the four sites monitored throughout the study
period (Table 2, Fig. 2a–d). The remaining two percent of taxa identified
were euglenoids and dinoflagellates (Appendix 1).
As expected, Scratch Ankle, the site furthest south, had the lowest average
salinity and conductivity values, while Bolles School, the site furthest
north, had the highest values due to tidal infl uence (Table 3). Average pH at
the four sites ranged from a low of 7.83 to a high of 8.08, remaining in the
circumneutral range throughout the study. Water temperature throughout the
study ranged from a low of 11.48 °C to a high of 31.51 °C. The Buckman
Bridge site had the greatest biomass (Fig. 2a) of chlorophytes and cyanobacteria,
and fl oating algal mats were evident at the site throughout the study
period. The Bolles School site had the greatest diatom biovolume (Fig. 2b)
as well as the highest average phosphorus levels (Table 3). Scratch Ankle,
the site with the lowest biovolumes (Fig. 2d) of diatoms, had the highest
average nitrogen value (Table 3).
In January 2006, epiphyte biovolumes dropped dramatically and remained
relatively low compared to the preceding year. This drop in biovolume may
234 Southeastern Naturalist Vol.7, No. 2
Table 1. Species richness and Shannon’s diversity (H') at all sites on which epiphyte samples
were collected. Sampling sites are abbreviated as follows: BB = Buckman Bridge, BS = Bolles
School, MS = Moccasin Slough, SA = Scratch Ankle.
BB BS MS SA
Date R H' R H’ R H' R H'
04/19/05 21 0.846 25 0.811 20 0.841 N/A N/A
05/18/05 22 0.891 17 0.797 15 0.734 10 0.595
06/28/05 26 0.969 8 0.467 20 0.845 9 0.565
07/19/05 22 0.875 8 0.531 11 0.604 19 0.833
08/16/05 23 0.869 12 0.633 24 0.899 22 0.849
09/26/05 20 0.837 N/A N/A 7 0.432 8 0.504
10/20/05 15 0.721 9 0.550 10 0.599 13 0.653
11/18/05 15 0.763 15 0.640 14 0.711 29 0.953
12/28/05 12 0.674 14 0.692 N/A N/A 24 0.898
01/20/05 19 0.804 8 0.504 10 0.599 20 0.751
02/16/06 20 0.789 12 0.675 22 0.900 18 0.830
03/13/06 15 0.763 11 0.609 16 0.711 17 0.769
04/13/06 13 0.774 15 0.698 22 0.863 11 0.592
05/12/06 15 0.696 22 0.706 17 0.724 13 0.677
06/09/06 15 0.696 19 0.795 14 0.679 14 0.539
07/07/06 18 0.692 26 0.863 27 0.931 18 0.555
08/04/06 17 0.712 26 0.848 36 1.001 41 1.075
Mean 18.1 0.790 15.4 0.640 17.8 0.710 17.9 0.680
Std. Dev. 3.9 0.1 6.5 0.2 7.4 0.2 8.4 0.2
Table 2. Average biovolumes (μm 3/cm2) by algal division from all sites for April 2005 through
August 2006.
Division Bolles School Buckman Bridge Moccasin Slough Scratch Ankle
Bacillariophyta 2.16E+06 1.41E+06 1.21E+06 9.81E+05
± 1.99E+06 ± 1.55E+06 ± 1.77E+06 ± 1.48E+06
Chlorophyta 4.81E+05 8.04E+05 3.22E+05 2.44E+05
± 1.43E+06 ± 8.94E+05 ± 5.17E+05 ± 3.71E+05
Cyanobacteria 2.32E+05 7.66E+05 1.53E+05 2.82E+05
± 3.31E+05 ± 1.38E+06 ± 2.35E+05 ± 4.53E+05
Table 3. Physical and chemical parameters (standard deviations are mean ± values) measured
from the four sites selected for the 18 month survey. C = conductivity, N = total Kjeldahl nitrogen,
P = total phosphorus. Data obtained from St. Johns River Water Management District
(www.sjrwmd.org).
Temp N P C Salinity DO
Site (°C) pH (mg/L) (mg/L) (μmhos/cm) (ppt) (mg/L)
Buckman Bridge 23.1 7.83 0.972 0.106 3539 1.97 7.80
± 6.0 ± 0.25 ± 0.222 ± 0.031 ± 5146 ± 2.99 ± 1.66
Bolles School 23.2 7.85 1.073 0.125 4505 2.54 7.88
± 5.9 ± 0.22 ± 0.341 ± 0.036 ± 6113 ± 3.60 ± 1.56
Moccasin Slough 23.4 7.87 0.952 0.091 2899 1.59 8.19
± 6.1 ± 0.24 ± 0.149 ± 0.026 ± 4387 ± 2.52 ± 1.25
Scratch Ankle 23.3 8.08 1.083 0.075 730 0.36 8.27
± 5.4 ± 0.41 ± 0.153 ± 0.017 ± 193 ± 0.10 ± 1.26
2008 A.E. Dunn, D.R. Dobberfuhl , and D.A. Casamatta 235
have been a result of lower levels of available light due to seasonal effects
in combination with an increase in salinity and conductivity values due to
drought conditions. Water quality values for the study period are shown in
Table 3 with mean standard deviations included. Macrophyte blade size also
slightly decreased, though blade size remained relatively constant at the
Bolles School site (Table 4). A difference in macrophyte blade area was most
Figure 2a. Algal biovolumes (μm3/cm2) by algal division from the Buckman Bridge
site for April 2005 through August 2006.
Figure 2b. Algal biovolumes (μm3/cm2) by algal division from the Bolles School site
for April 2005 through August 2006.
236 Southeastern Naturalist Vol.7, No. 2
likely due to sampling efforts. Except for the Bolles School site, the remaining
three sampling sites had large meadows. Sampling was random at each event,
and differences in growth rates of macrophytes in the meadows and herbivory
would have resulted in differences in blade area.
During this monitoring project, the cyanobacterial community showed
the highest mean Psc value at 99.84 (Table 5). The diatoms followed,
Figure 2c. Algal biovolumes (μm3/cm2) by algal division from the Moccasin Slough
site for April 2005 through August 2006.
Figure 2d. Algal biovolumes (μm3/cm2) by algal division from the Scratch Ankle site
for April 2005 through August 2006.
2008 A.E. Dunn, D.R. Dobberfuhl , and D.A. Casamatta 237
with a mean similarity of 99.59, and the chlorophytes showed a mean
similarity of 99.57%. Overall, the four communities sampled were similar
in structure, even withstanding the differences in physical and chemical
parameters (Table 3). The Buckman Bridge and Moccasin Slough sites
showed the greatest similarity in epiphyte communities (98.82%) when
all sample dates were pooled for each sampling location. These two
sites are the most similar in structure of the macrophyte beds as well as
more similar in their chemical features. The Moccasin Slough and Bolles
School sites were the least similar (97.20%) of the four locations monitored
(Table 6), more than likely due to the size of the macrophytes at
Bolles School. The meadows of V. americana at Bolles School were generally
much smaller, and the epiphytic community has thus had less time
to colonize the leaves.
Table 4. Blade area (cm2) of Vallisneria americana (eel-grass) blades sampled at all sites on
which epiphyte samples were collected. Sampling sites are abbreviated as follows: BB = Buckman
Bridge, BS = Bolles School, MS = Moccasin Slough, and SA = Scratch Ankle.
Date BB BS MS SA
04/19/05 206.20 95.44 375.84 N/A
05/18/05 273.62 57.02 324.88 163.74
06/28/05 387.18 37.36 327.70 107.26
07/19/05 399.96 109.48 61.64 42.56
08/16/05 402.40 59.48 177.10 96.72
09/26/05 580.92 N/A 19.58 66.62
10/20/05 635.50 34.38 88.14 163.36
11/18/05 721.16 66.80 339.62 246.74
12/28/05 473.94 25.06 11.82 239.10
01/20/06 789.98 19.70 52.70 163.14
02/16/06 350.00 103.86 470.80 268.76
03/13/06 583.74 69.84 312.58 225.58
04/13/06 352.14 34.80 461.50 50.80
05/12/06 312.48 133.06 281.28 94.42
06/09/06 334.48 72.40 114.50 160.96
07/07/06 333.56 112.40 283.52 188.40
08/04/06 279.64 86.20 169.10 128.34
Table 5. Percentage Similarity (Psc) by algal division between sampling sites. Values were
obtained by pooling samples from each site for all dates. Sampling sites are abbreviated as follows:
BB = Buckman Bridge, BS = Bolles School, MS = Moccasin Slough, and SA = Scratch
Ankle.
Psc by algal group
Site Bacillariophyta Chlorophyta Cyanobacteria
SA:BB 98.16 97.44 98.28
SA:MS 98.62 98.65 98.04
SA:BS 96.22 97.16 97.44
BB:MS 98.66 97.26 98.70
BB:BS 96.87 95.79 97.29
MS:BS 96.89 97.04 97.05
238 Southeastern Naturalist Vol.7, No. 2
Discussion
Little work has been completed on the quantification and identification
of epiphytes relative to SAV in higher order streams and rivers. Our study
focused on the composition of the algal epiphyte community on eel-grass
within a 93-km portion of the lower St. Johns River between Palatka and
Jacksonville, FL (Fig. 1).
Diatoms are characteristically the most prevalent group of algae found in
lotic systems (Kelly 1998), and the epiphytes identified in this study follow
the trend of lotic systems. Diatoms are most likely the largest constituents
of the eukaryotic community in aquatic systems, overall, and are among
the most important photosynthesizers in aquatic environments (Graham and
Wilcox 2000, Kelly 1998, Reynolds 1984). During the 2006 sampling period,
diatoms showed the greatest algal richness, and cyanobacteria trended
toward greater algal richness beginning in winter of 2006.
Though a few of the bacillariophyte and chlorophyte taxa identified are
commonly found in eutrophic conditions, the cyanobacterial community was
representative of ubiquitous taxa (Carrick et al. 1988, Cattaneo 1987, Kelly
1998, Lowe and Pan 1996). Genera such as Leptolyngbya and Aphanocapsa
are indicators of a wide range of trophic conditions and are typical members
of most aquatic habitats. The majority of cyanobacteria identified were filamentous
forms, which can create and increase the coverage of algal mats as
well as increase drag on the macrophyte leaves. The shading and increased
drag on the macrophytes can and has resulted in a loss of SAV biomass
(Doyle 2001, Koch 1994, Riber and Wetzel 1987).
Macrophyte meadows are important habitats and resources for many
taxa, and loss of SAV due to shading and nutrient competition can have far
reaching consequences (Dennison et al. 1993, Verdelhos et al. 2005). The
interaction and dependence of many trophic levels upon the SAV meadows
signifies the importance of studying all aspects of these systems. The
epiphytes at the Buckman Bridge site repeatedly formed mats on the water
surface, further reducing light available to the macrophytes. The macrophytes
sampled at the Moccasin Slough and Scratch Ankle sites consistently
had visible epiphyte coverage, diminishing light available for photosynthesis
for the macrophyte. The macrophytes at Bolles School were small in
nature, and the epiphytic community appeared to be in the beginning stages
of succession as biomass was low.
Table 6. Percentage Similarity (Psc) between sampling sites. Values were obtained by pooling
samples from each site for all dates. Sampling sites are abbreviated as follows: BB = Buckman
Bridge, BS = Bolles School, MS = Moccasin Slough, and SA = Scratch Ankle.
SA BB MS BS
SA 100.00 98.56 98.44 97.20
BB 98.56 100.00 98.82 97.20
MS 98.44 98.82 100.00 96.89
BS 97.20 97.20 96.89 100.00
2008 A.E. Dunn, D.R. Dobberfuhl , and D.A. Casamatta 239
The health of aquatic ecosystems is increasingly being measured using
algal community structure (Kelly 1998, Stevenson 1996). Ecosystem stress
due to anthropogenic effects can be determined by the presence of particular
taxa in the system. Some of the taxa identified at the monitoring sites were
indicative of eutrophic systems, but a majority of taxa were representative of
a cosmopolitan community (Prescott 1962, Wehr and Sheath 2003). Though
epiphytes are major players in primary productivity of SAV beds, formation
of fl oating mats or thick layers of epiphytes on the leaves can limit available
photosynthetically active radiation (PAR) and significantly increase drag on
the plant substrate. In black water systems such as the lower St. Johns River,
this further reduction in PAR will negatively impact meadows of SAV such
as eel-grass. This study shows the continuing need to study algal epiphytes
to aid in the identification of those epiphytic communities that preclude
loss of SAV biomass or promote the dispersal of seeds (Zhongqiang
et al. 2005) of SAV to increase biomass of meadows.
Acknowledgments
The authors are grateful to Christie Crace for sampling assistance and to the St.
Johns Water Management District for funding through the course of the project.
Literature Cited
APHA. 1998. Standard Methods for the Examination of Water and Wastewater, 20th
Edition. American Public Health Association, Washington, DC. 1213 pp.
Borchardt, M.A. 1996. Nutrients. Pp. 183–227, In R.J. Stevenson, M.L. Bothwell,
and R.L. Lowe (Eds.). Algal Ecology. Academic Press, New York, NY. 753 pp.
Burkholder, J.M., and R.G. Wetzel. 1989. Microbial colonization on natural and
artificial macrophytes in a phosphorus-limited, hardwater lake. Journal of Phycology
25:55–65.
Carrick, H.J., R.L. Lowe, and J.T. Rotenberry. 1988. Guilds of benthic algae along
nutrient-rich gradients: Relationships to algal community diversity. Journal of
the North American Benthological Society 7:117–128.
Cattaneo, A. 1987. Periphyton in lakes of different trophy. Canadian Journal of Fisheries
and Aquatic Sciences 44:296–303.
Cattaneo, A., G. Galanti, S.Gentinetta, and S. Romo. 1998. Epiphytic algae and
macro invertebrates on submerged and fl oating-leaved macrophytes in an Italian
lake. Freshwater Biology 39:725–740.
Dennison, W.C., R.J. Orth, K.A. Moore, J.C. Stevenson, V. Carter, S. Kollar, P.W.
Bergstrom, and R.A. Batiuk. 1993. Assessing water quality with submersed
aquatic vegetation. BioScience 43:86–89.
Dillard, G.E. 1989. Freshwater algae of the southeast United States. Part 2, Chlorophyceae.
Bibliotheca Phycologia 83:1–163.
Dillard, G.E. 1999. Common Freshwater Algae of the United States. An Illustrated
Key to the Genera (Excluding Diatoms). Cramer, Berlin, Germany. 173 pp.
Dillard, G.E. 2000. Freshwater algae of the southeast United States. Part 7: Pigmented
Euglenophyceae. Bibliotheca Phycologia 106:1–134.
240 Southeastern Naturalist Vol.7, No. 2
Dobberfuhl, D.R., and C. Hart. 2006. Distribution of submerged aquatic vegetation
in the lower St. Johns River: 2004 atlas. Professional Paper SJ2006-PP3.
Palatka, FL: St. Johns River Water Management District, Palatka, FL.
Doyle, R.D. 2001. Effects of waves on the early growth of Vallisneria americana.
Freshwater Biology 46:289–397.
Frankovich, T.A., and J.W. Fourqurean. 1997. Seagrass epiphyte loads along a
nutrient availability gradient, Florida Bay, USA. Marine Ecology Press Series
159:37–50.
Frankovich, T.A., and J.C. Zieman. 2005. Periphyton light transmission relationships
in Florida Bay and the Florida Keys, USA. Aquatic Botany 83:14–30.
Fry, B. 1984. 13C/12C ratios and the trophic importance of algae in Florida Syringodium
filiforme seagrass meadows. Marine Biology 79:11–19.
Godfrey, R.K., and J.W. Wooten. 1979. Aquatic and Wetland Plants of Southeastern
United States. The University of Georgia Press, Athens, GA. 712 pp.
Graham, L.E., and L.W. Wilcox. 2000. Algae. Prentice Hall, Upper Saddle River,
NJ. 700 pp.
Harden, S. 1994. Light requirements and epiphytic light reductions in three seagrass
species in the Indian River Lagoon, Florida. M.Sc. Thesis. Florida Institute
of Technology, Melbourne, FL. 130 pp.
Helfferich, C., and C.P. McRoy. 1980. Introduction: The spaces in the pattern. Pp.
1–5, In R.C. Phillips and C.P. McRoy (Eds.). Handbook of Seagrass Biology.
Garland STPM Press, New York, NY. 353 pp.
Hillebrand, H., C. Durselen, D. Kirschtel, U. Pollingher, and T. Zohary. 1999.
Biovolume calculation for pelagic and benthic microalgae. Journal of Phycology
35:403–424.
Kelly, M.G. 1998. Use of the trophic diatom index to monitor eutrophication in
rivers. Water Research 32:236–242.
Koch, E.W. 1994. Hydrodynamics, diffusion-boundary layers, and photosynthesis
of the seagrasses Thalassia testudium and Cymodocea nodosa. Marine Biology
118:767–776
Komárek, J., and K. Anagnostidis. 1999. Cyanoprokaryota. 1. Chroococcales.
Gustav Fisher, Jena, Germany. 548 pp.
Komárek, J., and K. Anagnostidis. 2005. Cyanoprokaryota. 2. Oscillatoriales.
Gustav Fisher, Jena, Germany. 759 pp.
Lin, H.J., S.W. Nixon, D.I. Taylor, S.L. Granger, and B.A. Buckley. 1996. Responses
of epiphytes on eelgrass, Zostera marina L., to separate and combined
nitrogen and phosphorus enrichment. Aquatic Botany 52:243–258.
Lowe, R.L., and Y. Pan. 1996. Benthic algal communities as biological monitors.
Pp. 705–739, In R.J. Stevenson, M.L. Bothwell, and R.L. Lowe (Eds.). Algal
Ecology. Academic Press, New York, NY.
Nijboer, R.C., P.F.M. Verdonschot, and D.C. Van Der Werf. 2005. The use of indicator
taxa as representatives of communities in bioassessment. Freshwater
Biology 50:1427–1440.
Orth, R.J., and K.A. Moore. 1983. Chesapeake Bay: An unprecedented decline in
submerged aquatic vegetation. Science 222:51–53.
Prescott, G.W. 1962. Algae of the Western Great Lakes Area. Wm. C. Brown,
Dubuque, IA. 977 pp.
2008 A.E. Dunn, D.R. Dobberfuhl , and D.A. Casamatta 241
Reynolds, C.S. 1984. The Ecology of Freshwater Plankton. Cambridge University
Press, New York, NY. 384 pp.
Riber, H.H., and R.G. Wetzel. 1987. Boundary-layer and internal diffusion effects
on phosphorus fl uxes in lake periphyton. Limnology and Oceanography 32:
1181–1194.
Sagan, J. 2005. A reanalysis of data related to submerged aquatic vegetation within
the lower St. Johns River: 1996–2005. Final report. St. Johns River Water Management
District, Palatka, FL.
Sagan, J., and A. Steinmetz. 2003. Lower St. John’s River Basin (LSJRB) submerged
aquatic vegetation (SAV) monitoring, January 1, 2003–December 31, 2003.
Technical Bulletin. St. Johns River Water Management District, Palatka, FL.
Sand-Jensen, K. 1977. Effect of epiphytes on eelgrass photosynthesis. Aquatic
Botany 3:55–63.
Shannon, C.E., and W. Weaver. 1949. The Mathematical Theory of Communication.
University of Illinois Press, Urbana, IA. 117 pp.
Steinmetz, A.M., M.M. Jeansonne, E.S. Gordon, and J.W. Burns. 2003. An evaluation
of glass prisms in boat docks to reduce shading of submersed aquatic vegetation
in the Lower St. Johns River, Florida. Professional Paper SJ2003-PP2. St.
Johns River Water Management District, Palatka, FL.
Stevenson, R.J. 1996. Diatom indicators of stream and wetland stressors in a
risk-management framework. Environmental Monitoring and Assessment 51:
107–118.
Verdelhos, T., J.M. Neto, J.C. Marques, and M.A. Pardal. 2005. The effect of eutrophication
abatement on the bivalve Scrobicularia plana. Estuarine, Coastal, and
Shelf Science 63:261–268.
Wehr, J.D., and R.G. Sheath. 2003. Freshwater habitats of algae. Pp. 11–57. In J.D.
Wehr and R.G. Sheath (Eds.). Freshwater Algae of North America: Ecology and
Classification. Academic Press, New York, NY. 918 pp.
Wetzel, R.G., and G.E. Likens. 1991. Limnological Analyses. Springer-Verlag, New
York, NY. 391 pp.
White, J.R., A. Ogram, and J. Jaeger. 2003. Characterization of biological and chemical
factors effect in sediment processes of the lower St. Johns River. Report. St.
Johns River Water Management District, Palatka, FL.
Whittaker, R.H., and C.W. Fairbanks. 1958. A study of the plankton copepod communities
in the Columbia Basin, southeastern Washington. Ecology 39:46–65.
Zhongqiang, L., D. Yu, and T. Manghui. 2005. Seed germination of three species of
Vallisneria (Hydrocharitaceae), and the effects of freshwater microalgae. Hydrobiologia
544:11–18.
Zieman, J.C., and R.G. Wetzel. 1980. Productivity in seagrasses: Methods and rates.
Pp. 87–116, In R.C. Phillips and C.P. McRoy (Eds.). Handbook of Seagrass Biology.
Garland STPM Press, New York, NY. 353 pp.
242 Southeastern Naturalist Vol.7, No. 2
Appendix 1. Algal taxa identified from all sites in the lower St. Johns River for the sample dates
of April 2005 through August 2006 for which V. americana (eel-grass) samples were obtained.
Sampling sites are abbreviated as follows: BB = Buckman Bridge, BS = Bolles School, MS =
Moccasin Slough, and SA = Scratch Ankle.
Taxa BB BS MS SA
Bacillariophyta (32 taxa total)
Achnanthidium sp. X X X X
Amphora ovalis (Kützing) VonHeurck X
Aulacoseira granulata (Ehr.) Simons. X X X X
Bacillaria sp. X X
Caloneis limosa (Kütz.) Patr. X
Cocconeis sp. X X X X
Cyclotella sp. X X X X
Cymatopleura solea (Brébisson) W.Smith X
Cymbella sp. X X X X
Diatoma vulgaris Bory X X X X
Diploneis sp. X X X
Encyonema sp. X
Eunotia sp. X X
Fragilaria capucina Desmazières X
Fragilaria construens (Her.) Grun. X X
Fragilaria crotonensis Kitton X X
Fragilaria sp. X X X X
Gomphonema minuta (Agardh) Agardh X
Gomphonema sp. X X X X
Gyrosigma sp. X X X X
Melosira varians C.A. Agardh X
Navicula sp. X X X X
Neidium sp. X X
Nitzschia sp. X X X X
Rhopalodia gibba (Ehrenberg) O. Müller X
Stephanodiscus hantzschii Grunow X X X X
Surirella sp. X X X
Synedra delicatissma. W. Smith X X X X
Synedra sp. X X X X
Synedra ulna (Nitzsch) Ehrenberg X X X X
Tabellaria sp. X X X
Thalassiosira proschkinae Makarova X X
Total number of Bacillariophyta 20 23 23 23
Chlorophyta (42 taxa total)
Ankistrodesmus falcatus (Corda) Ralfs X X X
Bulbochaete sp. X
Characium limneticum Lemmermann X
Cladophora sp. X X
Closterium sp. X
Coelastrum microsporum Naegeli in A. Braun X
Coelastrum reticulatum (Dang.) Senn X
Coleochaete orbicularis Pringsheim X X X X
Cosmarium sp. X X X
Crucigenia quadrata Morren X
Euastrum sp. X
Gonium pectorale Mueller X
Microspora sp. X
Mougeotia spp. X X
Oedogonium sp. X X X X
2008 A.E. Dunn, D.R. Dobberfuhl , and D.A. Casamatta 243
Taxa BB BS MS SA
Oocystis spp. X X X
Pandorina morum (Muell.) Bory X
Pediastrum biradiatum Meyen X
Pediastrum boryanum (Turpin) Meneghini X X
Pediastrum duplex Meyen X X X
Pediastrum simplex Meyen X
Pediastrum tetras (Ehrenberg) Ralfs X
Protoderma sp. X X X X
Quadrigula lacustris (Chod.) G. M. Smith X
Rhizoclonium sp. X X
Scenedesmus abundans (Kirch.) Chodat X
Scenedesmus acuminatus (Lag.) Chodat X
Scenedesmus bijuga (Turp.) Lagerheim X X
Scenedesmus dimorphus (Turp.) Kuetzing X
Scenedesmus quadricauda (Turp.) de Brébisson X X X X
Scenedesmus sp. X X
Schizomeris leibleinii Kuetzing X X
Schizomeris sp. X
Spirogyra spp. X X X
Staurastrum sp. X X X X
Stigeoclonium sp. X X X X
Tetraëdon minimum (A. Braun) Hansgrig X X X X
Tetraëdon sp. X
Tetraëdon trigonum (Naeg.) Hansgirg X
Ulothrix sp. X X
Ulothrix subtilissima Rabenhorst X
Ulothrix tenerrima Kuetzing X
Total number of Chlorophyta 17 17 21 26
Cyanobacteria (45 taxa total)
Anabaena sp. X X X X
Aphanocapsa delicatissima W. et G.S. West X X X X
Aphanocapsa holsatica (Lemmermann) Cronberg et Komárek X
Aphanocapsa sp. X X X X
Aphanothece sp. X X X X
Aphanothece stagnina (Sprengel) A. Braun X
Calothrix epiphytica West & West X X
Calothrix sp. X X X
Calothrix stagnalis Gomont X
Chroococcus limneticus Lemmermann X X X
Chroococcus minutus (Kützing) Nägeli X X X X
Chroococcus sp. X X X
Chroococcus turgidus (Kütz.) Nägeli X X X X
Coelosphaerium kuetzingianum Nägeli X
Cylindrospermum sp. X X
Dactylococcopsis irregularis Grunow X
Gomphosphaeria lacustris Chodat X
Gomphosphaeria sp. X
Homeothrix sp. X
Homeothrix stagnalis (Hansgirg) Komárek et Kováčik X X X
Leptolyngbya boryana Anagnostidis et Komárek X
Leptolyngbya lagerheimii (Gomont) Anagnostidis et Komárek X X
Leptolyngbya sp. X X X X
Leptolyngbya subtilis (W. West) Anagnostidis X X
Leptolyngbya tenuis (Gomont) Anag. et Komárek X X X
Lyngbya birgeii G.M. Smith X X
244 Southeastern Naturalist Vol.7, No. 2
Taxa BB BS MS SA
Lyngbya contorta Lemmermann X
Lyngbya sp. X X X X
Merismopedia elegans A. Braun X X X
Merismopedia spp. X X X X
Merismopedia tenuissima Lemmermann X X
Microcystis aeruginosa (Kützing) Kützing X X X
Oscillatoria anguina (Bory) Goment X
Oscillatoria spp. X X X X
Phormidium sp. X X
Planktolyngbya contorta (Lemmermann) Anagnostidis et Komárek X
Planktolyngbya limnetica (Lemm.) Kom.-Legn et Cronb. X
Pseudanabaena galeata Böcher X X X X
Pseudanabaena limnetica (Lemmermann) Komárek X
Pseudanabaena sp. X X X X
Schizothrix calcicola Gomont X
Stigonema sp. X
Synechococcus sp. X X X X
Tolypothrix sp. X X X
Total number of Cyanobacteria 27 17 28 34
Euglenophyta (2 taxa total)
Euglena acus Ehrenberg X
Trachelomonas spp. X
Total number of Euglenophyta 0 0 1 1
Pyrrhophyta (1 taxa total)
Peridinium sp. X X
Total number of Pyrrhophyta 1 0 1 0
Total number of algal taxa 65 57 74 84


 The Southeastern Naturalist is a peer-reviewed journal that covers all aspects of natural history within the southeastern United States. We welcome research articles, summary review papers, and observational notes.