2008 SOUTHEASTERN NATURALIST 7(3):515–526
Microsite Characteristics of Scutellaria montana
(Lamiaceae) in East Tennessee
John M. Mulhouse1, Matthew J. Gray1,*, and Charles W. Grubb1
Abstract - We surveyed 3 populations of Scutellaria montana (Large-fl owered Skullcap),
a federally threatened mint, in southeastern Tennessee, and measured microsite
characteristics between Large-fl owered Skullcap present and absent plots in close
proximity. Large-fl owered Skullcap plots were typically associated with relatively
open areas in forests. Further, some woody plants were positively associated with
Large-fl owered Skullcap (e.g., Calycanthus fl oridus [Common Sweetshrub], Carya
glabra [Pignut Hickory]), while others were negatively associated (e.g., Vaccinium
stamineum [Gooseberry], Pinus virginiana [Virginia Pine]). Linear regression revealed
that Large-fl owered Skullcap density increased with percent horizontal cover
of grass (i.e., Poaceae) and decreased with percent vertical cover of vegetation. Our
results suggest that suitable Large-fl owered Skullcap sites may be characterized by
secondary forests with an open understory containing grass.
Introduction
Scutellaria montana Chapman (Large-fl owered Skullcap) is a federally
threatened and globally imperiled (G2) perennial herb of the Lamiaceae
family. Extremely restricted in range, Large-fl owered Skullcap has been
recorded only in the forests of the Ridge and Valley and Cumberland Plateau
Provinces of Georgia and Tennessee (USEPA 2002). Prior to our study,
the species had been documented in 8 counties in northern Georgia and 3
in southeastern Tennessee, with populations suspected in northeastern Alabama
(USFWS 1996, USEPA 2002).
It has been suggested that Large-fl owered Skullcap is associated with
mid- to late-successional forests, often positioned along ravines or stream
bottoms (Lipps 1966). The forest composition of Large-fl owered Skullcap
sites has been noted as containing an oak-hickory canopy with some occurrences
of native pine species and an understory of deciduous shrubs and
evergreen Vaccinium spp. (E. Bridges, Tennessee Natural Heritage Program
[TNHP], Nashville, TN, unpubl. data). Sites also may contain a moderately
dense herbaceous layer of mesic and xeric species in the understory (E.
Bridges, unpubl. data). The substrate has been characterized as loose and
well-drained soils, usually shallow, and slightly acidic (USEPA 2002).
Large-fl owered Skullcap may also occur in the presence of exposed bedrock
(E. Bridges, unpubl. data).
Across its range, Large-fl owered Skullcap is found usually at low density,
rarely exceeding more than a few plants per square meter (Cruzan 2001).
1Department of Forestry, Wildlife, and Fisheries, University of Tennessee, 274 Ellington
Plant Sciences Building, Knoxville, TN 37996-4563. *Corresponding author
- mgray11@utk.edu.
516 Southeastern Naturalist Vol.7, No. 3
Although the mechanisms for low density are unknown, low reproductive
capacity has been cited as a contributing factor (Stirling 1983). Inasmuch as
Large-fl owered Skullcap is federally threatened, there is a need to characterize
microsite characteristics associated with its populations (USFWS 1996).
This information is fundamental to understanding its life history and guiding
management and conservation initiatives. Therefore, the objectives of
our study were to: (1) quantify the microsite characteristics associated with
Large-fl owered Skullcap populations, and (2) develop a predictive model for
natural resource managers to assess habitat suitability.
Methods
Our study site was located along the escarpment of the Cumberland
Plateau in southeastern Tennessee (35°21'20.65"N, 85°13'27.62"W), a region
characterized by steep slopes, mountain streams, and rocky outcrops
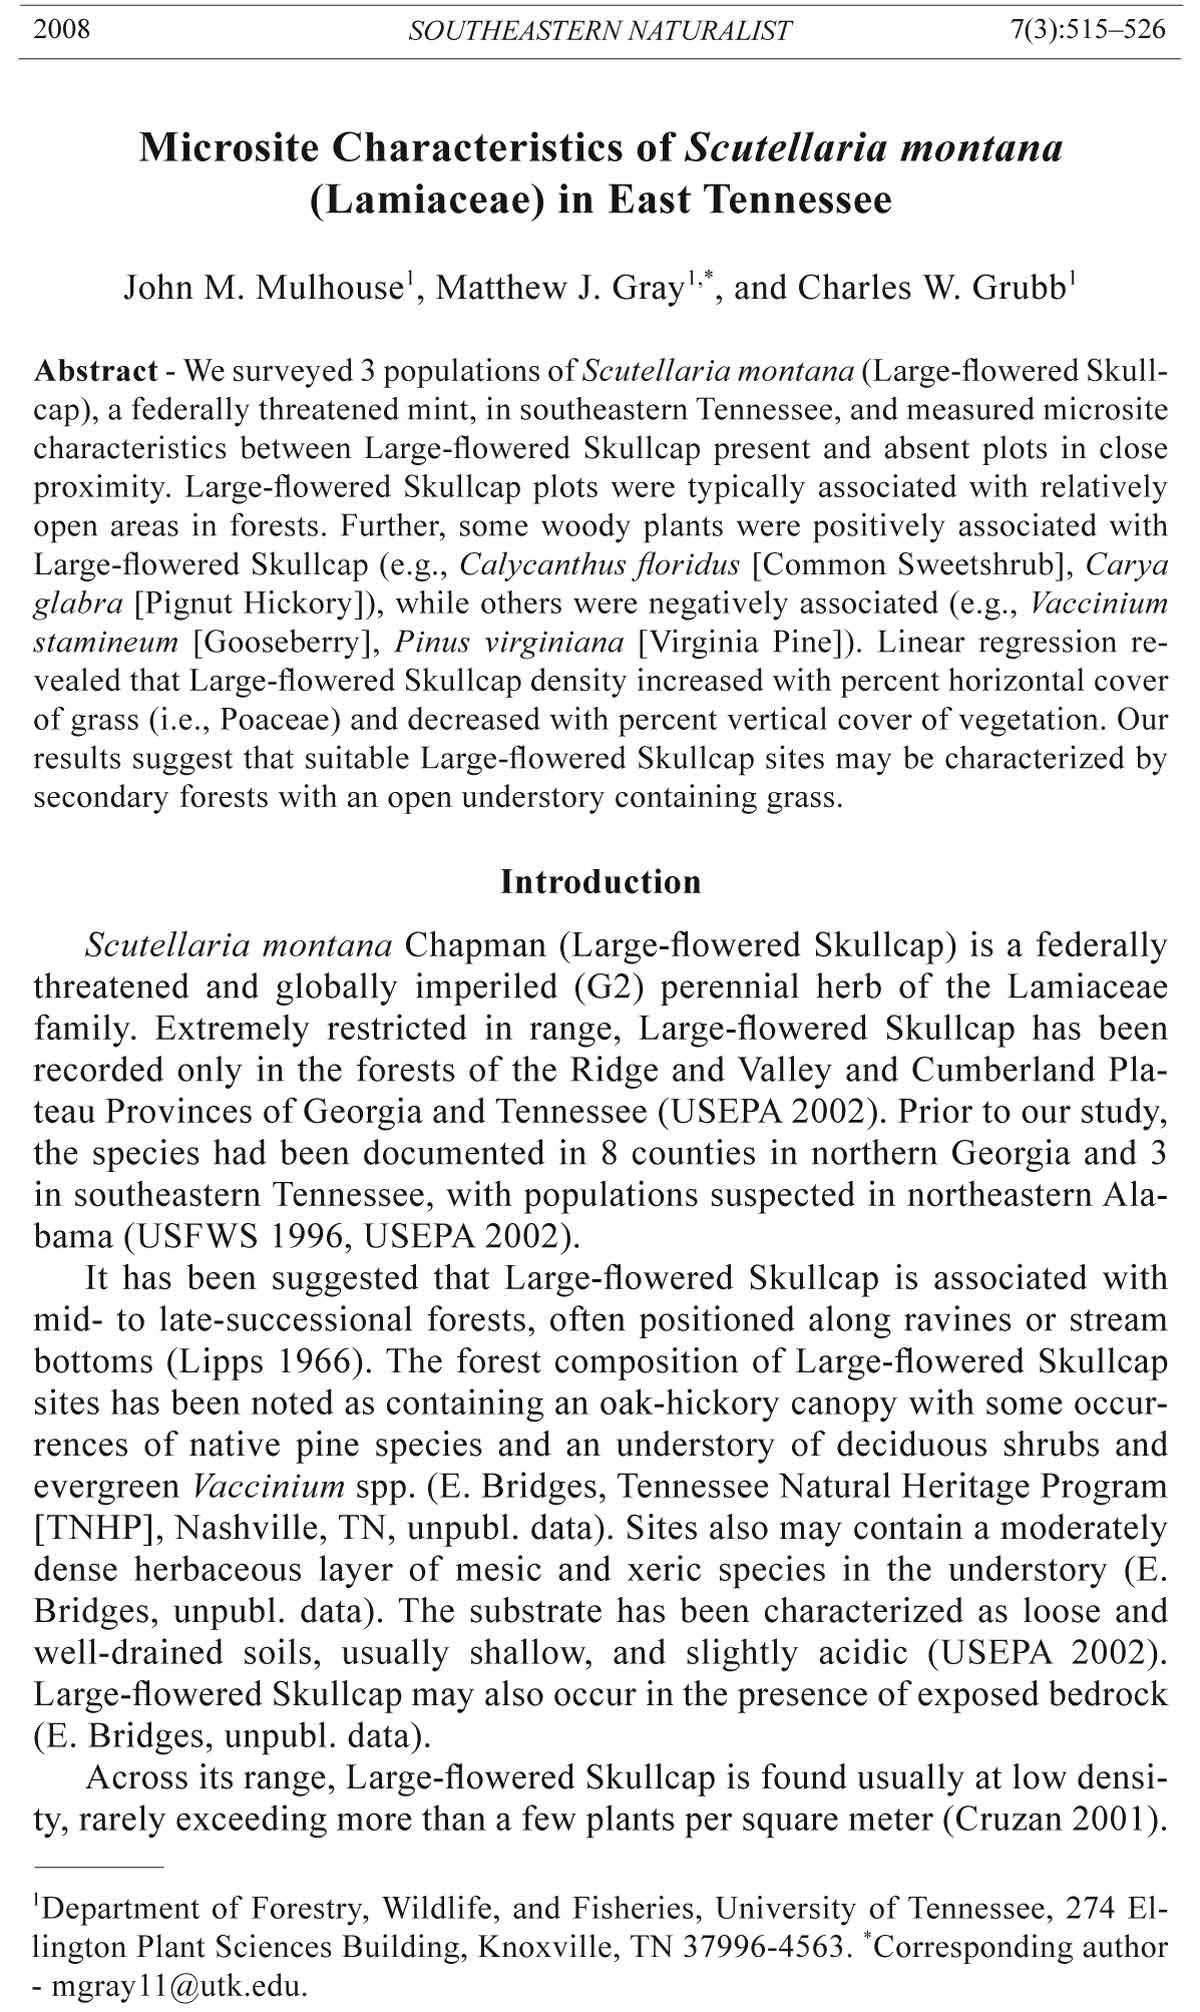
with caves interspersed. We sampled 3 previously unknown populations of
Large-flowered Skullcap: 2 sites in Hamilton County and one in Bledsoe
County, TN (Fig. 1). Forest fragment size at the Hamilton County sites was
29.3 and 69.5 ha (hereafter denoted as HC1 and HC2, respectively). The
Bledsoe County site (BC1) was 242.4 ha. Each site was separated by >4.0
Figure 1. Locations of 3 Scutellaria
montana (Large-fl owered
Skullcap) populations on the
Cumberland Plateau, TN, that
were used in this study.
2008 J.M. Mulhouse, M.J. Gray, and C.W. Grubb 517
km and contained >300 Large-flowered Skullcap plants, which exceeds
the established criteria for distinct and viable populations (i.e., >0.8 km
separation and ≥50 individuals; Shea and Hogan 1998). For identification
of Large-flowered Skullcap, we used Weakley (2006). Also, species confirmation
was made in the field by David Lincicome (Rare Species Protection
Program Administrator for the Tennessee Department of Environment and
Conservation, Nashville, TN).
We located populations and estimated density using belt transect sampling
(Bullock 1996). Across all sites, we systematically placed transects every
91.44 m on north–south azimuths and traversed them from May–August
2006. When one or more Large-fl owered Skullcap plants were found, 400-m2
(20- x 20-m) plots were centered on the transect end-to-end and searched for
the entire transect length. Density was estimated as the number of individuals
per 400-m2 plot.
Microsite characteristics were measured in September 2006 after
transect surveys were completed. To quantify microsite characteristics
for Large-flowered Skullcap, we measured variables known to potentially
influence plant composition and growth. These variables included: basal
area; percent canopy cover; number of canopy gaps, downed logs, and
standing snags; species-specific woody plant density in the overstory,
midstory, and understory; woody plant species richness; percent horizontal
cover of herbaceous and woody plant life forms; percent vertical cover of
vegetation; and soil properties (Higgins et al. 2005). Microsite characteristics
were measured in two paired plots per transect. The first plot (hereafter
called the present plot) was the 400-m2 plot associated with the greatest
Large-flowered Skullcap density along a transect. The second plot (hereafter
called the absent plot) was a randomly selected plot along the same
transect containing no Large-flowered Skullcap plants.
We measured basal area of all woody plants using a 10-basal-area-factor
prism at plot center. Percent canopy cover was measured at plot center and
in the 4 cardinal directions 10 m from plot center using a densiometer. Number
of canopy gaps, downed logs (diameter > 11.43 cm), and standing snags
(diameter-at-breast-height [DBH] > 11.43 cm) also were enumerated in each
plot.
Vertical structure of vegetation was quantified using a profile board.
Our profile board was divided into 4 height strata (1 = 0.00–0.50 m, 2 =
0.51–1.00 m, 3 = 1.01–1.50 m, and 4 = 1.51–2.00 m), and each 0.5-m strata
contained thirty 5- × 5-cm alternately colored boxes. Percent vertical structure
was estimated by counting the number of boxes per strata that were
covered over 50% by vegetation and dividing the number of covered boxes
by 30 per strata. Vertical structure was measured 10 m from plot center in the
4 cardinal directions. Percent horizontal cover of bareground, detritus, forbs
(i.e., non-Poaceae herbaceous vegetation), grasses (i.e., Poaceae), mosses,
rocks, vines, and woody species was ocularly estimated in a 1-m2 plot around
plot center.
518 Southeastern Naturalist Vol.7, No. 3
We measured overstory, midstory, and understory woody plant density
in 3 nested square plots (400-m2, 100-m2, and 40-m2, respectively) around
plot center. An overstory tree was considered to be a woody plant >1.4 m
in height and >11.43 cm DBH. Overstory plants were identified to species
and counted. A woody plant was counted in the midstory if it was >1.4
m height and ≤11.43 cm DBH. Density of midstory woody plants was
enumerated for 4 DBH classes (1 = plants <2.54 cm, 2 = 2.55–5.08 cm, 3
= 5.09–7.62 cm, and 4 = 7.63–11.43 cm). Understory woody plants were
≤1.4 m in height and enumerated for 2 height strata: <10.0 cm and 10.0
cm–1.4 m. All woody plant species were identified using Radford et al.
(1968) and Wofford and Chester (2002), and woody species richness per
plot was enumerated.
Soil chemical composition, percent organic matter, and temperature were
measured 7 m from plot center along each of the 4 cardinal diagonals (i.e.,
NE, SE, SW, and NW). Soil temperature was measured using an Aquaterr®
T-300 meter. Soil cores were collected and analyzed for phosphorus, potassium,
pH, and percent organic matter by the University of Tennessee Agricultural
Extension Service Soil Testing Laboratory (http://bioengr.ag.utk.edu/
SoilTestLab/) using standard techniques.
We provide descriptive statistics (mean, standard deviation, and standard
error) for all statistically significant variables in Large-fl owered Skullcap
present and absent plots. Because it was not reasonable to assume that paired
plots on a transect were independent, we tested for differences (α = 0.05) in
microsite characteristics between present and absent plots using a two-sided
paired t-test. In cases when the distribution of data was non-normal (i.e.,
Shapiro-Wilk W test, P < 0.05), we used a non-parametric 2-sample Wilcoxon
signed-rank test to quantify differences. This test quantifies median
differences; however, we present the aforementioned parametric descriptive
statistics to facilitate interpretation.
We also constructed a linear regression model using stepwise selection
(enter and stay α = 0.05) to identify variables that were important in explaining
Large-fl owered Skullcap density, and to develop a tool to identify
suitable sites for Large-fl owered Skullcap management. The response variable
was density of Large-fl owered Skullcap and explanatory variables were
all microsite characteristics. Number of gaps and soil temperature were not
used due to missing data at some plots. All analyses were performed using
Microsoft® Excel, SPSS (SPSS Inc. 2006), JMP® (SAS Institute 2005), and
the SAS® system (SAS Institute 2003).
Results
Large-fl owered Skullcap was found on 19 transects (7 at HC1, 2 at HC2,
and 10 at BC1). Absolute density ranged from 9–81 plants (mean = 20.9 ±
16.3 [1 SD]) per 400-m2 at Large-fl owered Skullcap present plots. Mean
density of Large-fl owered Skullcap across present and absent plots at HC1,
HC2, and BC1 was 75.4, 73.9, and 51.0 plants/ha, respectively.
2008 J.M. Mulhouse, M.J. Gray, and C.W. Grubb 519
Mean basal area in Large-fl owered Skullcap absent plots (23.2 ± 7.7 m2/ha)
was greater (Z = -2.06, P = 0.04) than in present plots (19.9 ± 6.3 m2/ha). Percent
vertical vegetation cover in absent plots also was greater (t18, 0.05 = -2.06, P =
0.05) than in present plots for the uppermost strata (1.51–2.00 m) on the profile
board (Table 1). No differences were detected for the other 3 profile board strata
(t18, 0.05 ≥ -1.66, P ≥ 0.12), but there was a trend for less vertical cover of vegetation
in Large-fl owered Skullcap present plots (Table 1). Large-fl owered Skullcap
plots had greater percent horizontal cover of grasses (Z = -2.33, P = 0.02)
and vines (Z = -2.04, P = 0.04) in the understory than absent plots (Table 2). No
differences were detected for other horizontal cover categories (Z ≥ -1.76, P ≥
0.08), although on average, over 63% of cover was detritus across all plots (Table
2). No differences also were detected (Z ≥ -1.00, P ≥ 0.32) between present
Table 1. Percent vertical cover1 of vegetation in Scutellaria montana (Large-fl owered Skullcap)
present and absent plots, Hamilton and Bledsoe counties, TN, September 2006.
Absent Present
Strata2 Mean3,4 SD SE Mean SD SE
1 73.6 16.3 3.7 70.5 16.3 3.7
2 57.0 16.3 3.7 47.2 23.8 5.5
3 50.0 19.1 4.4 39.9 23.1 5.3
4 53.5A 26.3 6.0 35.5B 21.8 5.0
Overall 58.5 15.5 3.6 48.3 18.1 4.1
1Vertical cover measured using a profile board at 10 m from plot center; each 0.5-m strata contained
thirty 5 × 5 cm boxes that were considered covered if > 50% of a box was obscured by
vegetation; measurements were taken in each cardinal direction and averaged by strata prior
to analyses.
2Height strata on the profile board were 1 = 0.00–0.50 m, 2 = 0.51–1.00 m, 3 = 1.01–1.50 m,
4 = 1.51–2.00 m, and overall = all strata combined.
3n = 19 present and absent plots.
4Means within rows followed by unlike letters are different (P ≤ 0.05); no letters imply statistical
differences were not detected.
Table 2. Percent horizontal cover1 of vegetation life forms in present and absent Scutellaria montana
(Large-fl owered Skullcap) plots, Hamilton and Bledsoe counties, TN, September 2006.
Absent Present
Life form Mean2,3 SD SE Mean SD SE
Bareground 2.4 6.3 1.4 4.2 12.0 2.8
Detritus 72.2 16.3 3.7 63.9 18.0 4.1
Forb 5.8 7.3 1.7 8.1 7.3 1.7
Grass 0.1A 0.5 0.1 2.1B 4.0 0.9
Moss 0.8 3.4 0.8 0.0 0.0 0.0
Rock 5.5 10.9 2.5 3.4 7.6 1.8
Vine 3.4A 4.9 1.1 6.2B 5.1 1.2
Woody 9.8 10.4 2.4 12.1 7.2 1.6
1Percent horizontal cover was estimated in a 1-m2 plot.
2n = 19 present and absent plots.
3Means within rows followed by unlike letters are different (P ≤ 0.05); no letters imply statistical
differences were not detected.
520 Southeastern Naturalist Vol.7, No. 3
and absent plots for mean number of gaps, logs, and snags (ca. <2 per 400 m2),
and mean percent canopy cover (ca. >90%).
Species richness of understory woody plants in Large-fl owered Skullcap
present plots was greater (t18, 0.05 ≤ -2.09, P ≤ 0.05) than in absent plots for
the tallest understory height stratum and both strata combined (Table 3).
Understory woody plant density also was greater (t18, 0.05 ≤ -2.10, P ≤ 0.05)
in present plots for the tallest understory height stratum and both strata
combined (Table 4). No differences were detected (Z ≥ -1.73, P ≥ 0.08) in
species richness and plant density between Large-fl owered Skullcap present
and absent plots for the lowest understory height stratum, the midstory, and
the overstory (Tables 3 and 4).
Table 3. Species richness of understory, midstory, and overstory vegetation in present and
absent Scutellaria montana (Large-fl owered Skullcap) plots, Hamilton and Bledsoe counties,
TN, September 2006.
Absent Present
Strata1,2 Mean3,4 SD SE Mean SD SE
Understory 1 3.8 2.4 0.5 3.6 2.4 0.6
Understory 2 8.3A 3.8 0.9 10.3B 2.6 0.6
Understory 1 and 2 8.7A 4.0 0.9 11.1B 2.6 0.6
Midstory 6.5 2.6 0.6 6.3 2.9 0.7
Overstory 6.1 2.0 0.4 6.0 1.7 0.4
Overall 15.1 3.5 0.8 16.4 3.9 0.9
1Understory vegetation was woody plants measured in two height strata: 1 = <10 cm and 2 = 10
cm–1.4 m, midstory vegetation was woody plants >1.4 m in height and ≤11.43 cm diameter-atbreast-
height (DBH), and overstory vegetation was woody plants >1.4 m in height and >11.43
cm DBH. Overall richness was total number of unique species across all strata.
2Plot size was 40 m2, 100 m2, and 400 m2 for understory, midstory, and overstory, respectively.
3n = 19 present and absent plots.
4Means within rows followed by unlike letters are different (P ≤ 0.05); no letters imply statistical
differences were not detected.
Table 4. Total understory, midstory, and overstory vegetation density in present and absent
Scutellaria montana (Large-fl owered Skullcap) plots, Hamilton and Bledsoe counties, TN,
September 2006.
Absent Present
Strata1,2 Mean3,4 SD SE Mean SD SE
Understory 1 13.8 14.8 3.4 13.2 12.3 2.8
Understory 2 48.1A 29.3 6.7 62.9B 21.5 4.9
Understory 1 and 2 61.9A 33.3 7.6 76.1B 23.6 5.4
Midstory 26.5 12.7 2.9 25.6 15.4 3.5
Overstory 14.4 7.1 1.6 12.7 5.4 1.2
1Understory vegetation was woody plants measured in two height strata: 1 = <10 cm and 2 = 10
cm–1.4 m, midstory vegetation was woody plants >1.4 m in height and <11.43 cm diameter-atbreast-
height (DBH), and overstory vegetation was woody plants >1.4 m in height and >11.43
cm DBH.
2Plot size was 40 m2, 100 m2, and 400 m2 for understory, midstory, and overstory, respectively.
3n = 19 present and absent plots.
4Means within rows followed by unlike letters are different (P ≤ 0.05); no letters imply statistical
differences were not detected.
2008 J.M. Mulhouse, M.J. Gray, and C.W. Grubb 521
Density of several woody plant species was different between Largefl
owered Skullcap present and absent plots. In the understory, density of
Calycanthus fl oridus L. (Common Sweetshrub) and Vitis vulpina L. (Frost
Grape) was greater (Z ≤ -2.33, P ≤ 0.02) in present plots than in absent plots
(Table 5). In contrast, Vaccinium stamineum L. (Gooseberry) density was
greater (Z = -2.07, P = 0.04) in absent plots than in present plots (Table 5).
Red Maple (Acer rubrum L.) seedlings were relatively dense in the understory
(ca. 10 seedlings/40-m2 plot), although no differences were detected
(Z = -0.28, P = 0.78) between present and absent plots. In the midstory,
density of Tsuga canadensis (L.) Carr. (Eastern Hemlock) was greater (Z =
-2.35, P = 0.02) in Large-fl owered Skullcap absent plots than in present
plots (Table 5). Similar to the understory, Red Maple had a relatively high
density in the midstory (ca. 6 saplings/100-m2 plot), but differences were
not detected (Z = -0.03, P = 0.98) between present and absent plots. In the
overstory, density of Carya glabra (Miller) Sweet (Pignut Hickory) was
greater (Z = -2.56, P = 0.007) in Large-fl owered Skullcap plots than in absent
plots (Table 5). The density of Quercus montana Willd. (Chestnut Oak) and
Pinus virginiana Miller (Virginia Pine) was greater (Z ≤ -2.06, P ≤ 0.04) in
Large-fl owered Skullcap absent plots than in present plots (Table 5). Red
Maple, Quercus alba L. (White Oak), and Oxydendrum arboreum (L.) DC
(Sourwood) had relatively high densities in the overstory (ca. 2 trees/400-m2
plot), but differences were not detected (Z ≥ -1.85, P ≥ 0.07) between Largefl
owered Skullcap present and absent plots. Fifty additional woody plant
species were recorded during sampling, most at relatively low density in the
Table 5. Density of overstory, midstory, and understory woody vegetation that differed statistically
(P < 0.05) between present and absent Scutellaria montana (Large-fl owered Skullcap)
plots, Hamilton and Bledsoe counties, TN, September 2006.
Absent Present
Story1,2/species Mean3,4 SD SE Mean SD SE
Under
Common Sweetshrub 3.2A 5.1 1.2 12.7B 13.3 3.1
Gooseberry 10.7A 19.0 4.4 2.2B 3.9 0.9
Frost Grape 0.2A 0.5 0.1 1.2B 1.5 0.4
Mid
Eastern Hemlock 1.2A 2.3 0.5 0.1B 0.3 0.1
Over
Pignut Hickory 0.7A 1.2 0.3 1.9B 1.4 0.3
Virginia Pine 1.5A 3.1 0.7 0.1B 0.3 0.1
Chestnut Oak 3.4A 4.4 1.0 1.0B 1.3 0.3
1Understory vegetation was woody plants ≤1.4 m in height, midstory vegetation was woody
plants >1.4 m in height and ≤11.43 cm diameter-at-breast-height (DBH), and overstory vegetation
was woody plants >1.4 m in height and >11.43 cm DBH.
2Plot size was 40 m2, 100 m2, and 400 m2 for understory, midstory, and overstory, respectively.
3n = 19 present and absent plots.
4Means within rows followed by unlike letters are different (P ≤ 0.05); density of non-signifi-
cant species were not presented.
522 Southeastern Naturalist Vol.7, No. 3
understory (<3 plants/40-m2 plot), midstory (<2.5 plants/100-m2 plot), and
overstory (<1.5 plants/400-m2 plot). No differences in density were detected
(Z ≥ -1.85, P ≥ 0.06) between present and absent sites for these woody plant
species.
The only difference detected in soil characteristics between Large-fl owered
Skullcap present and absent plots was soil pH; it was 6% greater (t18, 0.05
= 3.20, P = 0.005) on average in present plots (5.0 ± 0.2) compared to absent
plots (4.7 ± 0.3). No differences were detected (Z ≥ -1.00, P ≥ 0.30) for the
other soil variables, although mean phosphorus level was 5.6 kg/ha in Largefl
owered Skullcap absent plots compared to 7.3 kg/ha in present plots. Mean
percent organic matter was approximately 5% and mean soil temperature
was approximately 19 ºC in both plot types.
Stepwise linear regression produced a final model with two forest structure
variables that explained significant variation (F2,35 = 51.67, P < 0.001)
in Large-fl owered Skullcap density (Table 6). There was a strong positive
relationship (P < 0.001; partial R2 = 0.70) between percent horizontal cover
of grass and Large-fl owered Skullcap density. Large-fl owered Skullcap
density was negatively related (P = 0.02; partial R2 = 0.05) with percent
vertical vegetation cover. The overall coefficient of determination adjusted
for the two parameters in the model was 0.73, and there was no evidence of
multicollinearity between variables (i.e., all variance infl ation factors < 10;
Table 6). The final model was: Large-fl owered Skullcap density = 15.76 +
4.58 (% grass cover) - 0.19 (% vertical vegetation cover) (Table 6).
Discussion
The discovery of Large-fl owered Skullcap in Bledsoe County, TN represents
the northernmost record of this species within its known range. A
voucher specimen from this colony is filed with the University of Tennessee
Herbarium (JMM 02005). In general, Large-fl owered Skullcap sites could be
characterized by an intact forest with an open understory that had a grass and
vine component. Common sweetshrub and frost grape were common species
in the understory at Large-fl owered Skullcap sites. The most common overstory
trees were red maple, white oak, sourwood, and pignut hickory. Red
maple also was common in the midstory and understory.
Percent horizontal cover of grass was significantly greater in Large-
Table 6. Linear regression statistics and the final prediction model (i.e., parameter estimates, bi)
that explained significant variation in large-fl owered skullcap density in east Tennessee.
Variable1,2 bi SE t-value p-value Partial r2 VIF3
Intercept 15.76 4.26 3.70 0.007 * 0
Percent grass cover 4.58 0.45 10.10 <0.001 0.70 1.02
Percent VC -0.19 0.08 -2.50 0.018 0.05 1.02
1Variables selected using stepwise selection and parameters estimated using least-squares
estimation.
2VC = Vertical vegetation cover measured using a profile board.
3VIF = Variance infl ation factor; VIF > 10 is suggestive of multicollinearity.
2008 J.M. Mulhouse, M.J. Gray, and C.W. Grubb 523
flowered Skullcap present sites and explained 70% of the variation in
Large-flowered Skullcap density. Percent vertical cover of vegetation (as
measured with a profile board) explained an additional 5% of the variation
in Large-flowered Skullcap density. Our linear model indicated that
if percent grass cover equaled zero, Large-flowered Skullcap would not
occur if total percent vertical cover of vegetation was >83%. Both of these
results illustrate the importance of an open understory for Large-flowered
Skullcap with a grass component. Initial studies suggested Largeflowered
Skullcap was a late-successional forest species, but more recently
it has been considered a mid-successional species that co-occurs with trees
averaging <60 years old, persisting in areas where light penetrates to the
forest floor (Shea and Hogan 1998, Sutter 1993, USEPA 2002). Although
we did not measure forest floor light intensity, and canopy cover was not
significantly different between Large-flowered Skullcap present and absent
sites, the higher grass (and vine) component at Large-flowered Skullcap
present sites may suggest light availability is greater at these sites. More
research is needed to make conclusive inferences on the relationship between
Large-flowered Skullcap locations, forest floor light intensity, and
state of succession.
Percent vegetation cover in the 1.51–2.00 m vertical strata of the profile
board and overstory basal area were significantly less in Large-fl owered
Skullcap present sites, providing additional evidence that this species may
be associated with relatively open forests. Fail and Sommers (1993) reported
that Large-fl owered Skullcap sites in northwest Georgia were characterized
by low basal area and vegetative biomass. Canopy disturbance also has been
considered beneficial for Large-fl owered Skullcap (Sutter 1993, USEPA
2002). Nix (1993) stated that light afforded by broken canopy might be the
most important parameter in determining growth and survival of Large-fl owered
Skullcap. Although average canopy cover at Large-fl owered Skullcap
present plots was 92% in September when forest microsite variables were
measured, it would have been less in early spring when Large-fl owered
Skullcap was germinating. The role of natural and man-created canopy gaps
in the establishment of Large-fl owered Skullcap needs further investigation.
The highest density of Large-flowered Skullcap was 81 plants in a 400-
m2 plot, or 2025 individuals per ha. Interestingly, at this plot, the canopy
was disturbed (percent canopy = 39.4%), further suggesting the possible
importance of light penetration to the forest floor. However, it has been
suggested that canopy disturbance that occurs in conjunction with soil
disturbance may result in Large-flowered Skullcap being out-competed
by other herbaceous species (Sutter 1993, USEPA 2002). Faulkner (1993)
documented Large-flowered Skullcap in an area where logging and lowintensity
ground fires had occurred, but suggested that those plants probably
established prior to disturbance and colonization of additional plants
was unlikely. Hamel and Somers (1992) also reported a dense population of
524 Southeastern Naturalist Vol.7, No. 3
Large-flowered Skullcap along a logging road on the Cumberland Plateau
Escarpment. We made similar observations of Large-flowered Skullcap in
cutover areas, near ATV trails, and along old roads (J.M. Mulhouse, pers.
observ.). It is unknown whether Large-flowered Skullcap occurring in
these disturbed sites will persist. Additional research is needed to quantify
the extent of canopy and soil disturbance that induces reduced survival and
reproduction of Large-flowered Skullcap.
Some positive and negative associations between woody species and
Large-flowered Skullcap were documented. In the overstory, Pignut
Hickory was significantly more dense in Large-flowered Skullcap plots
while chestnut oak was significantly less dense. Similar results have
been reported by others and may be a consequence of different microsite
conditions created by these tree species (Fail and Sommers 1993). White
Oak was the second densest species in Large-flowered Skullcap plots,
which Fail and Sommers (1993) also reported. However, we also found
that there were no significant differences in White Oak overstory density
between present and absent plots, thus the association of White Oak
with Large-flowered Skullcap may be less important at our sites. Fail and
Sommers (1993) reported that Sourwood was absent at Large-flowered
Skullcap sites, but it was a relatively common overstory tree at our sites.
Red Maple was common in the overstory, midstory, and understory, which
is consistent with Fail and Sommers (1993) findings. Lastly, we found
that Virginia Pine occurred at significantly higher densities at Largeflowered
Skullcap absent sites. This result differs from Fail and Sommers
(1993), who suggested that conditions underneath Pinus echinata Miller
(Shortleaf Pine) trees could be beneficial for Large-flowered Skullcap.
On the other hand, it has been found (E. Bridges, unpubl. data) that pine
is a minor canopy component where Large-flowered Skullcap occurs.
The negative or lack of association between Large-flowered Skullcap and
pines needs further investigation.
Few midstory plant associations with Large-flowered Skullcap were
apparent. Eastern Hemlock density in the midstory was significantly less
at Large-flowered Skullcap plots. This result is not surprising because
Eastern Hemlock is known to be allelopathic (Ward and McCormick
1982). In the understory, we found that Common Sweetshrub and Frost
Grape had significantly greater density at Large-flowered Skullcap
present plots. Higher density of Common Sweetshrub at Large-flowered
Skullcap sites is similar to others (E. Bridges, unpubl. data) that suggested
a deciduous shrub layer commonly occurs with Large-flowered Skullcap.
The co-occurrence of Large-flowered Skullcap and Vaccinium spp. also
has been found (E. Bridges, unpubl. data), which differs from our results.
We found that Gooseberry plant density was greater at Large-flowered
Skullcap absent sites. These results suggest there may be differences in
Large-flowered Skullcap plant associations depending on site conditions.
Lastly, we found that density and richness of understory seedlings was
significantly greater at Large-flowered Skullcap plots, which may have
2008 J.M. Mulhouse, M.J. Gray, and C.W. Grubb 525
been a result of increased light availability to the forest floor at these sites
(Goldberg and Miller 1990, Tilman 1993).
Mean pH at Large-fl owered Skullcap absent and present plots was
slightly acidic (4.7 and 5.0, respectively), and within the range (4.5–6.3)
suggested by J.L. Collins (Vanderbilt University, unpubl. data) for Largefl
owered Skullcap occurrence. Soils were uniformly low in phosphorus and
potassium content and high in organic matter. Other soil features were comparable
between plots; thus, it does not appear that soil is responsible for the
distribution of Large-fl owered Skullcap at our sites.
Conclusion
Our linear model can be used to identify the suitability of sites for Largefl
owered Skullcap by measuring two simple variables in the field: (1) percent
horizontal cover in a 1-m2 plot and (2) percent vertical cover measured using
our design for a profile board. Field measurements of these variables can
be entered into the model to predict Large-fl owered Skullcap density (see
model parameter estimates in Table 6). Negative or zero predictions suggest
a site that is unsuitable, whereas positive values suggest potentially suitable
sites. Ideally, the accuracy of our model should be validated prior to field
use. Also, we caution against use of our model outside the region and ecosystem
where it was developed (i.e., the forested Cove-Gulf Region of east Tennessee).
In addition, given the clear association of Large-fl owered Skullcap
with light availability, judicious thinning of trees and tall underbrush may
not negatively impact the species and may even increase habitat quality. This
hypothesis needs to be tested.
Acknowledgments
We thank Bowater Incorporated for providing funding for this research and
access to research sites. We especially thank the following Bowater employees:
Barry Graden for assistance in securing funds, Don King for extensive help with
site access, and Kevin Gallagher and Mike Williford for providing field maps and
transect coordinates for our research. We also thank David Lincicome at Tennessee
Natural Heritage for assisting with taxonomy, Dr. Nicholas Herrmann at the
University of Tennessee for providing GIS data for our sites, and Justin Geise and
Andrea Moodhart for field assistance. Finally, we thank 2 anonymous referees for
comments on our manuscript.
Literature Cited
Bullock, J. 1996. Plants. Pp. 111–138, In W.J. Sutherland (Ed.). Ecological Census
Techniques: A Handbook. Cambridge University Press, Cambridge, UK. 336 pp.
Cruzan, M.B. 2001. Population size and fragmentation thresholds for the maintenance
of genetic diversity in the herbaceous endemic Scutellaria montana (Lamiaceae).
Evolution 55:1569–1580.
526 Southeastern Naturalist Vol.7, No. 3
Fail, J., Jr., and R. Sommers. 1993. Species associations and implications of canopy
change for an endangered mint in a virgin oak-hickory-pine forest. The Journal
of the Elisha Mitchell Scientific Society 109:51–54.
Faulkner, J. 1993. A survey of Scutellaria montana in the Hick’s Gap Area of Marion
County, Tennessee. Tennessee Department of Environment and Conservation,
Nasvhille, TN. 22 pp.
Goldberg, D.E., and T.E. Miller. 1990. Effects of different resource additions on species
diversity in an annual plant community. Ecology 71:213–225.
Hamel, P., and P. Somers. 1992. Final report: Biological survey of the North Chickamauga
River Gorge and synopsis of significant elements. Prepared for the Nature
Conservancy, Georgia Field Office, Atlanta, GA. 18 pp.
Higgins, K.F., K.J. Jenkins, G.K. Clambey, D.W. Uresk, D.E. Naugle, J.E. Norland,
and W.T. Barker. 2005. Vegetation sampling and measurements. Pp. 524–553, In
C.E. Braun (Ed.). Techniques for Wildlife Investigation and Management. The
Wildlife Society, Bethesda, MD. 974 pp.
Lipps, E.L. 1966. Plant communities of a portion of Floyd County, Georgia—
Especially the Marshall Forest. Ph.D Dissertation. University of Tennessee,
Knoxville, TN. 206 pp.
Nix, T.L. 1993. Intensive monitoring of Scutellaria montana Chapman in the Marshall
Forest. Unpublished report. The Nature Conservancy, Georgia Field Office,
Atlanta, GA.
Radford, A.E., H.E. Ahles, and C.R. Bell. 1968. Manual of the Vascular Flora of the
Carolinas. University of North Carolina Press, Chapel Hill, NC. 1183 pp.
SAS Institute. 2003. SAS/STAT®. Version 9.1. SAS Institute, Inc. Cary, NC.
SAS Institute. 2005. JMP Version 6.0.0. SAS Institute, Inc. Cary, NC.
Shea, A., and T. Hogan. 1998. Status survey report on Scutellaria montana Chapman
(Large-fl owered Skullcap). Prepared for the US Fish and Wildlife Service,
Asheville, NC. 98 pp.
SPSS Inc. 2006. SPSS for Windows version 15.0 SPSS Inc. Chicago, IL.
Stirling, B.K. 1983. Reduced reproductive capacity found in the rare mint Scutellaria
montana Chapman. Abstract in Georgia Journal of Science 41:9.
Sutter, R. 1993. Memo to Chickamauga–Chattanooga National Military Park: Pat
Reed, Sam Weddle, and Charlie Spear, and the National Park Service. The Nature
Conservancy, Southeast Regional Office, Chapel Hill, NC.
Tilman, D. 1993. Species richness of experimental productivity gradients: How important
is colonization limitation? Ecology 74:2179–2191.
United States Environmental Protection Agency (USEPA). 2002. Endangered and
threatened wildlife and plants; Reclassification of Scutellaria montana (Largefl
owered Skullcap) from endangered to threatened. Federal Register Environmental
Documents 67:1662–1668.
United States Fish and Wildlife Service (USFWS). 1996. Large-fl owered Skullcap
recovery plan. Asheville, NC. 31 pp.
Ward, H.A., and L.H. McCormick. 1982. Eastern Hemlock allelopathy. Forest Science
28:681–686.
Weakley, A.S. 2006. Flora of the Carolinas, Virginia, Georgia, and surrounding
areas. Working Draft of 6 January 2006. University of North Carolina, Chapel
Hill, NC. 1082 pp.
Wofford, B.E., and E.W. Chester. 2002. Guide to the Trees, Shrubs, and Woody Vines
of Tennessee. The University of Tennessee Press, Knoxville, TN. 286 pp.


 The Southeastern Naturalist is a peer-reviewed journal that covers all aspects of natural history within the southeastern United States. We welcome research articles, summary review papers, and observational notes.