2009 SOUTHEASTERN NATURALIST 8(1):129–140
Hemlock Susceptibility to Hemlock Woolly Adelgid Attack
in the Chattooga River Watershed
Mark Faulkenberry1,*, Roy Hedden2, and Joe Culin3
Abstract - Adelges tsugae (Hemlock Woolly Adelgid [HWA]), an introduced pest,
is impacting Tsuga canadensis (Eastern Hemlock), and T. caroliniana (Carolina
Hemlock) stands throughout the eastern United States. Currently, hemlock stands in
the southeast US are on the leading edge of the infestation. This study investigated
HWA distributions in the Chattooga River watershed, and examined relationships
between site and stand variables and hemlock susceptibility to HWA attack. The
following variables were examined: latitude, longitude, elevation, slope, aspect,
terrain shape index (TSI), landform index (Lfi), percent infestation, quadratic mean
diameter, total basal area (BA), hemlock BA, non-hemlock BA, hemlock BA(%),
non-hemlock BA(%), and tree height. Multiple regression with backward selection
showed statistically significant relationships of HWA infestation to latitude (P =
0.0006), longitude (P < 0.0001), and TSI (P = 0.0316). The proximity of a hemlock
stand to existing HWA infestations appears to be the primary factor infl uencing its
susceptibility to attack.
Introduction
Since Adelges tsugae Annand [Hemlock Woolly Adelgid (HWA)] was
accidentally introduced into Virginia from Japan in the 1950s, it has become
a serious pest of Tsuga canadensis L. (Eastern Hemlock) and Tsuga caroliniana
Engelm (Carolina Hemlock) in the eastern United States (McClure et al.
2001, Orwig and Foster 1998). Carolina Hemlock distribution is limited to
the Appalachian Mountains, from southwestern Virginia, south into western
North Carolina, northwestern South Carolina, eastern Tennessee, and northeastern
Georgia, where it commonly occurs on cliffs and rocky slopes and
ridges at elevations greater than 914 m (Caladonato 1993, Humphrey 1989,
Little 1975). Eastern Hemlock is more widely distributed, occuring throughout
New England, New York, Pennsylvania, the mid-Atlantic states, central
New Jersey west to the Appalachian Mountains, and south into Northern
Georgia and Alabama (Godman and Lancaster 1990). In the northern and
northeastern parts of its range, Eastern Hemlock is commonly found up to
730 m in elevation on benches, fl ats, and swampy borders. In the southern
Appalachians, Eastern Hemlock is typically found from 610–1520 m in
elevation, on north and east slopes, coves, or cool moist valleys (Godman
1Department of Forestry and Natural Resources, Department of Entomology, Soils
and Plant Science, College of Agriculture Forestry and Life Sciences, Clemson
University, Clemson, SC 29634. 2Department of Forestry and Natural Resources,
Clemson University, Clemson, SC 29634. 3Department of Entomology, Soils and
Plant Science, Clemson University, Clemson, SC 29634. *Corresponding author -
mfaulke@clemson.edu.
130 Southeastern Naturalist Vol. 8, No. 1
and Lancaster 1990). Both Carolina Hemlock and Eastern Hemlock are
slow growing, long lived, and very tolerant of shade, often considered
late successional species (Caladonato 1993, Godman and Lancaster 1990,
Humphrey 1989).
HWA infestations are now found in 17 states in the eastern US, with
extensive hemlock mortality being reported in Virginia, Pennsylvania,
Connecticut, and New Jersey (Knauer et al. 2002, Orwig and Foster 1998,
Skinner et al. 2003, USDA Forest Service 2007). Infestations may cause
mortality within four years (McClure et al. 2001). Since 1990, the HWA has
been spreading at a mean rate of 12.5 km per year, with rates as high as 15.6
km per year in the southern portion of its range (Evans and Gregoire 2007).
Hemlock stands provide habitat for a variety of wildlife and create dense
canopies, shading and cooling headwater streams (McClure et al. 2001). In
addition, hemlock stands have also been shown to have a powerful infl uence
on nutrient cycling (Jenkins et al. 1999, Yorks et al. 2000). HWA-related
mortality will have a drastic effect on the composition of habitats currently
dominated by hemlock throughout the eastern US, with a shift from conifers
to mixed species hardwoods (Jenkins et al. 1999, Kizlinkski et al. 2002,
Orwig et al. 1998). The loss of hemlock, and its replacement by hardwood
species, is likely to significantly affect stream habitats, lowering invertebrate
diversity and altering the trophic structure of fish and invertebrates, as well
as nitrogen and other nutrient fl uxes from the canopy to the forest fl oor (Snyder
et al. 2005, Stadler et al. 2006).
Although much research has been conducted on the relationships of site
and stand components to HWA infestations in the northeast, (e.g., Orwig and
Foster 1998, Orwig et al. 2002, Royle and Lathrop 2000), few studies have
been performed on similar factors in hemlock stands in the southeastern
United States. Therefore, the objectives of this study were: 1. to map HWA
infestations within the Chattooga River watershed of North Carolina, South
Carolina, and Georgia, and 2. to determine the relationship between stand
and site characteristics and hemlock susceptibility to HWA attack.
Infestation maps from this study may be used to determine the rate
of spread of HWA in the Chattooga watershed, as well as the likely pattern
of hemlock mortality. Site or stand components found to be correlated
with hemlock susceptibility to the HWA could serve as the basis for a risk
model to identify high-risk areas for intensive monitoring. Early identification
of high-risk areas would also allow resource managers to initiate control
efforts before significant damage occurred and optimally allocate resources
for HWA management.
Methods and Materials
Study area and study sites
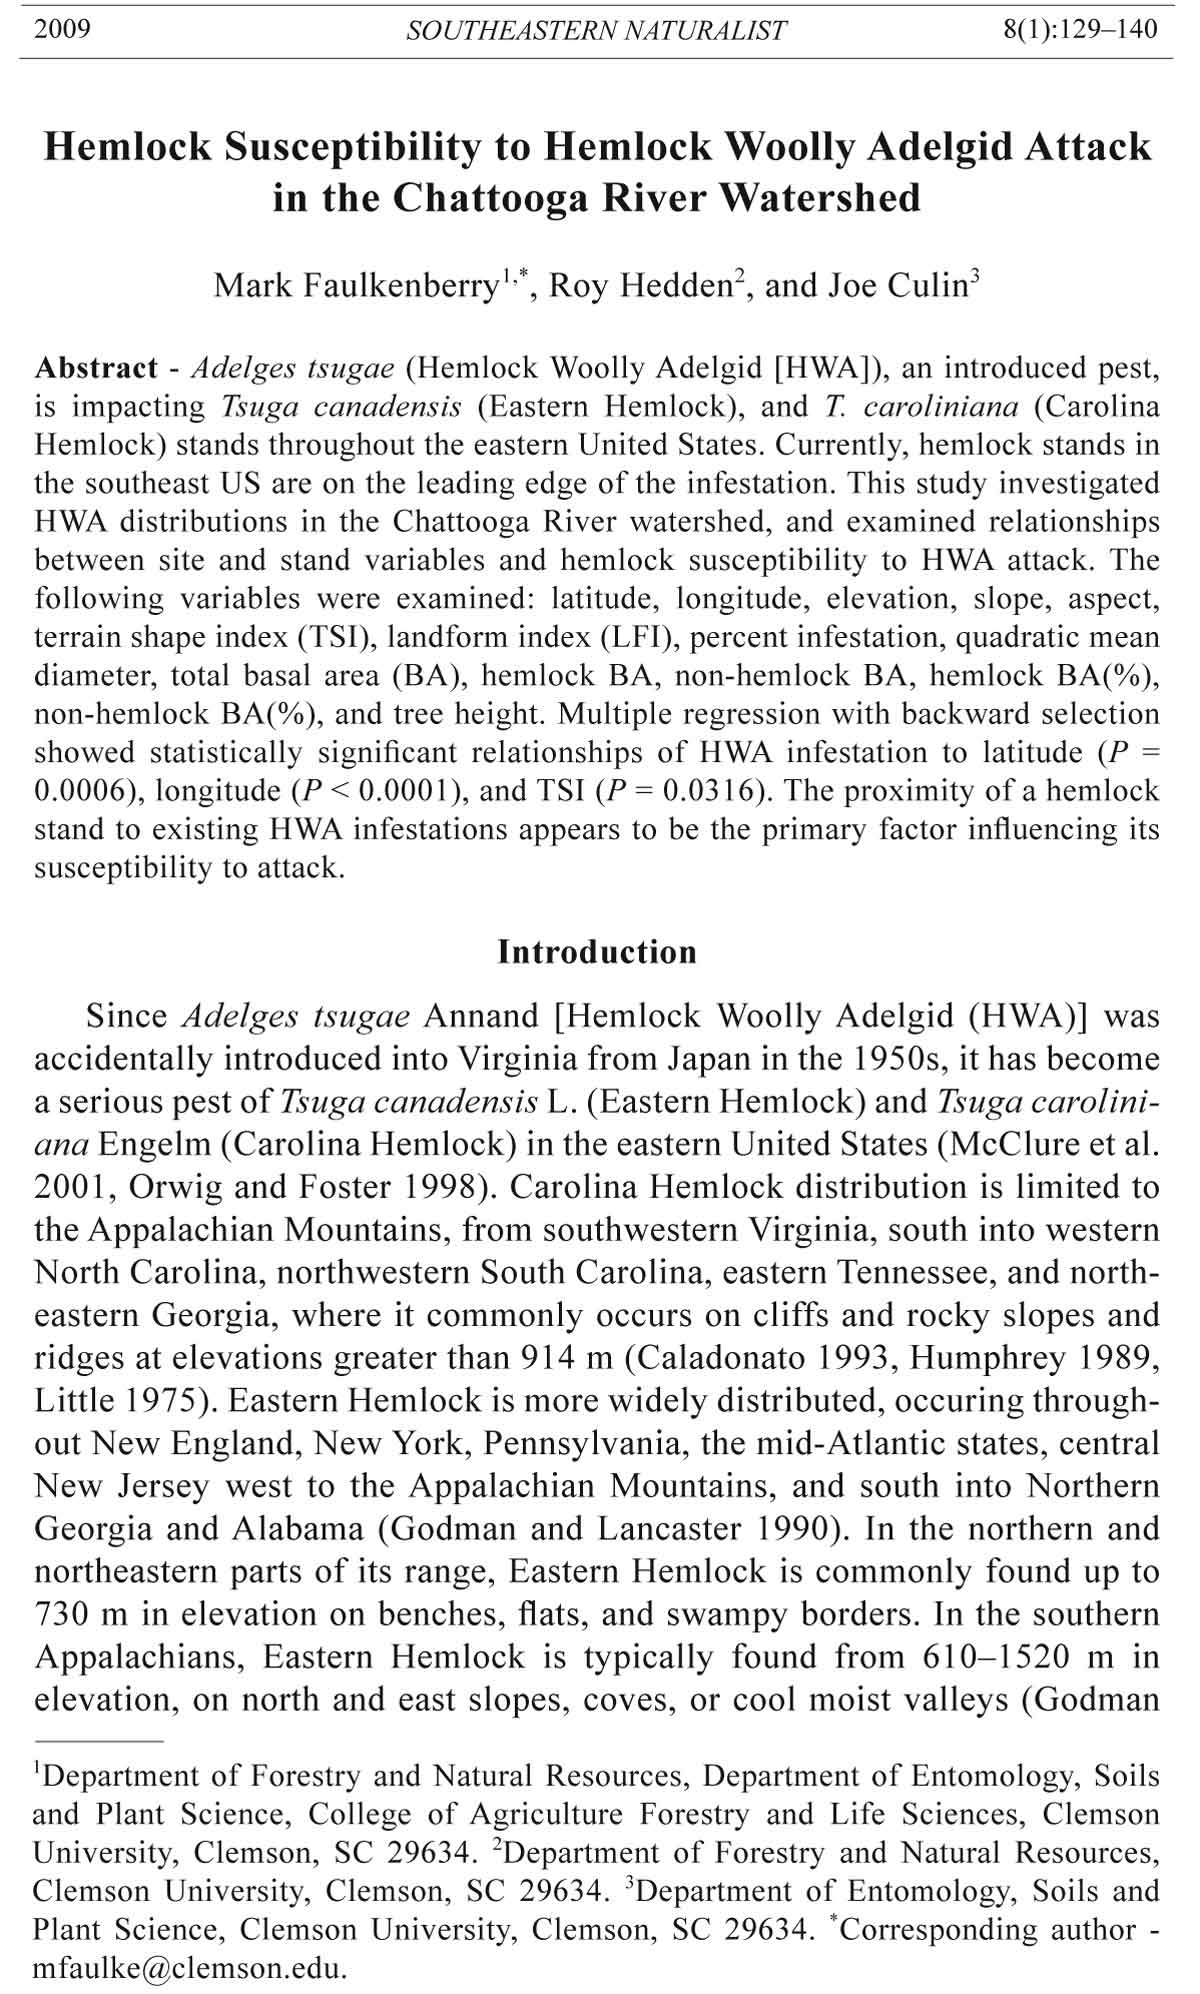
The study was conducted in the Chattooga River watershed, which covers
72,840 ha, in South Carolina, Georgia, and North Carolina. All study
sites were located in the Nantahala National Forest in North Carolina, the
2009 M. Faulkenberry, R. Hedden, and J. Culin 131
Chattahoochee National Forest in Georgia, and the Sumter National Forest
in South Carolina (Fig. 1).
Most of the study sites were established in cool, moist coves and riparian
areas, with overstories of Eastern Hemlock, Pinus strobus L. (White Pine),
Liriodendron tulipifera L. (Yellow Poplar), mixed mesophytic hardwoods,
and understories of Rhododendron maximum L. (Rhododendron), and Kalmia
latifolia L. (Mountain Laurel). There were 104 study sites located in
the watershed, many of them along existing hiking trails and paths. Trails
were chosen at random, and sample plots were inserted at 0.80-km intervals
along each trail.
Figure 1. Hemlock Woolly Adelgid infestation map for the Chattooga River Watershed
in North Carolina, Georgia, and South Carolina.
132 Southeastern Naturalist Vol. 8, No. 1
At each sample plot, a random number between 1 and 12 was generated,
corresponding with the numbers on a clock face, with 12 and 6
forming an axis parallel to the trail. Sampling points were established
6 m off of the trail, in the direction of the random number. The random
numbers of 6 and 12 were not used in the selection of sample points, to
prevent sampling the trails.
The following site characteristics were measured for each point: latitude,
longitude, elevation above sea level, slope angle, topographic aspect, terrain
shape index (TSI), landform index (Lfi), and level of HWA infestation. Variable
radius plots were established at each point to measure stand components. A
description of each site and stand component measured is given below.
Site data
Latitude, longitude, elevation. Using a GPS receiver (Garmin™ eTrex®),
latitude and longitude and elevation above sea level were determined. The
slope angle and topographic aspect were measured for each point. Aspect
values were transformed for use in statistical analysis (Beers et al. 1966,
Trimble and Weitzman 1956). The aspect transformation formula is:
A = sin (A1 + 45) + 1,
with “A” equaling the transformed aspect, and “A1” equaling the aspect
originally recorded in azimuth degrees. With this transformation, a minimum
value of zero is equivalent to southwest (generally more xeric) and a maximum
value of 2 is equivalent to northeast (generally more mesic).
Topography and landform. Terrain shape index (TSI) is a quantifiable
measurement of the shape of a sample plot (McNab 1989). Using a handheld
clinometer, eight percent gradients were recorded from the center of the plot
starting in the direction of the aspect. At every 45 degrees, a percent gradient
was measured at the observer’s eye level, targeting wherever the surface
changed shape to plot perimeter. The eight slope percents were then summed
and divided by 800. Negative TSIs correspond to convex plots, while positive
TSIs indicate concave plots.
Landform index (Lfi) is a quantifiable measurement of the position of a
sample plot on the landscape (McNab 1993). Using a handheld clinometer,
eight percent gradients were recorded from the center of the plot starting in
the direction of the aspect. At every 45 degrees, a percent gradient was measured,
targeting the area where the landscape and the horizon made contact.
High Lfivalues are indicative of a concave landform (e.g., cove), and low
Lfivalues are indicative of a convex landform (e.g., ridge).
Level of infestation. Starting at plot center, an 8-m radius (0.08-ha)
circular plot was measured. Visual surveys were done on five random
hemlocks distributed throughout the plot, with attempts to measure trees
of varying size classes within each site. On each of the five survey trees,
four branches were examined, inspecting one branch for every side of the
tree. Attempts were made to measure branches throughout the crowns of
the survey trees. However, due to the difficulty of examining upper crowns
2009 M. Faulkenberry, R. Hedden, and J. Culin 133
of hemlocks over 9 m in height, primarily middle to lower crown branches
were examined. For each branch that was examined, the presence or absence
of HWA was recorded. The percentage of the 20 branches (5 trees, 4
branches each) with the HWA present, was recorded as the percent infestation
for the sample plot.
Stand data
Bitterlich’s variable radius plot method was performed at each sample
point, using a wedge prism with a basal area factor (BAF) of 2 m2/ha to
estimate stand basal area. The diameter at breast height (1.37 m, DBH) was
measured for each tree in the 0.08-ha circular plots, and was used to determine
the basal area (BA) for each in-plot tree, as well as the mean BA per
plot. The mean BA per tree was used to calculate the quadratic mean diameter
(QMD) using the formula:
QMD =
where QMD is a measure of the average tree diameter in the plot, and is
the typical measurement of mean diameter used in forestry (Curtis and
Marshall 2000). The quadratic mean is different than the arithmetic mean
commonly encountered in statistical analyses, although the differences between
mean diameters calculated from both methods usually do not differ
greatly (Curtis and Marshall 2000). Basal area per hectare was calculated
separately for hemlock and non-hemlock. These values were also used to
calculate the percentage of total basal area comprised of hemlock or nonhemlock
trees in each stand. Finally, the height was measured for two of
the tallest trees within each 0.08-ha circular plot. Tree heights were averaged
as a measure of mean tree height within each plot.
Statistical analysis
Multiple regression analysis was used to identify significant relationships
between infestation level and the site and stand variables measured
(Ott and Longnecker 2001). In order to meet normality assumptions, percent
infestation was arcsin transformed (AINF) as follows:
AINF = ARSIN(SQRT(percent infestation / 100)),
where AINF is represented in radian units. Backward selection was first
used to determine if any site or stand variables were significant in explaining
HWA infestation (AINF). Multiple regression analysis was then repeated
using all significant site and stand variables. All statistical analyses were
performed with SAS statistical software (SAS Institute Inc. 2002).
Infestation map
An HWA infestation map of the study site was created using Arc Map
9.0 GIS software (ESRI Inc. 2004) and ERDAS IMAGINE 8.7 GIS software
(Leica Geosystems 2004). Hillshade and hydrography layers were used to
construct the map, in addition to a layer describing the latitude, longitude,
and infestation level for each sample point. Infestation levels were divided
√ (BA / 0.000007854),
134 Southeastern Naturalist Vol. 8, No. 1
into 4 discrete categories of infestation (Table 1). The hillshade layers were
obtained through the South Carolina Department of Natural Resources website
(www.dnr.sc.gov), and the hydrography layers were purchased through
www.mapmart.com.
Results and Discussion
Regression of site factor and stand component data
Multiple regression analysis, using backward selection on all site and
stand variables resulted in a model of latitude, longitude, and TSI that significantly explained percent HWA infestation, (t = 12.47, P = 0.0006), (t =
20.65, P < 0.0001), (t = 4.75, P = 0.0316), respectively (Figs. 2–4). The
model was highly significant (F = 31.85, P < 0.001), explaining almost 50%
of the variation in the data (R2 = 0.48; Table 2). Of these variables, TSI was
Table 1. Criteria for assigning the level of infestation for Hemlock Woolly Adelgid in the Chattooga
watershed.
Percent of branches infested Infestation level
0% None
1–50% Light
51–80% Medium
81–100% Heavy
Figure 2. Correlation of Hemlock Woolly Adelgid infestation with longitude for the
Chattooga River watershed (n = 104; ∝ = 0.05).
2009 M. Faulkenberry, R. Hedden, and J. Culin 135
Figure 3. Correlation of Hemlock Woolly Adelgid infestation with latitude for the
Chattooga River watershed (n = 104; ∝ = 0.05).
Figure 4. Correlation of Hemlock Woolly Adelgid infestation with terrain shape
index for the Chattooga River watershed (n = 104; ∝ = 0.05).
136 Southeastern Naturalist Vol. 8, No. 1
the least significant variable in the model, and the only variable that was not
singularly correlated with infestation (Table 3). A positive correlation of infestation
with elevation was observed (Table 3). All site and stand variables
which were eliminated by backward selection and their accompanying F and
P values are listed in (Table 2).
Infestation map of the Chattooga watershed
Infestation level declined from northeast to southwest through the Chattooga
watershed. Of 104 sample sites in the watershed, 51 were heavily
infested, 16 were moderately infested, 24 were lightly infested, and 13 were
not infested (Fig. 1). The northern portion of the watershed, which is also the
most heavily infested, was likely the first area where HWA infestations were
Table 2. All site and stand variables eliminated from the model using the backward selection
method. All variables appear in the order in which they were removed from the model, and the
R-square for the model after each variable was removed is given in column four. The test statistic
for each variable is given in column two, and the corresponding P values for each variable is
given in column three (n = 104). Variables remaining in final regression model: latitude, longitude,
TSI. Final R-square = 0.48 Abbreviations are: Lfi= landform index, BA= basal area.
Variable F value Pr > F R-square
Mean tree height (m) 0.00 0.9636 0.5475
Lfi0.19 0.6635 0.5465
Elevation (m) 0.60 0.4415 0.5436
Quadratic mean diameter (cm) 0.68 0.4116 0.5402
Slope 1.36 0.2469 0.5336
% BA Hemlock 1.56 0.2148 0.5259
% BA non-hemlock 1.29 0.2594 0.5336
BA non-hemlock (m2/ha) 1.32 0.2528 0.2528
Basal area (BA) (m2/ha) 0.93 0.3384 0.5225
Aspect 1.78 0.1851 0.5074
BA hemlock (m2/ha) 3.78 0.0547 0.4886
Table 3. Correlations of all site and stand variables measured in the Chattooga Watershed to
hemlock woolly adelgid infestation (n = 104). All correlations appear as correlation coefficients
(r), and variables are listed in ascending order to their correlation with infestation.
Variable Correlation (r)
Longitude -0.632
Quadratic mean diameter (cm) -0.172
Mean tree height (m) -0.127
% BA non-hemlock -0.032
% BA hemlock 0.028
BA hemlock (m2/ha) 0.029
BA non-hemlock (m2/ha) 0.050
Lfi0.054
Basal area (BA) (m2/ha) 0.062
Aspect 0.079
TSI 0.095
Slope 0.169
Latitude 0.616
Elevation (m) 0.631
2009 M. Faulkenberry, R. Hedden, and J. Culin 137
encountered in the watershed as the adelgid moved south and southwest
from its initial introduction point in Virginia. The Forest Service reported
the presence of the HWA in Macon and Jackson counties (North Carolina),
and Oconee County (South Carolina) in 2001 (USFS 2007). Starting in the
northeast portion of the infestation map, the HWA traveled approximately 20
km in the Chattooga watershed from 2001–2004, nearly 40% of the length
of the watershed. Although wind is one of the primary vectors of the HWA,
the movement of the infestation front through the Chattooga watershed is not
consistent with the prevailing winds in the area (Koch et al. 2006). The mean
prevailing wind directions for two nearby weather monitoring stations in
Asheville, NC, and Athens, GA from 1930–1996 were from north-northwest,
and west-northwest, respectively (National Climatic Data Center 2007).
Site and stand components
Of all the stand and site components measured in this study, only longitude,
latitude, and TSI significantly predicted levels of HWA infestation.
These results suggest that HWA may have the potential to spread throughout
the range of hemlock in the southeastern United States, regardless of any
particular site or stand component. Latitude and longitude were the only
significant predictors of percent infestation, with the trend running northeast
to southwest. Since this is an artifact of how the infestation front is moving,
the only predictor of susceptibility to HWA attack is the proximity of the
hemlock stand to an infested area. HWA is expanding throughout the range
of hemlock, and we can expect that all hemlock stands in the southernmost
portion of the range, which includes the Chattooga river watershed, will
eventually be colonized. A similar trend in infestation levels was observed
as HWA moved north from Virgina to Connecticut (Orwig et al. 2002). In a
study in Connecticut, site and stand variables were also found to have little
effect on hemlock susceptibility to HWA attack, and latitude had the strongest
correlation with HWA infestation and hemlock mortality (Orwig and
Foster 1998, Orwig et al. 2002).
Research by Koch et al. (2006) contradicts the suggestion that all hemlock
stands are equally susceptible to the HWA, reporting that the distance of
a hemlock stand from the closest road, trail, and stream all infl uence where
the HWA is more likely to first appear in the landscape. Streams, roads, and
trails create corridors that make hemlock stands more accessible to humans,
birds, and wind, three main vectors for the insect. Unlike our research, Koch
et al. (2006) found elevation and slope to be significant predictors of the
susceptibility of a site to HWA infestation, suggesting that steeper slopes
and higher elevations made a site less accessible to vectors of the adelgid.
Although elevation was significantly correlated with infestation in our data,
it was not a significant predictor of infestation. It should be noted that while
TSI was not significantly correlated with infestation (Table 3), it was a significant predictor of infestation in our model. Although TSI was significant
in the model, it was the least significant variable of the three, and was only
weakly related to infestation level, explaining 3% of the variation in the
model. It is unclear why TSI was significant in the model, since the mean
138 Southeastern Naturalist Vol. 8, No. 1
TSI for all plots was -0.003, meaning the plots were almost completely fl at.
If the mean terrain shape were more convex or concave, this would likely
affect the quality of a site, infl uencing water movement and other factors
(Mc Nabb 1989).
Small et al. (2005) also found elevation to be a significant predictor of
hemlock mortality due to the HWA, yet reported that ledges had a 15.6%
greater decline in hemlock basal area than ravines. The significance of elevation
to HWA-related hemlock mortality in this study was more closely
correlated with the quality of the site in relation to water and other factors,
than the accessibility of the site to vectors, as reported by Koch et al. (2006).
Due to the fact that many of our sample points were along streams, hiking
trails, and paths, this may have led to some inaccuracies regarding the levels of
HWA infestation for the study. Since research by Koch et al. (2006) showed that
the proximity of a hemlock stand to the nearest road, trail, or stream has a considerable
infl uence on where HWA will first appear in a landscape, it is possible
that we overestimated the infestation levels for our study site. The decision to
use hiking trails and paths was made in order to facilitate navigation through the
study area and to increase to amount of sample points that could be completed.
Conclusions
The objectives of this study were to map HWA infestations within the
Chattooga River watershed and to determine the relationship between stand
and site characteristics and hemlock susceptibility to HWA attack. A map
of HWA infestations within the Chattooga watershed was created, and there
appears to be no relationship between the stand and site variables measured
and susceptibility to HWA infestation. The only variables of consequence
were the latitude and longitude of the study sites, which showed that HWA
is spreading south and west through the Chattooga watershed. In the southeastern
United States, our research suggests that all hemlock stands appear
to be equally susceptible to HWA attack.
Acknowledgments
We thank Vic Shelburne (Clemson University), Jim Sullivan (Georgia Forestry
Commission), Rusty Rhea (US Forest Service), and Buzz Williams (Chattooga Conservancy)
for valuable assistance. This project was funded by the US Forest Service,
National Forest Foundation, Chattooga Conservancy, and the Jackson Macon County
Alliance (JMCA). We also thank Thorlos, Kelty, Patagonia, Cascade Designs, Woolrich,
and Wrangler for supplying research gear. This report is publication number 5132 of the
South Carolina Agricultural and Forestry Research System of Clemson University.
Literature Cited
Beers, T.W., Dress, P.E., and L.C. Wensel. 1966. Aspect transformation in site productivity
research. Journal of Forestry 64:691–692.
Caldadonato, M. 1993. Tsuga caroliniana: Fire Effects Information System, Available
online at http://www.fs.fed.us/database/feis. Accessed August 15, 2007. US
Department of Agriculture, Forest Service, Rocky Mountain Research Station,
Fire Sciences Laboratory, Missoula, MT.
2009 M. Faulkenberry, R. Hedden, and J. Culin 139
Curtis, R., and D. Marshall. 2000. Why quadratic mean diameter. Western Journal of
Applied Forestry 3:137–139.
ESRI, Inc. 2004. ArcMap 9.0. ESRI Inc., Redlands, CA.
Evans, A.M., and T.G. Gregoire. 2007. A geographically variable model of Hemlock
Woolly Adelgid spread. Biological Invasions 9:369–382.
Godman, G.A., and K. Lancaster. 1990. Tsuga canadensis (L.) Carr. Eastern Hemlock.
Pp. 604–612, In R.M.Burns and B.H. Honkala (Technical Coordinators).
Silvics of North America. Volume 1. Conifers. Agric. Handb. 654. US Department
of Agriculture, Forest Service, Washington, DC.
Humphrey, L.D. 1989. Life-history traits of Tsuga caroliniana Engelm. (Carolina
Hemlock) and its role in community dynamics. Castanea 54:172–190.
Jenkins, J.C., J.D. Aber, and C.D. Canham. 1999. Hemlock Woolly Adelgid impacts
on community structure and N-cycling rates in Eastern Hemlock forests. Canadian
Journal of Forest Research 29:630–645.
Kizlinski, M.L., D.A. Orwig, R.C. Cobb, and D.R. Foster. 2002. Direct and indirect
ecosystem consequences of an invasive pest on forests dominated by Eastern
Hemlock. Journal of Biogeography 29:1489–1503.
Knauer, K., J. Linnane, K. Shields, and R. Bridges. 2002. An initiative for management
of Hemlock Woolly Adelgid. Pp. 9–12, In Proceedings: Symposium on
the Hemlock Woolly Adelgid In Eastern North America. B. Onken, R. Reardon,
and J. Lashomb (Eds.). East Brunswick, NJ, February 5–7, 2002. USDA Forest
Service, Rutgers, NJ. 403 pp.
Koch F.H., H.M. Cheshire, and H.A. Devine. 2006. Landscape-scale prediction
of Hemlock Woolly Adelgid, Adelges tsugae (Homoptera: Adelgidae), infestation
in the Southern Appalachian mountains. Environmental Entomology
35:1313–1323.
Leica Geosystems, Erdas Imagine 8.7 (2004). Leica Geosystems AG, St. Gallen,
Switzerland.
Little, E.L., Jr. 1975. Rare and local conifers in the United States. Conservation
Research Report No. 19. US Department of Agriculture, Forest Service, Washington,
DC. 25 pp.
McClure, M.S., S.M. Salom, and K.S. Shields. 2001. Hemlock Woolly Adelgid.
USDA Forest Service, Morgantown, WV. FHTET-2001-03. 14 pp.
McNab, W.H. 1989. Terrain shape index: Quantifying effects of minor landforms on
tree height. Forest Science 35:91–103.
McNab, W.H. 1993. A topographic index to quantify the effect of meso-scale landform
on site productivity. Canadian Journal of Forest Research 23:1100–1107.
National Climatic Data Center (NCDC) 1997. Climatic wind data for the United
States. Available online at http://www5.ncdc.noaa.gov/documentlibrary/pdf/
wind1996.pdf. Accessed December 17, 2007.
Orwig, D.A., and D.R. Foster, 1998. Forest response to the introduced Hemlock
Woolly Adelgid in southern New England, USA. Journal of the Torrey Botanical
Society 125:60–73.
Orwig, D.A., Foster, D.R., and D.L. Mausel. 2002. Landscape patterns of hemlock
decline in New England due to the introduced Hemlock Woolly Adelgid. Journal
of Biogeography 29:1475–1487.
Ott, L., and M. Longnecker. 2001. An Introduction To Statistical Methods and Data
Analysis. Duxbury Press, Belmont, CA. 1152 pp.
140 Southeastern Naturalist Vol. 8, No. 1
Royle, D., and R. Lathrop. 2000. The effects of site factors on the rate of hemlock
decline: A case study in New Jersey. P. 103, In K.A. McManus, K.S. Shields,
and D.R. Souto. (Eds.). Proceedings: Symposium on Sustainable Management of
Hemlock Ecosystems in Eastern North America. Durham, New Hampshire. June
22–24, 1999. USDA Forest Service, Newtown Square, PA.
SAS Institute Inc. 2002.Version 9.0. SAS Institute Inc. Cary, NC.
Skinner, M., B. Parker, S. Gouli, and T. Ashikaga. 2003. Regional responses of
Hemlock Woolly Adelgid (Homoptera: Adelgidae) to low temperatures. Environmental
Entomologist 32:523–528.
Small M.J., Small C.J., and G.D. Dreyer. 2005. Changes in a hemlock-dominated
forest following woolly adelgid infestation in southern New England. Journal of
the Torrey Botanical Society 132:458–470.
Snyder, C.D, Young, J.A., Ross, R.M., and D.R. Smith. 2005. Long-term effects
of hemlock forest decline on headwater stream communities. Pp. 42–55, In B.
Onken and R. Reardon (Eds.). Proceedings: Third Symposium On Hemlock
Woolly Adelgid in the United States. Asheville, North Carolina. February 1–3,
2005. 384 pp. USDA Forest Service, Morgantown, WV.
South Carolina Department of Natural Resources (SC DNR). 2004. SC DNR Home
Page. Available online at http://www.dnr.sc.gov. Accessed July 5, 2004.
Stadler, B., T. Muller, and D. Orwig. 2006. The ecology of energy and nutrient
fl uxes in hemlock forests invaded by Hemlock Woolly Adelgid. Ecology
87:1792–1804.
Trimble, G.R., and S. Weitzman, 1956. Site-index studies of upland oaks in the
northern Appalachians. Forest Science 2:162–173.
USDA Forest Service (USFS). 2007. List of states with known Hemlock Woolly
Adelgid infestations. Available online at http://www.fs.fed.us/na/morgantown/
fhp/hwa/infestations.htm. Accessed November 12, 2007.
Yorks, T.E., J.C. Jenkins, D.J. Leopold, D.J. Raynal, and D.A. Orwig. 2000. Infl uences
of Eastern Hemlock mortality on nutrient cycling. Pp. 126–133, In K.A.
McManus, K.S. Shields, and D.R. Souto (Eds.). Proceedings: Symposium on
Sustainable Management of Hemlock Ecosystems in Eastern North America.
Durham, New Hampshire. June 22–24, 1999. USDA Forest Service, Newtown
Square, PA.


 The Southeastern Naturalist is a peer-reviewed journal that covers all aspects of natural history within the southeastern United States. We welcome research articles, summary review papers, and observational notes.