2010 SOUTHEASTERN NATURALIST 9(4):837–846
Flowering Phenology:
Trends over 32 Years in a Common Garden
J. Dan Pittillo1 and Beverly Collins2,*
Abstract - Flowering times of some early-season plants vary with temperature. First
flowering dates of 35 native spring herbs and one shrub (Lindera benzoin [Northern
Spicebush]), recorded yearly from 1976 through 2008 in a common garden in western
North Carolina, were analyzed to determine if they correlate with January or
spring (February–May) temperature or show a trend over time. We also asked if species
that flower earlier in the season are more tightly correlated with temperature than
later-season species. One early-season (average flowering date = March 6) species,
Carex plantaginea (Plantainleaf Sedge) and one later-season (average flowering date
= April 11) species, Geranium maculatum (Spotted Geranium), showed a significant
trend of flowering earlier over time; seven April-flowering species showed weak, statistically
non-significant, trends of earlier flowering over time; and one species (Iris
cristata) exhibited a weak trend of later flowering over time. Four mid-season (mid-
March–early April) species showed a significant trend, and seven species showed a
weaker, not significant trend, of earlier flowering in years with warmer January or
spring temperatures. Overall, weak seasonal and longer-term responsiveness despite
variation in soil and air temperatures over the site, multiple plantings for some species,
and only a modest 0.28 °C increase in average January temperature over the
32-year observation period suggest flowering phenology of at least some plants in
this common garden will track future climate change.
Introduction
Flowering phenology of many plant species tracks the local microclimate
(Castelli 1970; Fitter and Fitter 2002; Fitter et al. 1995, 2002; Funderburk
and Skeen 1976; Jackson 1966), and earlier flowering over time has been
shown in response to climate warming (Bradley et al. 1999, Fitter and Fitter
2002, Miller-Rushing and Primack 2008, Post et al. 2008). Flowering times
of common trees such as Betula lenta L. (Sweet Birch) and Salix glauca L.
(Grayleaf Willow), shrubs such as Vaccinium corymbosum L. (Highbush
Blueberry), and herbs such as Hypericum perforatum L. (Common St. Johnswort)
are responsive to temperature (Miller-Rushing and Primack 2008, Post
et al. 2008), and flowering time at one New England site is now seven days
earlier than in the mid-1800s (Miller-Rushing and Primack 2008). In as short
as two years, artificial warming advanced some or all phenological events in
Cerastium alpinum L. (Alpine Chickweed), Salix glauca, and Betula nana
L. (Bog Birch) (Post et al. 2008). However, not all species or phenological
1Department of Biology; Western Carolina University, Cullowhee, NC 29823. 2Department
of Biology and Southern Appalachian Biodiversity and Ecology Center,
Western Carolina University, Cullowhee, NC 28723. *Corresponding author - collinsb@
email.wcu.edu.
838 Southeastern Naturalist Vol. 9, No. 4
events of a species are responsive to temperature (Fitter and Fitter 2002;
Fitter et al. 1995, 2002; Parmesan 2007; Willis et al. 2008). Floweringtime
response traits are shared among closely related species in Thoreau’s
woods, with some clades, including bluets, violets, and orchids, showing no
response to temperature (Willis et al. 2008). Nevertheless, responses of cooccurring
congeners at this site can differ: flowering times of Betula lenta
and Solidago rugosa P. Mill. (Wrinkleleaf Goldenrod) were responsive to
temperature increase, while those of Betula populifolia Marsh (Gray Birch)
and Solidago (now Euthamia) graminifolia L. (Flattop Goldenrod) were not
(Miller-Rushing and Primack 2008). Further research is needed to elucidate
the patterns of variation in temperature responsiveness among species and
over environmental variation, the mechanisms that underlie these patterns,
and the impacts of phenological change on plant communities (Post and
Inouye 2008).
Among native plants, spring and early-summer flowering species may be
predicted to be most responsive to temperature (Fitter and Fitter 2002; Fitter
et al. 1995, 2002; Miller-Rushing and Primack 2008). Our research focused
primarily on perennial forest understory herbs, most of which are geophytes;
their phenology has been related to temperature (Dahlgren et al. 2007;
Fitter and Fitter 2002; Fitter et al. 1995, 2002). For example, emergence
and flowering phenology of Actaea spicata L. (Baneberry) were related to
soil temperature (Dahlgren et al. 2007). However, flowering phenology of
spring-flowering species may be related to temperature during the growing
season (e.g., March, April), in months (January, February) just before the
growing season, or in the preceding autumn (Fitter and Fitter 2002; Fitter et
al., 1995, 2002; Miller-Rushing and Primack 2008). In addition, flowering
phenology of understory herbs could be influenced by a number of factors
other than air temperature. For example, soil temperature, slope aspect, and
canopy cover together explained 83% of the variation in flowering time of
A. spicata (Dahlgren et al. 2007), and flowering times of spring wildflowers
has been related to slope position and aspect (Jackson 1966). Flowering
phenology response of some spring herbs to temperature can be modified by
light (Castelli 1970, Funderburk and Skeen 1976). Understory herb guilds
that reflect emergence and flowering phenology as well as plant photosynthetic
strategy and shade tolerance with respect to the timing of canopy
closure have long been described (e.g., Kudo et al. 2008, Sparling 1967).
Climate models for the southeastern US predict a 2.5–5 °C increase in
mean annual temperature and a significant increase in the summer heat index
by 2080 (Karl et al. 2009). Since 1970, the average annual temperature
of the region has risen about 1.1 °C and the number of freezing days has
declined by 4–7 days (Karl et al. 2009). Over the last 30 years (since 1978),
average spring (February–May) temperature in Cullowhee, NC, site of the
present research, has averaged 11.2 °C, with a cooler period between 1978
and 1983 (mean = 10.4 °C), a warmer period between 1984 and 2004 (11.6
°C), and a slightly cooler period since 2004 (11.1 °C) (data for Cullowhee
2010 J.D. Pittillo and B. Collins 839
station from National Climatic Data Center [NCDC], Asheville, NC). As fit
by regression based on NCDC data, average January temperatures have risen
0.28 °C over the last 30 years (temperature = -16.280 + (0.00912 * year); r2 =
0.15, P = 0.029). Our research focused on a 32-year record of first flowering
dates (FD) of understory herbs and one shrub (Lindera benzoin L [Northern
Spicebush]) that were planted or occur naturally in a common garden in
Cullowhee, NC. We asked the following questions: 1) Do first flowering
dates show a trend over the 32-year period? 2) Is flowering date related to
spring (February–April) or January temperature? 3) Does responsiveness
differ over the flowering-time gradient from earlier (March)- to later (April)-
season species?
Methods
The common garden is located in Cullowhee, NC (35°20'N, 83°10'W) at
671 m (2200 ft.) elevation. The site is in second-growth Rich Cove Forest
underlain by gneiss with high-magnesium soils. The garden is located in a
narrow ravine; a small stream runs between north- and south-facing slopes.
Flowering data observations began in 1976 and continued yearly through
2008, with the exception of the following years: 1984, 1985, 1989, and 1991.
It is important to note these observations were made and recorded carefully,
but not with the intent of a formal experiment. Although, in general, the garden
was sampled almost daily and an event was recorded if any individual
of a species had opened flowers since the prior sample, observations might
not have been taken every day in all years. Other caveats include: 1) some
plants occurred naturally in the garden area, others were transplanted (we
note these in Table 1); 2) some plants, both naturally occurring and transplanted,
are represented by multiple individuals, others are single plantings;
and 3) some plants occur in different microsites, whereas others, both single
and multiple individuals, occur in one location. We noted or measured plant
location variables that could affect phenology; these included aspect, position
along the slope from the bottom (0) to top (8 m), and whether the species
was represented at one or multiple locations. For species with multiple locations,
we identified the location most often observed for phenology. These
variables were included in the data analyses, but it is not possible to untangle
location and population size/age effects on plant response completely. Other
researchers have noted that flowering plant distributions, population size,
and sampling frequency can confound observations of first flowering dates
(Miller-Rushing et al. 2008).
Mean monthly air temperature, soil temperature, and precipitation data
were obtained for the Cullowhee station (35°19'N, 83°10'W) from the
National Climatic Data Center (NCDC; Asheville, NC) for 1976–2008.
In addition, to better characterize the variation in air and soil-surface
temperatures over the garden during a single season, we deployed 10
thermochron ibutton™ dataloggers on the east-facing ridge and at north-,
east-, and south-facing slope locations. Paired air (10 cm above ground)
840 Southeastern Naturalist Vol. 9, No. 4
and soil-surface ibuttons logged temperature at 30-minute intervals 15
March–25 April, 2009.
Analyses were conducted only for species that could be identified
unambiguously and were observed consistently, with no more than three
consecutive “missing years,” over the 32-year period. The pattern of
temperature and first flowering dates (FDs) over years was examined by
regression. We examined the residuals for autocorrelation over time (e.g.,
Durbin-Watson statistic less than 1). As no significant autocorrelation was found for
any species, we used an ordinary least squares regression model. The relationship
between temperature (spring, January) and FD in each year also was
examined by regression for each species separately and for the average FD
of all species in each year. Spring temperature was computed as the average
for February through May in each year as this constitutes the “spring growing
season” from emergence through end of flowering. January temperature
was examined because previous research has shown plant response to temperature
of months immediately preceding the growing season (Fitter and
Fitter 2002; Miller-Rushing and Primack 2008). To determine if plant location
influenced phenology, we examined the correlation of slope position
and aspect with average flowering date of the species over the observation
period. We tested the relationship between the yearly deviation in FD from
the long-term (30-year) average and the yearly deviation in temperature by
regression. We also examined the relationship of monthly average spring and
January soil temperature, precipitation, and degree days (from the NCDC
data) with FD by regression.
Results
In all, 36 taxa had observational records sufficiently complete for analysis.
No significant relationship was found between the yearly deviation in FD
from the long-term (30-year) average and the yearly deviation in temperature;
we do not report these results. Gaps in the data yielded weak analyses
for the relationship of FD with soil temperature, and no significant relationships
were found with precipitation or degree days; thus, we do not report
these results.
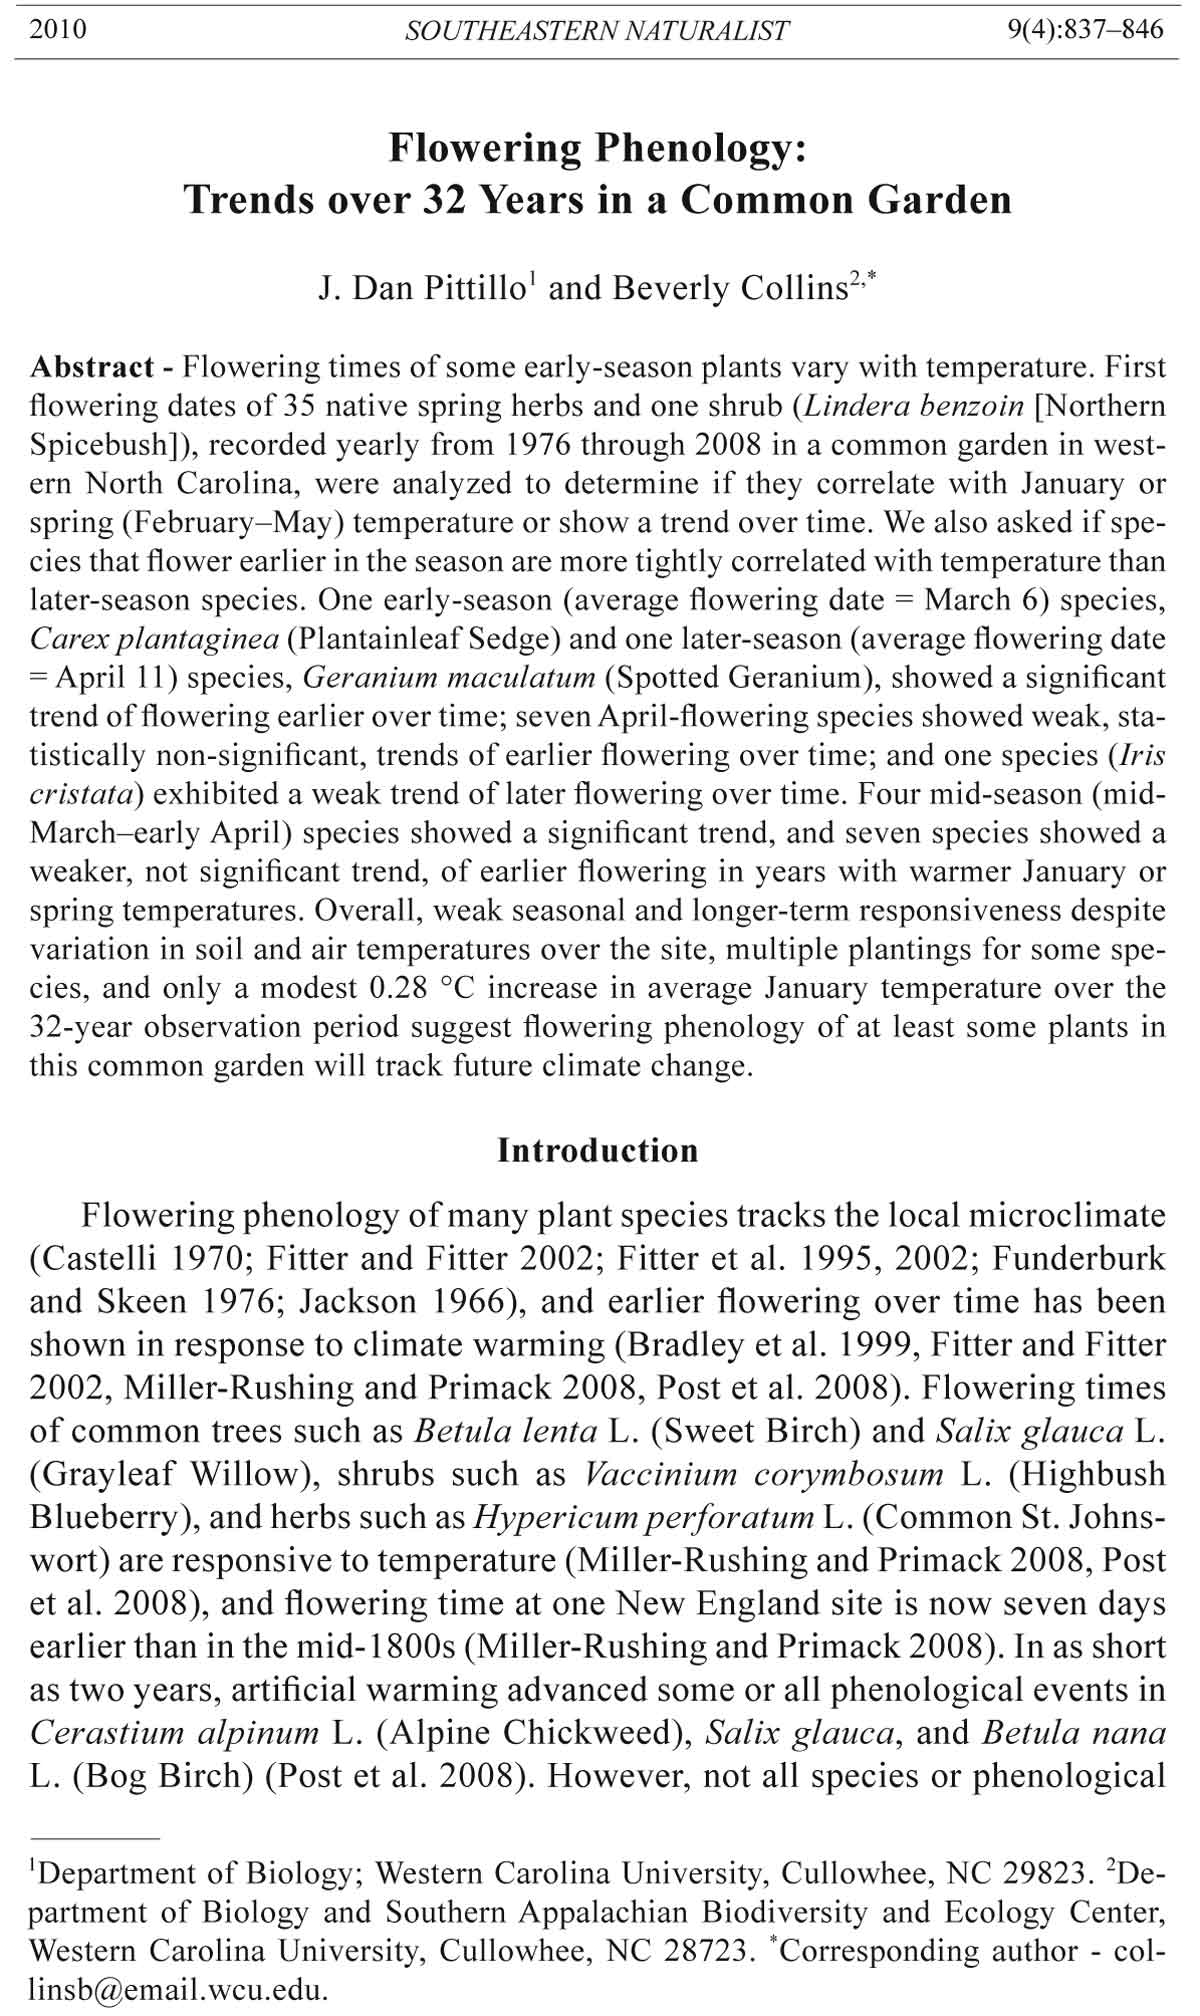
Averaged over all species observed each year, FD varied widely among
years with “early” years (e.g., 1990) and “late” years (e.g., 2004) (Fig. 1),
but showed no relationship with spring temperature (P = 0.19) and only a
weak relationship with January temperature (FD = 105.930 - (10.628 *Tjan);
r2 = 0.11; P = 0.073) (Fig. 1). The average FD over the observation period
also was not correlated with either aspect (Pearson correlation coefficient
= -0.02867, P = 0.88) or slope position (Pearson coefficient = -0.07331,
P = 0.71) of the plant. The temperature results from ibutton dataloggers,
deployed in spring 2009, confirmed little variation in daily mean air or soilsurface
temperatures, which ranged from 10.25 °C to 11 °C over the garden.
However, daily maximum air temperatures did differ among locations (P =
0.05), with higher temperatures on the east-facing ridge (24.5 ± 8.0 °C) and
2010 J.D. Pittillo and B. Collins 841
lower temperatures on the north-facing slope (20.4 ± 5.2 °C). Daily maximum
soil surface temperatures also differed with aspect (P = 0.001), from
the warmer south-facing slope (19.7 + 5.8 °C) to the cooler north-facing
slope (13.5 ± 2.4 °C).
Figure 1. Mean ± standard deviation of first flowering date (FD) for 36 pooled species
each year over a 32-yr sampling period (top graph) and with respect to average
January temperatures (Tjan) (bottom graph). The regression line is: FD = 105.930
- (10.628 *Tjan); r2 = 0.11; P = 0.073).
842 Southeastern Naturalist Vol. 9, No. 4
Table 1. Average flowering date (AFD) over the observation period, regression of yearly flowering date with time, and regression of flowering date with temperature
(st = spring temperature, Jt = January temperature) for 36 taxa. Taxa are noted as transplanted (T) or naturally occurring (N) within the common garden.
Note that Bonferroni-adjusted α36(0.05) = 0.001. NS = no significant trend.
Time Temperature
Species AFD P r2 Equation P r2 Equation
Carex plantaginea Lam., T 3/06 0.0001 0.24 564.8–0.25 (year) NS
Hepatica nobilis Schreb var acuta (Pursh) Steyerm, T 3/06 NS NS
Claytonia caroliniana Michx., T 3/14 NS 0.04 0.21 131.3–5.17(st)
Shortia galacifolia Torr. & A. Gray, T 3/16 NS NS
Cardamine concatenata (Michx.) Sw., N 3/16 NS 0.01 0.22 133–5.21(st)
0.02 0.21 104.4–15.7(Jt)
Ranunculus hispidus (Michx.), T 3/17 NS NS
Lindera benzoin (L.) Blume, N 3/17 NS NS
Thalictrum thalictroides (L.) Eames & B. Boivin, N 3/18 NS 0.0008 0.39 146.1–6.17(st)
Stellaria pubera Michx., N 3/19 NS 0.04 0.17 107.6–15.7(Jt)
Viola sororia Willd., T 3/19 0.03 0.27 1292.6 + year(-0.61) NS
Phlox stolonifera Sims, T 3/19 NS NS
Dicentra cucullaria (L.) Bernh., T 3/22 NS 0.0002 0.52 162.1–7.3(st)
Cymophyllus fraserianus (Ker Gawl.) Kartesz & Gandhi, T 3/23 NS 0.0001 0.48 151.9–6.29(st)
Viola pubescens Aiton, T 3/23 NS 0.003 0.33 170.9–7.94(st)
Trillium cuneatum Raf., T 3/24 NS 0.02 0.28 138.6–5.02(st)
0.05 0.20 114–16.6(Jt)
Phlox divaricata L., T 3/27 NS 0.03 0.18 127–3.72(st)
Viola rostrata Pursh, T 3/28 NS NS
2010 J.D. Pittillo and B. Collins 843
Table 1, continued.
Time Temperature
Species AFD P r2 Equation P r2 Equation
Viola canadensis L., T 3/31 NS 0.0008 0.44 171.1–7.38(st)
Trillium erectum L., T 3/31 NS NS
Dicentra canadensis (Goldie) Walp., T 4/01 NS 0.0099 0.44 163.4–6.56(st)
Mitella diphylla L., T 4/02 NS NS
Trillium luteum (Muhl.) Harbison, T 4/03 0.002 0.22 1326.2 + year(-0.62) NS
Mertensia virginica (L.) Pers. ex Link, T 4/04 0.05 0.17 548 + year(-0.23) NS
Saxifraga careyana A. Gray, T 4/04 NS NS
Thaspium trifoliatum A. Gray, T 4/07 0.01 0.36 1338 + year(-0.62) NS
Cardamine diphylla (Michx.) Alph. Wood, T 4/07 NS NS
Uvularia grandiflora Sm., T 4/09 NS NS
Asarum canadense L., T 4/09 NS NS
Geranium maculatum L., T 4/11 0.0004 0.51 1627 + year (-0.77) NS
Tiarella cordifolia L., T 4/11 NS NS
Delphinium tricorne Michx., T 4/14 0.002 0.42 879.9 + year(-0.39) NS
Trillium rugelii Rendle, N 4/15 0.007 0.34 646 + year(0.-27) NS
Sedum ternatum Michx., T 4/16 NS NS
Saxifraga micranthidifolia (Haw.) Steud., T 4/16 0.04 0.33 654 + year(-0.27) NS
Iris cristata Aiton, T 4/16 0.01 0.37 704.2 + year(0.30) NS
Trillium catesbaei Elliot, N 4/18 NS NS
844 Southeastern Naturalist Vol. 9, No. 4
A significant negative linear relationship between the standard deviation
of FD and mean FD (13.825 - [0.0642 * mean FD]; r2 = 0.15, P = 0.007)
indicates greater variation in FDs of earlier-season compared to later-season
species. Table 1 shows the 36 taxa ordered by mean FD (averaged over the
32 year observation period), which ranged from early March (3/06) to mid-
April (4/18). One of the two earliest-season species, Carex plantaginea,
showed a significant trend of earlier flowering over time, but FD was not related
significantly to either spring or January temperature. One other species
that flowered in March (Viola sororia) showed a weak, nonsignificant trend
of earlier flowering over time. Of the later-season species (1 April or later),
one (Geranium maculatum) showed a significant and reasonably strong (r2 =
0.51) trend of earlier flowering over time; six showed marginally significant,
weak trends of earlier flowering over time; and one (Iris cristata) exhibited
a weak trend of later flowering over time. Flowering dates of none of these
taxa were related significantly to either spring or January temperature. However,
FDs of four taxa that flowered between mid-March and early April
were significantly related, and those of seven other species were weakly
related, to temperature, primarily spring temperature. In all these cases, the
relationship was negative: FD was earlier with warmer temperatures.
Discussion
Despite differences in plant distributions over the garden, population age
and size, and sampling frequency that could have contributed to variation in
first flowering dates (Miller-Rushing et al. 2008), nine of the 36 taxa (25%)
had a detectable trend of earlier flowering over time, although this trend
was statistically significant for only two species (Carex plantaginea and
Geranium maculatum). First flowering dates of an additional 11 taxa (31%)
tended to respond to spring (10 species) or January (3 species) temperatures.
This relationship was statistically significant for four species (Thalictrum
thalictroides, Dicentra cucullaria, Cymophyllus fraserianus, and Viola
canadensis), all of which flowered earlier with warmer spring temperatures.
These results are comparable to other sites, in which the first flowering dates
of 16–75% of species either respond to temperature or have become earlier
over time, but there is wide variation in responsiveness among species, and
a small fraction of species show a trend of later flowering over time (Fitter
and Fitter 2002; Fitter et al. 1995, 2002; Miller-Rushing and Primack 2008;
Willis et al. 2008) If the ibutton temperature results from 2009 are representative
of other years, significant variation over the Cullowhee garden in
daily maximum air and soil-surface spring temperatures likely contributed
to variation in observed FDs, particularly for species planted, and potentially
observed, at multiple locations. Further observations over several years are
planned to determine the finer-scale relationships among flowering dates,
temperatures, and plant location within the garden.
Similar to results from a site in southern central England (Fitter et al.
1995, 2002), FDs of earlier-season species were more variable than those of
2010 J.D. Pittillo and B. Collins 845
later-season species in the Cullowhee garden. However, in contrast to other
studied sites (Fitter and Fitter 2002; Fitter et al. 1995, 2002; Miller-Rushing
and Primack 2008), flowering dates of earlier-season (March-flowering)
species in the Cullowhee garden were not more responsive to temperature
than those of later-season taxa. Only one (Carex plantaginea) of the two
earliest species (Carex plantaginea and Hepatica nobilis var acuta) showed
a trend of earlier flowering over the 32-year observation period, and neither
of these two species had flowering dates related to spring or January
temperature. Rather, the later-season taxa, notably Geranium maculatum,
tended to flower earlier over time, and four of the mid-season (mid March–
early April) taxa showed significantly earlier flowering with warmer
spring temperatures. Our results do, however, agree with the finding that
congeners may differ in responsiveness to temperature (Miller-Rushing
and Primack 2008). In particular, earlier-season Dicentra cucullaria was
more responsive to warm spring temperatures than its later-season congener
D. canadensis, and of three Viola species, only V. canadensis showed a
significant response to temperature.
Overall, relationships between FD of some species and warmer spring
temperatures and detectable trends of earlier flowering over time despite
a modest 0.28 ºC rise in January temperatures over the last 30 years and
variation in factors shown to affect first flowering dates over the site (Miller-
Rushing et al. 2008) suggest flowering phenology in the Cullowhee garden
will track future predicted climate warming. Continued sampling of this site
can help reveal trends among species and will contribute another long-term
dataset needed to decipher climate-change effects on phenology.
Literature Cited
Bradley, N.L., A.C. Leopold, J. Ross, and W. Huffaker. 1999. Phenological changes
reflect climate change in Wisconsin. Proceedings of the Natiional Academy of
Science 96:9701–9704.
Castelli, M.R. 1970. Flowering behavior in a uniform garden of wide-ranging, springblooming,
woodland herbs of the eastern United States. Castanea 35:260–277.
Dahlgren, J.P., H. von Zeipel, and J. Ehrlen. 2007. Variation in vegetative and flowering
phenology in a forest herb caused by environmental heterogeneity. American
Journal of Botany 94:1570–1576.
Fitter, A.H., and R.S.R. Fitter. 2002. Rapid changes in flowering time in British
plants. Science 296:1689–1691.
Fitter, A.H., R.S.R. Fitter, I.T.B. Harris, and M.H. Williamson. 1995. Relationships
between first flowering date and temperature in the flora of a locality in central
England. Functional Ecology 9:55–60.
Fitter, A.H., R.S.R. Fitter, I.T.B. Harris, and M.H. Williamson. 2002. Erratum: Relationships
between first flowering date and temperature in the flora of a locality in
central England. Functional Ecology 16:543.
Funderburk, D.O., and J.N. Skeen. 1976. Spring phenology in a mature piedmont
forest. Castanea 41:20–30.
Jackson, M.T. 1966. Effects of microclimate on spring flowering phenology. Ecology
47:407–415.
846 Southeastern Naturalist Vol. 9, No. 4
Karl, T.R., J.M. Melillo, and T.C. Peterson. 2009. Global Climate Change Impacts in
the United States. Cambridge University Press, New York, NY.
Kudo, G., T. IDA, and T. Tani. 2008. Linkages bertween phenology, pollination,
photosynthesis, and reproduction in deciduous forest understory plants. Ecology
89:321–331.
Miller-Rushing, A.J., and R.B. Primack. 2008. Global warming and flowering times
in Thoreau's Concord: A community perspective. Ecology 89:332–341.
Miller-Rushing, A.J., D.W. Inouye, and R.B. Primack. 2008. How well do first flowering
dates measure plant responses to climate change? The effects of population
size and sampling frequency. Journal of Ecology 96:1289–1296.
Parmesan, C. 2007. Influences of species, latitudes, and methodologies on estimates
of phenological response to global warming. Global Change Biology
13:1860–1872.
Post, E.S., and D.W. Inouye. 2008. Phenology: Response, driver, and integrator.
Ecology 89:319–320.
Post, E.S., C. Pedersen, C.C. Wilmers, and M.C. Forchhammer. 2008. Phenological
sequences reveal aggregate life-history response to climatic warming. Ecology
89:363–370.
Sparling, J.H. 1967. Assimilation rates of some woodland herbs in Ontario. Botanical
Gazette 128:160–168.
Willis, C.G., B. Ruhfel, R.B. Primack, A.J. Miller-Rushing, and C.C. Davis. 2008.
Phylogenetic patterns of species loss in Thoreau’s woods are driven by climate
change. Proceedings of the National Acadademy of Science 105(44):17029–
17033.


 The Southeastern Naturalist is a peer-reviewed journal that covers all aspects of natural history within the southeastern United States. We welcome research articles, summary review papers, and observational notes.