Southeastern Naturalist
E.A. Rigby and D.A. Haukos
2014
26
Vol. 13, Special Issue 5
A Matrix Population Model for Mottled Ducks
(Anas fulvigula) of the Western Gulf Coast
Elizabeth A. Rigby1,* and David A. Haukos2,3
Abstract - According to three surveys performed annually since the mid-late 1980s, the Anas
fulvigula (Mottled Duck) population in Texas has declined substantially. Factors contributing
to the observed trend are not well understood. Assessing the relative influence of vital rates
on the population growth-rate is necessary to make management and conservation decisions
regarding Mottled Ducks. We gathered estimates and associated variance estimates for vital
rates of Mottled Ducks on the western Gulf Coast. We constructed a matrix population-model
based on female vital rates and assumed birth-pulse reproduction, and parameterized it with
a pre-breeding census. We calculated mean and standard error estimates for composite vital
rates such as population growth rate (λ), fertility, and recruitment using 1000 iterations of
the model. We also performed 20 meta-iterations of the population model to obtain mean
coefficient of determination (r2) values for the linear regression of each vital rate and composite
rates on λ. Overall λ was low, 0.541 (SE = 0.070). Fertility was also low, F = 0.071 (SE
= 0.058). The elasticity analysis suggested that proportional changes in both fertility (r2 =
0.675) and survival (r2 = 0.322) played major roles in explaining the variation in λ. For the vital
rates comprising F, breeding incidence (r2 = 0.270) and nest success (r2 = 0.200) explained
the most variation in λ. Results indicated that the Mottled Duck population is in a steep
decline, with low fertility and annual survival both influencing annual growth. We suggest
targeting management efforts towards increasing adult survival, breeding incidence, and nest
success for Mottled Ducks on the western Gulf Coast.
Introduction
Anas fulvigula Ridgway (Mottled Duck), a non-migratory dabbling duck species,
is found along the western Gulf of Mexico coast from Veracruz, Mexico, to
Alabama, as well as peninsular Florida (Bielefeld et al. 2010). Genetic evidence
suggests that the species is made up of 2 genetically distinct populations: one on
the western Gulf Coast (WGC; which includes Mexico, Texas, Louisiana, Alabama,
and Mississippi) and one in Florida (McCracken et al. 2001, Williams et al. 2005).
In addition to genetic separation, the Florida and the WGC populations of Mottled
Ducks occupy disparate habitats and are separated by the boundaries of state and
federal agencies (Bielefeld et al. 2010). The core of the WGC population resides in
coastal marshes and associated habitats of the Chenier Plain of Texas and Louisiana,
including agricultural lands used for rice cultivation (Haukos 2010).
Johnson (2009) analyzed band-recovery data and hunter-returned age-ratio data
from 1994–2006 to estimate finite annual growth rates (λ) based on annual fertility
1University of Minnesota, 135 Skok Hall, 2003 Uppper Buford Circle, St. Paul, MN 55108.
2USFWS, Department of Natural Resources Management, Texas Tech University, Box
42125, Lubbock, TX 79409-2125. 3Current address - Kansas State University, 205 Leasure
Hall, Manahattan, KS 66506. *Corresponding author - elizabethrigby@gmail.com.
Manuscript Editor: Clifford Shackelford
Proceedings of the 5th Big Thicket Science Conference: Changing Landscapes and Changing Climate
2014 Southeastern Naturalist 13(Special Issue 5):26–40
Southeastern Naturalist
27
E.A. Rigby and D.A. Haukos
2014 Vol. 13, Special Issue 5
and survival estimates for Mottled Ducks. He found λ was considerably less than
1 for all age-sex cohorts for all environmental conditions during that time period
(male geometric mean λ = 0.85 (range: 0.65–1.15), female geometric mean λ = 0.79
(range: 0.49–1.16)) (Johnson 2009). He concluded that the species was undergoing
a dramatic population decline on the western Gulf Coast (Johnson 2009). However,
Johnson (2009) used age-ratio in the harvest as an index to annual fertility and was
therefore unable to evaluate the relative influence on λ of vital rates comprising
fertility. He concluded that the survey that best reflects population trends of WGC
Mottled Ducks in Texas is the breeding pair survey on national wildlife refuges
(NWRs) conducted annually since 1985.
The debate regarding WGC Mottled Duck population status is contentious:
although several surveys are conducted annually, most data have been collected
regionally. A range-wide annual breeding survey was established in 2010 and
currently lacks sufficient data to estimate trends or document population change.
The annual breeding-pair survey on Texas NWRs has been conducted since 1985
and consists of aerial counts adjusted with a visibility index derived from ground
surveys (Haukos 2010). These data indicate a population peak for Mottled Ducks
in the mid-1990s and a substantial decline since. The 2012 breeding pair survey
estimated 1.04 Mottled Duck pairs/km2, which represents a decline of 65% from
the 26-year long-term average of 3.38 pairs/km2 (USFWS 2013). This population
decline in Texas is corroborated by other annual surveys. Texas NWRs also
conduct aerial monthly winter surveys. The cumulative count for monthly surveys
in winter 2006–2007 (the last reported survey season) was 6879—33% below the
22-year long-term average of 10,295 (USFWS 2013). Midwinter inventory (MWI)
surveys count Mottled Ducks in both Texas and Louisiana and include areas outside
of NWRs. The Texas MWI estimated 18,096 Mottled Ducks in surveyed coastal
areas in 2012 (USFWS 2013). This represents a 62% decline from 1994 and a 30%
decline from the 28-year long-term average, paralleling the NWR breeding pair
survey (USFWS 2013). MWI trends in Louisiana have been flat or increasing, with
a 0.8% annual increase as compared to a 2.7% annual decrease in Texas over the
long term (USFWS 2013).
Annual surveys only provide an index to Mottled Duck populations, and estimates
of the entire WGC population vary widely, from 169,300 (Stutzenbaker
1988) to 630,000 (North American Waterfowl Management Plan 2004). Two intensive
surveys have attempted to estimate the entire population. Ballard et al. (2001)
estimated 220,000 (SE ≈ 52,500) Mottled Ducks in Texas during 1994–1995 using
aerial circling surveys of a stratified sample of wetlands along the Texas Gulf Coast.
This estimate likely represents a peak population, as it was conducted during the
years when the Mottled Duck population peaked according to annual index surveys
(Haukos 2010). An experimental range-wide survey was conducted in 2009–2012
using airplane surveys adjusted with a visibility correction factor derived from
helicopter surveys on a subset of transects (USFWS 2013). In 2012, this survey
estimated 164,745 (SE = 32,227) Mottled Ducks in Texas and Louisiana and 65,830
(SE = 24,382) in Texas alone.
Southeastern Naturalist
E.A. Rigby and D.A. Haukos
2014
28
Vol. 13, Special Issue 5
Because Mottled Ducks are non-migratory, birds in the WGC population are
limited to coastal wetlands and associated habitats for their entire life cycle. Gulf
Coast wetlands are increasingly threatened by both anthropogenic and natural processes.
Wetland area in Texas and Louisiana has declined more than 51% over the
last 2 centuries (Dahl 1990). Threats to Gulf Coast wetlands include subsidence
(White and Tremblay 1995), sea-level rise and related saltwater intrusion (Salinas
et al. 1986), natural and human-caused shoreline erosion and river-sediment
diversion (Esslinger and Wilson 2001), urbanization and real estate development
(Morton and Paine 1990), and a decrease in rice agriculture (Esslinger and Wilson
2001). Other environmental and anthropogenic factors impacting the WGC Mottled
Duck population include (1) loss or degradation of reproductive habitats (e.g., pair
ponds, suitable nesting cover, and brood-rearing habitats); (2) loss and degradation
of nonbreeding habitats (i.e., winter, molt); (3) reduction of ecological disturbance
(e.g., cattle- and goose-grazing or prescribed burning), (4) redistribution of populations
(i.e., from Texas to Louisiana; Haukos 2010); and (5) continued exposure
to lead from spent shot shells (Merendino et al. 2005). Because of concern for the
status and future of Mottled Ducks, the US Fish and Wildlife Service (USFWS)
declared the species a primary species in the Migratory Bird Program Focal Species
Strategy (USFWS 2013). As threats to coastal wetlands increase, managers must
set priorities and make land management decisions that will affect coastal species
like Mottled Ducks without a complete understanding of the species’ population
dynamics (e.g., GCJV 2007).
Decisions regarding conservation of Mottled Ducks on the western Gulf Coast
would be greatly aided by a population demography model. Such a model would
allow an analysis of the effects of various vital rates on the population growth rate
and indicate where management resources should be allocated. Information from
this model could also inform hypotheses about Mottled Duck ecology, population
dynamics, and management. Our objective was to construct a population demography
model for Mottled Ducks on the western Gulf Coast and analyze the relative
effect of the individual vital rates on population growth.
Study Area
On the western Gulf Coast, Mottled Ducks inhabit a narrow strip of coastal
marsh habitat from northeast Mexico to Alabama, with densities highest in Texas
and Louisiana (Bielefeld et al. 2010). Coastal marsh habitats are categorized based
on salinity level as saline marsh, brackish marsh, intermediate marsh, and fresh
marsh (Stutzenbaker 1999). Mottled Ducks tend to avoid saline marsh (salinity ≥10
ppt) but use all other marsh types (Haukos et al. 2010, USFWS 2006). Remaining
coastal prairie and some agricultural lands adjacent to coastal marshes, particularly
intermittently flooded rice fields and cattle pastures, are also valuable habitats
(Stutzenbaker 1988). Functional Gulf Coast marshes can be considered as highdisturbance
environments historically affected by hurricanes, fire, flood, drought,
grazing, and vegetation eat-outs by Ondatra zibethicus (L.) (Muskrat) and large
(>100,000) flocks of wintering geese (Bhattacharjee et al. 2007, USFWS 2005).
Southeastern Naturalist
29
E.A. Rigby and D.A. Haukos
2014 Vol. 13, Special Issue 5
The climate within Mottled Ducks’ WGC range is humid-subtropical, with annual
precipitation of 107–165 cm (Ning and Abdollahi 2003).
Methods
Model parameterization
We gathered vital-rate estimates and corresponding variance estimates for
Mottled Ducks on the western Gulf Coast from published articles, academic theses,
and reports from state and federal agencies (Table 1). Although we prioritized peerreviewed
articles, a great deal of Mottled Duck research has never been published
in scientific journals. We included information from gray literature to fully populate
the model with vital rates that otherwise would have been unavailable. We prioritized
post-1990 vital-rate estimates over older rates because they were more likely
to reflect current conditions.
Recent annual age- and sex-specific survival has been estimated from recovery
data from Mottled Duck banding efforts in Louisiana (1994–2010) and Texas
(1997–2010) (Haukos 2010, Johnson 2009). Survival estimates based on banding
from 1962–1977 are also available (Stutzenbaker 1988), but these estimates
likely do not represent current conditions and thus were not included in the model.
Although seasonal adult survival rates are known to differ for Mottled Ducks in
Florida (Bielefeld and Cox 2006), differential seasonal survival rates are currently
unavailable for Mottled Ducks on the western Gulf Coast. Breeding season-specific
Table 1. Vital rates of Mottled Ducks on the western Gulf Coast, extracted from existing literature.
Rates include: BI = breeding incidence, CS = clutch size, H = hatchability, NS = nest success, DS1
= duckling survival (days 1–2), DS2 = duckling survival (days 3–30), JS = juvenile survival (days
31–365), RP = renesting effort, and S = annual female survival. Process variance (σprocess; White 2000)
was calculated for vital rates for which >2 estimates were available (BI, CS, NS). Variation for all
other vital rates (H, DS1, DS2, JS, RP, S) is reported as a standard error (SE). We estimated SE for H
and RP vital rates using the binomial distribution (Snedecor and Cochran 1968:207); reported SE for
H is a weighted average of estimates.
Vital rate Mean σprocess or SE Sources
BI 0.420 0.214 Finger et al. 2003, Rigby and Haukos 2012
CS 9.214 0.583 Johnson et al. 2002, Finger et al. 2003, Durham and Afton
2006
H 0.947 0.0106 Finger et al. 2003, Stutzenbaker 1988
NS 0.158 0.0758 Durham and Afton 2003, Finger et al. 2003A, Holbrook et al.
2000, Walters et al. 2001
DS1
B 0.612 0.0731 Baker 1983
DS2
B 0.687 0.183 Rigby 2008
JSB 0.402 0.0299 Haukos 2010, Johnson 2009
RPC 0.567 0.0077 Arnold et al. 2010
S 0.47 0.04 Haukos 2010, Johnson 2009
AApparent nest success in Finger et al. (2003) transformed to approximate Mayfield nest success
(Green 1989, Johnson 1991).
BSurvival and SE estimates transformed using the delta method (Powell 2007, 2012) to reflect temporal
scale necessary for the model.
CRenesting effort estimate unavailable for Mottled Ducks; estimate for Mallards used instead.
Southeastern Naturalist
E.A. Rigby and D.A. Haukos
2014
30
Vol. 13, Special Issue 5
survival has been estimated for females in 2 studies (Finger et al. 2003, Rigby and
Haukos 2012) but without information from other seasons, we were not able to
partition survival seasonally.
We modeled Mottled Duck reproduction using estimates of nest success (NS;
Durham and Afton 2003, Finger et al. 2003, Holbrook et al. 2000, Walters et al.
2001), breeding incidence (BI; Finger et al. 2003, Rigby and Haukos 2012), clutch
size (CS; Durham and Afton 2006, Finger et al. 2003, Johnson et al. 2002) and
hatchability (H; Finger et al. 2003, Stutzenbaker 1988) (Table 1). NS estimates
were calculated using Mayfield’s (1961) methods or transformed to approximate
Mayfield estimates (Green 1989, Johnson 1991). Earlier nest-success estimates are
also available (Baker 1983, Engeling 1950, Singleton 1953, Stutzenbaker 1988),
but these estimates likely do not represent current conditions and thus were not
included in the model.
Renesting effort (RP) has not been quantified for Mottled Ducks on the western
Gulf Coast, but Mottled Ducks are considered “determined renesters”, and renesting
is “commonplace” (Stutzenbaker 1988: 84–85). To approximate RP for Mottled
Ducks, we used an RP estimate for Anas platyrhynchos L. (Mallards), which are
described as “persistent renesters” (Table 1; Arnold et al. 2010:212). BI is difficult
to estimate, because many radio telemetry studies catch females on the nest and
thus only follow nesting females. Rigby and Haukos (2012) and Finger et al. (2003)
estimated BI for females caught in swim-in traps, decoy traps, and rocket nets, but
both studies were hampered by the possibility that they had not found all nests.
Still, their estimates are the most accurate available for Mott led Duck BI.
Annual (S) and juvenile (JS) survival were estimated using band-recovery data
and Brownie models in Program MARK (Table 1; Haukos 2010, Johnson 2009).
JS in our model represented survival of juvenile females for 335 days only; we
transformed the reported annual survival and variance estimates into 335-day estimates
using the delta method (Powell 2007, 2012). Duckling survival (DS) was
estimated from hatch to 30 days, a standard estimation after which juvenile survival
is considered appropriate (Rotella and Ratti 1992). Due to the properties of the
available data (Table 1), we split DS into 2 components: DS1 (days 1–2) and DS2
(days 3–30). DS2 was parameterized with data from Rigby (2008) and transformed
to a 28-day survival estimate using the delta method (Powell 2007, 2012). We were
unable to include duckling survival estimates from a similar study (Finger et al.
2003) because the authors did not report sample size for ducklings (necessary to
calculate process variance), and they did not report daily duckling survival rates for
2 of 3 years (though survival in those years was known to be low). Because Rigby
(2008) did not catch ducklings at the nest, and travel from the nest to brood habitat
is considered a time of especially high risk to ducklings (Arnold et al. 2010), we
added DS1 to the model to more fully capture mortality risk from hatch to 30 days.
We estimated DS1 using data from Baker (1983), who followed broods from the
nest. We used those brood observations to estimate daily duckling survival during
the 2–day period in program MARK using the known-fate procedure (White and
Burnham 1999) and transformed it to a 2-day survival estimate (DS1) using the
delta method (Powell 2007, 2012).
Southeastern Naturalist
31
E.A. Rigby and D.A. Haukos
2014 Vol. 13, Special Issue 5
We calculated process variance (White 2000) for vital rates for which >2 estimates
were available. When possible, years within a study were considered as discrete
parameter estimates for process variance calculation. We estimated variance
for H and RP vital rates using the binomial distribution (Snedecor and Cochran
1968:207). Because 2 estimates were available for H, we calculated SE as the
square root of the weighted average of variance estimates for H.
Model structure
We constructed a matrix population model based on female vital rates, as male
influence on Mottled Duck fertility is unknown. We parameterized the model
with a pre-breeding census and assumed birth-pulse reproduction (Caswell 2001).
Overall model structure and estimation of fertility were similar to Koons et al.
(2006). We considered the start of the breeding season to be 1 March (Baker 1983,
Durham and Afton 2006, Johnson et al. 2002). We used 2 age classes: second-year
females (SY, age = 1 year) and after-second-year females (ASY, age ≥ 2 years).
We defined fertility as the average number of female offspring produced per female,
per year (Caswell 2001), and assumed it to be similar between age classes.
Mottled Duck females are reproductively active at 1 year of age (Stutzenbaker
1988), and no information is available regarding differential reproduction in females
based on age. The matrix model (A) was
A =
FSY FASY
SSY SASY
where Fi = fertility of age class i, and Si = survival of age class i (Fig. 1). In practice,
there are no data differentiating Mottled Duck fertility or survival between
age classes, so we assumed FSY = FASY and SSY = SASY. Fertility (F) was modeled as:
F = 0.5 × BI × [CS × H × NS + (1 - NS) × RP × CS × H × NS] × DS1 × DS2 × JS,
where F = fertility, BI = breeding incidence, CS = clutch size, H = hatchability, NS
= nest success, RP = renesting effort, DS1 = duckling survival (days 1–2), DS2 =
duckling survival (days 3–30), and JS = juvenile survival (days 31–365). The 0.5
value comes from an assumption that half of offspring are female (i.e., a 1:1 sex
ratio among eggs [Koons et al. 2006]).
We chose a starting Mottled Duck population of 200,000 at t = 0, which is greater
than a recent estimate (USFWS 2013) but less than an earlier estimate (Ballard
et al. 2001). Because there is debate about Mottled Duck population size, we also
tested starting population values of 100,000 and 630,000 with 10 meta-iterations
of the model (using the same vital rate and process variance estimates). Differing
starting values did not affect estimates of λ, and population values (such as N1,
the female population in year 1) changed in proportion to the change in starting
value. Hereafter we report results only for a population of 200,000 at t = 0. We also
assumed a 1:1 sex ratio, resulting in an estimate of N0 = 100,000 female Mottled
Ducks. We estimated the age structure of the female Mottled Duck population at
Southeastern Naturalist
E.A. Rigby and D.A. Haukos
2014
32
Vol. 13, Special Issue 5
time t = 0 (N0, SY = 48,690, N0, ASY = 51,310) using an existing estimate of the age
ratio of juvenile to adult females (0.9491: Johnson 2009).
We described the female Mottled Duck population in year 1 as N1 = N0*A, and
the population growth rate (λ) as λ = N1/N0. We ran 1000 iterations of the population
matrix model in Excel (Microsoft, Redmond, WA). All vital rates were parameterized
to include variation. To estimate CS1, we calculated the inverse of the normal
cumulative distribution parameterized by the mean (C̅S̅) and the process variance
(σprocess CS) with probability between 0 and 1 determined by a random number generator
(= NORMINV[RAND(),C̅S̅, σprocess CS]). For all vital rates that are logically
bounded by 0 and 1 (H, NS, RP, DS1, DS2, JS, SSY, SASY), we estimated the rate in
year 1 (x1) by calculating the inverse of the cumulative beta distribution parameterized
by α and β with probability between 0 and 1 determined by a random number
generator, where α = x̅[x̅([1 - x̅]/σprocess
2) - 1] and β = (1 - x̅)([x̅(1 - x̅)/σprocess
2] - 1)
(= BETAINV[RAND(),α, β]).
Beta distribution estimates were thus constrained by 0 and 1, preventing nonsensical
results (for example, negative survival). We also estimated Mottled Duck
recruitment for comparison to other studies. We defined recruitment (R) as the
number of female offspring produced per adult female that survive to 30 days after
hatch (R = F/JS).
For all estimates for which process variance was unavailable (Table 1), we used
the standard error of the estimate as σ. We calculated the mean and standard error
for all composite rates (λ, N1, N1 SY, N1 ASY, F, R) across the 1000 iterations. We
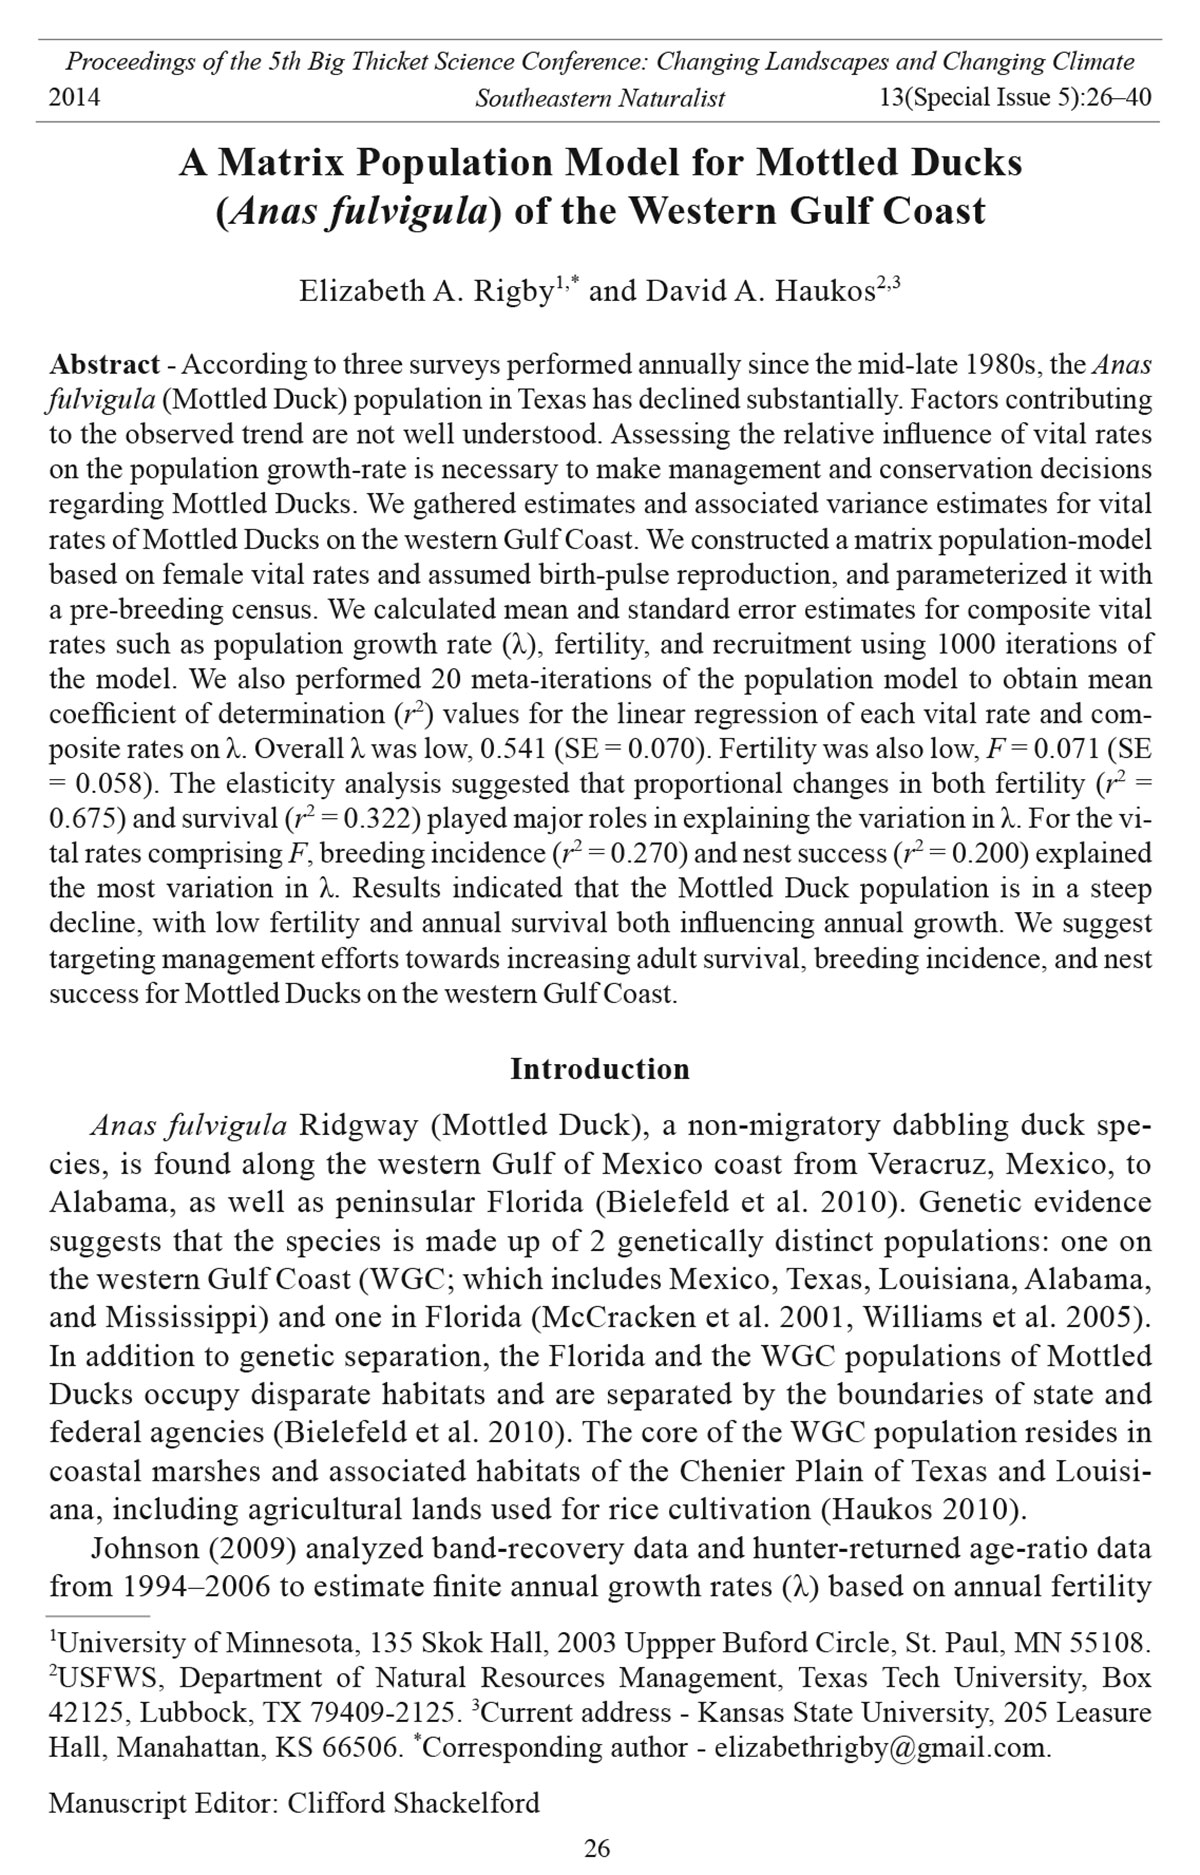
Figure 1. Model used to describe population dynamics of Mottled Ducks on the western
Gulf Coast, where F = fertility and S = survival. Mottled Ducks were classified by age
class: SY = second year, ASY = after second year. The model was parameterized with a prebreeding
census on 1 March and assumed birth-pulse reproduction (Caswell 2001).
Southeastern Naturalist
33
E.A. Rigby and D.A. Haukos
2014 Vol. 13, Special Issue 5
performed 20 meta-iterations of the population model to obtain mean coefficient of
determination (r2) values for the linear regression of each vital rate and each composite
rate on λ. Elasticity, defined as the proportional change in λ with proportional
changes in life-stage parameters (Caswell 1989), is closely related to r2. By assuming
a linear relationship between vital rates and λ, r2 is approximated by r2 = s i
2
*[variance of the vital rate / variance of λ], where si = the sensitivity of λ to changes
in the vital rate (Wisdom and Mills 1997). Thus, r2 approximates the behavior of
elasticity, and the vital rate with the greatest effect on λ will have the greatest r2
value and the greatest mean elasticity (Wisdom and Mills 1997).
Results
Our estimated average population growth rate for Mottled Ducks was low, λ =
0.541 (SE = 0.070; Table 2), where λ = 1 indicates a stable population and λ < 1
indicates population decline. The average estimated female Mottled Duck population
in year 1 was N 1 = 54,093 (SE = 7019), reduced from N0 by almost half.
Fertility and recruitment were low and variable, F = 0.071 (SE = 0.058) and R =
0.176 (SE = 0.143). One-year old females (N1 SY) only made up 13% of the female
portion of the population in year 1.
The elasticity analysis suggested that variation in F (r2 = 0.675) primarily explained
the variation in λ (Table 3, Fig. 2), though S (r2 = 0.322) also explained a
substantial amount of variation. For the vital rates that comprised F, BI (r2 = 0.270)
and NS (r2 = 0.200) explained the most variation in λ (Table 3, Fig. 3). DS1 (r2 =
0.0187), and DS2 (r2 = 0.0754) explained more variation in λ than JS (r2 = 0.00616)
Table 2. Composite vital rates were estimated for female Mottled Ducks on the western Gulf Coast.
Rates were calculated via 1000 iterations of the matrix population model. Summary statistics (mean,
standard error (SE), minimum, and maximum) represent average rates calculated across 20 meta-iterations
of the model. F = fertility; N1 SY = female population age =1, year 1; N1 ASY = female population age
≥ 2 , year 1; N1 = total female population, year 1; λ = population growth rate; R= recruitment.
F N1 SY N1 ASY N1 λ R
Mean 0.0707 7066 47,027 54,093 0.541 0.176
SE 0.0578 5780 4000 7019 0.0702 0.143
Minimum 0.000959 96 34,393 37,144 0.371 0.00231
Maximum 0.419 41,852 59,764 91,118 0.911 1.010
Table 3. Coefficient of determination (r2) values between vital rates and the population growth rate
(λ) for Mottled Ducks on the western Gulf Coast. Mean r2 and standard error estimates were produced
from 20 meta-iterations of the population model. Vital rates are: F = fertility, S = annual adult female
survival, BI = breeding incidence, NS = nest success, JS = juvenile survival (days 31–365), CS =
clutch size, DS1 = duckling survival (days 1–2), DS2 = duckling survival (days 3–30), H = hatchability,
and RP = renesting effort.
F S BI NS JS CS DS1 DS2 H RP
r2 0.675 0.322 0.270 0.200 0.00616 0.00342 0.0187 0.0754 0.00099 0.00098
SE 0.0219 0.0243 0.0265 0.0343 0.00368 0.00283 0.00713 0.0112 0.00118 0.00126
Southeastern Naturalist
E.A. Rigby and D.A. Haukos
2014
34
Vol. 13, Special Issue 5
(Table 3, Fig. 3). None of the remaining vital rates (H, CS, RP) used to estimate F
explained much of the variation in λ (Table 3, Fig. 3).
Discussion
Our estimated population growth rate (mean λ = 0.541) for WGC Mottled
Ducks was well below the rate necessary to maintain a stable population (λ = 1).
This finding supports annual surveys that indicate WGC Mottled Duck populations
have declined since the mid-1990s (Haukos 2010, USFWS 2013). For comparison,
Johnson (2009) found the geometric mean of λ for female Mottled Ducks was 0.79
(range = 0.49–1.16). The difference in λ estimates between studies is due to the
difference in fertility estimation—Johnson (2009) used age ratios derived from
hunter-killed wings as an index to fertility, whereas we used vital rate estimates.
For Mallards in eastern Canada, Hoekman et al. (2006) reported λ for 5 sites: one
site had λ = 0.50, all others had 0.87 ≤ λ ≤ 1.05. Hoekman et al. (2002) found λ =
0.824 for mean parameter values of mid-continent Mallards.
Recruitment was very low (R = 0.176) compared to other species (e.g., R > 0.79
for Mallards at 4 of 5 sites in eastern Canada; Hoekman et al. 2006). Rigby (2008)
estimated that a recruitment rate of R = 0.91 was necessary to maintain population
stability for WGC Mottled Ducks; less than 0.2% of simulated recruitment estimates
were ≥0.91.
Variation in fertility contributed 67.5% of the variation in λ. The relative importance
of variation in survival and fertility in affecting variation in λ differed slightly
from Johnson (2009), who found survival contributed 59.4% of the variation in
λ for female Mottled Ducks and fertility contributed 40.6%. Our extremely low
Figure 2. Linear regression of survival (S) and fertility (F) on population growth rate (λ)
of Mottled Ducks on the western Gulf Coast for 1 meta-iteration of the model. Due to the
nature of the matrix model, exact values of S, F, and λ change for every meta-iteration. F explained
67% of the variation in λ and S explained 32% (mean values for 20 meta-iterations
of the model (Table 3).
Southeastern Naturalist
35
E.A. Rigby and D.A. Haukos
2014 Vol. 13, Special Issue 5
fertility estimate (F = 0.0707) suggests that the decline in the Mottled Duck population
is in large part due to a low average annual rate of reproduction. The variation
in vital rates occasionally resulted in simulated excellent years with high F; the
Figure 3. Linear regression
of components
of fertility (F)
on population growth
rate (λ) of Mottled
Ducks on the western
Gulf Coast for
1 meta-iteration of
the model, arranged
in descending value
of r
2: breeding incidence
(BI), nest success
(NS), duckling
survival for days
3–30 (DS2), duckling
survival for
days 1–2 (DS1), juvenile
survival (JS),
clutch size (CS),
hatchability (H),
and renesting effort
(RP). All vital rates
were parameterized
to include variation,
causing exact values
for each parameter
to change for every
meta-iteration of the
model. R
2 values
listed here are mean
values for multiple
iterations (Table 3).
BI explained 27%
of the variation in λ;
NS explained 20%.
JS, CS, H, and RP
each explained <1%
of variation in λ.
Southeastern Naturalist
E.A. Rigby and D.A. Haukos
2014
36
Vol. 13, Special Issue 5
highest value across 20,000 iterations was F = 0.587. These years were rare, however,
and less than 1% of simulated years had F > 0.3. Within the current estimated
range for Mottled Duck vital rates, years with fertility at a rate that would maintain
a stable population (given current estimates of adult survival) occur too rarely to
maintain current population size.
Within fertility, nest success and breeding incidence had the greatest effects on
variation in λ (Table 3), indicating that increases in these vital rates would likely
have the greatest positive effect on population growth. Variation in λ due to duckling
survival may be artificially low due to our inability to include data from Finger
et al. (2003). Further research into the true range of duckling survival on the western
Gulf Coast would improve the accuracy of this model. Average nest success for
Mottled Ducks may appear low (NS = 0.158), but low nest success is frequently
found for many waterfowl species. For example, Greenwood et al. (1995) found
nest success varied from 7–17% for 5 species across 4 years. Breeding incidence,
however, is often assumed to equal or approach 1 in waterfowl population dynamics
(Mauser and Jarvis 1994), but BI was only 0.420 for WGC Mottled Ducks. BI
does appear to approach 1 for Mallards (BI = 0.968 [SE = 0.040] across n = 11
studies [Hoekman et al. 2002]; BI = 0.951 [SE = 0.034] to BI = 0.980 [SE = 0.020]
[Hoekman et al. 2006], BI = 0.84 [SD = 0.08] [Coluccy et al. 2008]), but is more
widely varied in other species, particularly diving ducks: e.g., Aythya affinis (Eyton)
(Lesser Scaup) BI=0.11 (95% CI = 0.05–0.24) – 0.68 (SE = 0.08) for different
estimation methods (Martin et al. 2009), Aythya valisineria (Wilson) (Canvasback)
BI = 0.54–0.94 for juveniles, and BI = 0.74–0.95 for adults (Anderson et al. 2001),
and 68.9% of Oxyura jamaicens (Gmelin) (Ruddy Duck) spring-harvested females
showed signs of breeding (Alisauskas and Ankney 1994). However, breeding incidence
was also well below 1 for Mottled Ducks in Florida: 25%–56% among years
(Varner et al. 2013). Nest success in that study was high (28%), which appeared to
offset low breeding incidence: Varner et al. (2013) did not explicitly calculate λ, but
density estimates in Florida show a weakly increasing trend (Bielefeld et al. 2010).
This balance between breeding incidence and nest success does not appear to occur
on the WGC, where both vital rates are low and population declines are evident in
Texas (Haukos 2010, USFWS 2013).
Variation in survival was responsible for 32.2% of the variation in λ, indicating
that maximizing survival of adults via management could have a positive effect
on population growth. For band-recovery analyses, the highest ranked model for
survival included the interaction of age, sex, and year, indicating that Mottled
Duck survival varies temporally (Haukos 2010). For the 1997–2008 banding years,
Haukos (2010) estimated annual survival rates were 0.27–0.69 for adult females
and 0.17–0.68 for juvenile females, with averages of 0.47 for adults and 0.37 for
juveniles. Stutzenbaker (1988) reported results of survival estimation for banding
efforts during the late 1960s, but due to sample size did not differentiate sex, only
age. His estimate of annual survival was 0.701 for adults and 0.443 for juveniles,
which indicates a more drastic decline in adult survival than juvenile survival. If
Mottled Duck survival again reached levels seen in the 1960s, population growth
could increase beyond the range estimated by our model.
Southeastern Naturalist
37
E.A. Rigby and D.A. Haukos
2014 Vol. 13, Special Issue 5
Management Implications
We recommend that management efforts target increasing 3 vital rates for WGC
Mottled Ducks: adult survival, nest success, and breeding incidence. There was
enough variation in these rates that substantial increases in λ could result from improving
these statistics within their current range. Additionally, historical rates for
adult survival (Stutzenbaker 1988) indicate that increases in this rate are possible
beyond the range used in this model, which would increase λ beyond the range estimated
here. Daily bag limit for Mottled Ducks in Louisiana was reduced from 3
to 1 in 2009 (Louisiana Department of Fisheries and Wildlife 2012, USFWS 2013),
but it is not yet known if this change has affected adult survival rates. Daily bag
limit for Mottled Ducks in Texas has not exceeded 1 since 1985 (USFWS 2013).
We suggest that improvement of nesting habitat quality is the best course
of action to increase Mottled Duck fertility, though over-riding environmental
factors that dictate breeding incidence are not fully understood and deserve further
research. Improving nesting habitat quality includes managing for optimal
Mottled Duck nesting habitat (coastal prairies that include heavy grass cover,
particularly native Spartina spp. [cordgrasses] Stutzenbaker 1988) in areas adjacent
to marshes suitable for brood-rearing. Predator removal in nesting areas also
deserves consideration and study. WGC marshes are increasingly affected by human
disturbance (Morton and Paine 1990), and nest predator reactions to altered
landscapes are complex (Chalfoun et al. 2002). Little is known about predator
densities in WGC marshes, and the costs of predator removal on a landscape scale
are unknown but likely would be expensive. Still, Holbrook et al. (2000) found
that Mottled Duck nest success reached 67.1% on individual dredge-spoil islands
with few or no predators, suggesting that predator removal could have a positive
effect on nest success.
Acknowledgments
We thank Texas Tech University, University of Minnesota, and US Fish and Wildlife
Service Region 2 Migratory Bird Office. Thanks to T. Arnold for instruction and advice on
matrix population modeling. Thanks to J. Moon and an anonymous reviewer for comments
on early drafts. Conclusions do not necessarily represent the views of the US Fish and Wildlife
Service.
Literature Cited
Alisauskas, R.T., and C.D. Ankney. 1994. Nutrition of breeding female Ruddy Ducks: The
role of nutrient reserves. Condor 96:878–897.
Anderson, M.G., M.S. Lindberg, and R.B. Emery. 2001. Probability of survival and breeding
for juvenile female Canvasbacks. Journal of Wildlife Management 65:385–397.
Arnold, T.W., J.H. Devries, and D.W. Howerter. 2010. Factors that affect renesting in Mallards
(Anas platyrhynchos). Auk 127:212–221.
Baker, O.E., III. 1983. Nesting and brood-rearing habits of the Mottled Duck in the coastal
marsh of Cameron Parish, Louisiana. M.Sc. Thesis. Louisiana State University, Baton
Rouge, LA. 71 pp.
Southeastern Naturalist
E.A. Rigby and D.A. Haukos
2014
38
Vol. 13, Special Issue 5
Ballard, B.M., M.T. Merendino, R.H. Terry, and T.C. Tacha. 2001. Estimating abundance of
breeding Mottled Ducks in Texas. Wildlife Society Bulletin 29:1186–1192.
Bhattacharjee, J., D. Haukos, and J. Neaville. 2007. Vegetation response to disturbance in
a coastal marsh in Texas. Community Ecology 8:15–24.
Bielefeld, R.R., and R.R. Cox. 2006. Survival and cause-specific mortality of adult female
Mottled Ducks in east-central Florida. Wildlife Society Bulletin 34:388–394.
Bielefeld, R.R., M.G. Brasher, T.E. Moorman, and P.N. Gray. 2010. Mottled Duck (Anas
fulvigula). In A. Poole (Ed.). The Birds of North America online. Cornell Lab of Ornithology,
Ithaca, NY. Available online at http://bna.birds.cornell.edu/bna/species/081.
Accessed 25 April 2011.
Caswell, H. 1989. Matrix Population Models. Sinauer Publishers, Sunderland, MA. 328 pp.
Caswell, H. 2001. Matrix Population Models: Construction, Analysis, and Interpretation.
2nd Edition. Sinauer Associates, Sunderland, MA. 722 pp.
Chalfoun, A.D., F.R. Thompson, and M.J. Ratnaswamy. 2002. Nest predators and fragmentation:
A review and meta-analysis. Conservation Biology 16:306–318.
Coluccy, J.M., T. Yerkes, R. Simpson, J.W. Simpson, L. Armstrong, and J. Davis. 2008.
Population dynamics of breeding Mallards in the Great Lakes states. Journal of Wildlife
Management 72:1181–1187.
Dahl, T.E. 1990. Wetland losses in the United States, 1780s to 1980s. US Fish and Wildlife
Service, Washington, DC. 22 pp.
Durham, R.S., and A.D. Afton. 2003. Nest-site selection and success of Mottled Ducks on
agricultural lands in southwest Louisiana. Wildlife Society Bulletin 31:433–442.
Durham, R.S., and A.D. Afton. 2006. Breeding biology of Mottled Ducks on agricultural
lands in southwestern Louisiana. Southeastern Naturalist 5:311–316.
Engeling, G.A. 1950. The nesting habits of the Mottled Duck in Wharton, Fort Bend, and
Brazoria Counties, Texas, with notes on molting and movements. M.Sc. Thesis. Texas
A&M University, College Station, TX. 137 pp.
Esslinger, C.G., and B.C. Wilson. 2001. North American Waterfowl Management Plan,
Gulf Coast Joint Venture: Chenier Plain Initiative. North American Waterfowl Management
Plan, Albuquerque, NM. 29 pp.
Finger, R.S., B.M. Ballard, M.T. Merendino, J.P. Hurst, D.S. Lobpries, and A.M. Fedynich.
2003. Habitat use, movements, and survival of female Mottled Ducks and ducklings
during brood-rearing. Texas Parks and Wildlife Department, Austin, TX. 49 pp.
Green, R.E. 1989. Transformation of crude proportions of nests that are successful for comparison
with Mayfield estimates of nest success. Ibis 131:305–30 6.
Greenwood, R.J., A.B. Sargeant, D.H. Johnson, L.M. Cowardin, and T.L. Shaffer. 1995.
Factors associated with duck nest success in the prairie pothole region of Canada. Wildlife
Monographs 128:357.
Gulf Coast Joint Venture (GCJV). 2007. Mottled Ducks conservation plan. Lafayette ,
LA. Available online at http://www.gcjv.org/docs/GCJV MODU Cons Plan.pdf. Accessed
14 May 2010.
Haukos, D.A. 2010. Status of Mottled Ducks in Texas and Louisiana. Regional Migratory
Bird Office, US Fish and Wildlife Service, Albuquerque, NM. 25pp.
Haukos, D.A., S. Martinez, and J. Heltzel. 2010. Characteristics of ponds used by Mottled
Ducks on the Chenier Plain of the Texas Gulf Coast. Journal of Fish and Wildlife Management
1:93–101.
Hoekman, S.T., L.S. Mills, D.W. Howerter, J.H. Devries, and I.J. Ball. 2002. Sensitivity
analyses of the life cycle of midcontinent Mallards. Journal of Wildlife Management
66:883–900.
Southeastern Naturalist
39
E.A. Rigby and D.A. Haukos
2014 Vol. 13, Special Issue 5
Hoekman, S.T., T.S. Gabor, M.J. Petrie, R. Maher, H.R. Murkin, and M.S. Lindberg. 2006.
Population dynamics of Mallards breeding in agricultural environments in eastern
Canada. Journal of Wildlife Management 70:121–128.
Holbrook, R.S., F.C. Rohwer, and W.P. Johnson. 2000. Habitat use and productivity of
Mottled Ducks on the Atchafalaya River Delta, Louisiana. Proceedings of the Annual
Conference of the Southeast Association of Fish and Wildlife Agencies 54:292–303.
Johnson, D.H. 1991. Further comments on estimating nest success . Ibis 133:205–208.
Johnson, F.A. 2009. Variation in population growth rates of Mottled Ducks in Texas and
Louisiana. Report to the US Fish and Wildlife Service. US Geological Survey, Florida
Integrated Science Center, Gainesville, FL. 22 pp.
Johnson, W.P., R.S. Holbrook, and F.C. Rohwer. 2002. Nesting chronology, clutch size, and
egg size in the Mottled Duck. Wildfowl 53:155–166.
Koons, D.N., J.J. Rotella, D.W. Willey, M. Taper, R.G. Clark, S. Slattery, R.W. Brook,
R.M. Cocoran, and J.R. Lovvorn. 2006. Lesser Scaup population dynamics: What can be
learned from available data? Avian Conservation and Ecology 1(3):article 6. Available
online at http://www.ace-eco.org/vol1/iss3/art6. Accessed 8 February 2010.
Louisiana Department of Fisheries and Wildlife. 2012. Migratory game bird regulations
2012–2013. Available online at http://www.wlf.louisiana.gov/sites/default/files/pdf/
pagehunting/32489-migratory-and-waterfowl/waterfowl_2012-2013-1.pdf. Accessed
12 March 2013.
Martin, K.H., M.S. Lindberg, J.A. Schmutz, and M.R. Bertram. 2009. Lesser Scaup breeding
probability and female survival on the Yukon Flats, Alaska. Journal of Wildlife
Management 73:914–923.
Mauser, D.M., and R.L. Jarvis. 1994. Mallard recruitment in northeastern California. Journal
of Wildlife Management 58:565–570.
Mayfield, H. 1961. Nesting success calculated from exposure. Wilson Bulletin 73:255–261.
McCracken, K.G., W.P. Johnson, and F.H. Sheldon. 2001. Molecular population genetics,
phylogeography, and conservation biology of the Mottled Duck (Anas fulvigula). Conservation
Genetics 2:87–102.
Merendino, M.T., D.S. Lobpries, J.E. Neaville, J.D. Ortego, and W.P. Johnson. 2005. Regional
differences and long-term trends in lead exposure in Mottled Ducks. Wildlife
Society Bulletin 33:1002–1008.
Morton, R.A., and J.G. Paine. 1990. Coastal land loss in Texas—an overview. Transactions
of the Gulf Coast Association of Geological Societies 40:625–634.
Ning, Z.H., and K. Abdollahi. 2003. Gulf Coast regional climate. Pp. 79–82, In Z.H. Ning,
R.E. Turner, T. Doyle, and K. Abdollahi (Eds.). Integrated Assessment of the Climate
Change Impacts on the Gulf Coast Region. Gulf Coast Climate Change Assessment
Council and Louisiana State University Graphic Services, Washington, DC. Available
online at http://www.usgcrp.gov/usgcrp/Library/nationalassessment/gulfcoast. Accessed
11 March 2010.
North American Waterfowl Management Plan, Plan Committee. 2004. North American
Waterfowl Management Plan 2004. Strategic Guidance: Strengthening the Biological
Foundation. US Fish and Wildlife Service, Washington, DC. 22 pp.
Powell, L.A. 2007. Approximating variance of demographic parameters using the Delta
method: A reference for avian biologists. Condor 109:949–954.
Powell, L.A. 2012. Erratum. Condor 114:678–678.
Rigby, E.A. 2008. Recruitment of Mottled Ducks (Anas fulvigula) on the upper Texas Gulf
Coast. M.Sc. Thesis. Texas Tech University, Lubbock, TX. 148 pp.
Southeastern Naturalist
E.A. Rigby and D.A. Haukos
2014
40
Vol. 13, Special Issue 5
Rigby, E.A., and D.A. Haukos. 2012. Breeding-season survival and breeding incidence of
female Mottled Ducks on the upper Texas Gulf Coast. Waterbirds 35:260-269.
Rotella, J.J., and J.T Ratti. 1992. Mallard brood survival and wetland habitat conditions in
southwestern Manitoba. Journal of Wildlife Management 56:499–507.
Salinas, L.M., R.D. DeLaune, and W.H. Patrick, Jr. 1986. Changes occurring along a rapidly
submerging coastal area: Louisiana. Journal of Coastal Research 2:269 –284.
Singleton, J.R. 1953. Mottled Duck studies. Pp. 85–122, In Texas coastal waterfowl survey.
Texas Game and Fish Commission, Federal Aid Wildlife Restoration Performance
Report, Austin, TX.
Snedecor, G.W., and W.G. Cochran. 1968. Statistical Methods. 6th Edition. Iowa State University
Press, Ames, IA. 592 pp.
Stutzenbaker, C.D. 1988. The Mottled Duck, its Life History, Ecology, and Management.
Texas Parks and Wildlife Department, Austin, TX. 209 pp.
Stutzenbaker, C.D. 1999. Aquatic and Wetland Plants of the Western Gulf Coast. Texas
Parks and Wildlife Press, Austin, TX. 477 pp.
US Fish and Wildlife Service (USFWS). 2005. The US Fish and Wildlife Service’s focal species
strategy for migratory birds: Measuring success in bird conservation. Division of Migratory
Birds, US Fish and Wildlife Service. Washington, DC. Available online at http://
www.fws.gov/migratorybirds/CurrentBirdIssues/ Management/FocalSpecies/The%20
Focal%20Species%20Fact%20Sheet%20and%20Table.pdf. Accessed 2 May 2011.
USFWS. 2006. Texas Chenier Plain Refuge Complex: Environmental impact statement,
comprehensive conservation plan, and land protection plan. Division of Planning, National
Wildlife Refuge System, Southwest Region, US Fish and Wildlife Service. Albuquerque,
NM. Available online at http://www.fws.gov/southwest/refuges/plan/docs/
TableOfContents.pdf. Accessed 2 May 2011.
USFWS. 2013. Mottled Duck focal species plan. Region 2 Migratory Bird Office, Albuquerque,
NM. 30 pp.
Varner, D.M., R.R. Bielefeld, G.R. Hepp. 2013. Nesting ecology of Florida Mottled Ducks
using altered habitats. Journal of Wildlife Management 74:1175–1178.
Walters, N.F., F.C. Rohwer, and J.O. Harris. 2001. Nest success and nesting habitats of
Mottled Ducks on the Mississippi River Delta in Louisiana. Proceedings of the Annual
Conference of the Southeast Association of Fish and Wildlife Agencies 55:498–505.
White, G.C. 2000. Population viability analysis: Data requirements and essential analyses.
Pp. 288–331, In L. Boitani and T.K. Fuller (Eds.). Research Techniques in Animal Ecology:
Controversies and Consequences. Columbia University Press, NY. 476 pp.
White, G.C., and K.P. Burnham. 1999. Program MARK: Survival estimation from populations
of marked animals. Bird Study 46:120–138.
White, W.A., and T.A. Tremblay. 1995. Submergence of wetlands as a result of human
induced subsidence and faulting along the upper Texas Gulf Coast. Journal of Coastal
Research 11:788–807.
Williams, C.L., A.M. Fedynich, D.B. Pence, and O.E. Rhodes, Jr. 2005. Evaluation of
allozyme and microsatellite variation in Texas and Florida Mottled Ducks. Condor
107:155–161.
Wisdom, M.J., and L.S. Mills. 1997. Sensitivity analysis to guide population recovery:
Prairie-chickens as an example. Journal of Wildlife Management 61:302–312.


 The Southeastern Naturalist is a peer-reviewed journal that covers all aspects of natural history within the southeastern United States. We welcome research articles, summary review papers, and observational notes.