Southeastern Naturalist
M.E. Symmank, C.E. Comer, and J.C. Kroll
2014
172
Vol. 13, Special Issue 5
Using Infrared-Triggered Cameras to Monitor Activity of
Forest Carnivores
Matthew E. Symmank1,2,*, Christopher E. Comer1, and James C. Kroll1
Abstract - The activity patterns of 4 forest predator species were monitored, using infraredtriggered
cameras, within a 1318-ha study area in East Texas. We recorded 161 photographic
capture events in 1925 trap-nights over 17 weeks. Photographic capture events included
18 Lynx rufus (Bobcat), 109 Procyon lotor (Raccoon), 21 Didelphis virginiana (Virginia
Opossum), and 13 Canis latrans (Coyote). We developed an easily replicated method of
measuring time on a percent scale to compare activity data over several months, accounting
for changes in sunrise and sunset times. Bobcat activity was 38.9% crepuscular and 22.1%
diurnal. The activity of the other 3 species was mostly nocturnal: Raccoon 94.5%, Virginia
Opossum 100%, and Coyote 77%. Moon phase based on percentage of visible light did not
affect either Raccoon or Virginia Opossum nocturnal activity level.
Introduction
A wide variety of predator species inhabit the forested areas of North America.
Several species of medium-sized forest predators including Procyon lotor (L.)
(Raccoon), Didelphis virginiana Kerr (Virginia Opossum), Mephitis mephitis
(Schreber) (Striped Skunk), Urocyon cinereoargenteus (Schreber) (Gray Fox),
Canis latrans Say (Coyote) and Lynx rufus (Schreber) (Bobcat) are often found in
co-occurring populations th,roughout the southeastern United States (Chamberlain
and Leopold 2005), including East Texas. These species are similar in size and
exhibit dietary overlap (Chamberlain and Leopold 1999, Gardner and Sunquist
2003), yet are sympatric over a wide range (Anderson and Lovallo 2003, Kaufmann
1982). In particular, Coyotes and Bobcats exhibit both interference and exploitative
competition in some ecosystems (Anderson and Lovallo 2003), and Raccoons and
Virginia Opossums exhibit a high degree of apparent ecological overlap (Shirer
and Fitch 1970). Furthermore, Bobcats and Coyotes both can be important predators
of Raccoons and Virginia Opossums (Gardner and Sundquist 2003, Gehrt
2003). Dietary overlap and coexistence have been studied in some combinations of
these species (e.g., Azevedo et al. 2006, Dijak and Thompson 2000); however, no
consensus on the mechanisms that enable these species to coexist has been reached.
Temporal activity partitioning is one of several potential mechanisms enabling
these competing species to coexist. Findings by Neale and Sacks (2001) suggest
temporal partitioning between Bobcats and Coyotes, in which Coyote activity
is largely nocturnal and Bobcat activity is predominantly diurnal. The extent to
1Arthur Temple College of Forestry and Agriculture, Stephen F. Austin State University,
SFASU Box 6109, Nacogdoches, TX 75962. 2Currentent address - Texas Parks and Wildlife
Department, Richland Creek Wildlife Management Area, Streetman, TX 75859. *Corresponding
author - matt.symmank@tpwd.texas.gov.
Manuscript Editor: Jerry Cook
Proceedings of the 5th Big Thicket Science Conference: Changing Landscapes and Changing Climate
2014 Southeastern Naturalist 13(Special Issue 5):172–183
Southeastern Naturalist
173
M.E. Symmank, C.E. Comer, and J.C. Kroll
2014 Vol. 13, Special Issue 5
which temporal partitioning occurs among additional predator species such as
Virginia Opossum and Raccoon is currently not well documented. Although extensive
overlap in spatial partitioning of Bobcats, Coyotes, and Gray Fox has been
documented (Chamberlain and Leopold 2005), research to determine the extent
of temporal partitioning is lacking, due at least in part due to the difficulties associated
with obtaining large quantities of reliable information using traditional
techniques, and the complications of temporal data analysis over a long period of
time. A better understanding of the temporal partitioning of forest carnivores is
necessary to fully understand the ecology of co-occurring predators. Such understanding
is fundamental to successful management of these species.
Several methods to record temporal data and compare animal activity-patterns
over long time periods are available to researchers. Recording activity patterns using
traditional techniques, such as direct observations and radiotelemetry, have been successful
in providing valuable and accurate data on animal activity (Greenwood 1982,
Grinder and Krausman 1999, Kitchings and Story 1978, Sharp and Sharp 1956), but
recording more detailed activity patterns with these methods is labor intensive and
costly. Infrared-triggered cameras have been used successfully to document activity
patterns for Puma concolor (L.) (Mountain Lion) (Pierce et al. 1998), co-occurring
populations of Odocoileus virginianus (Zimmerman) (White-tailed Deer) and Tayassu
tajacu (L.) (Collared Peccary) (Koerth et al. 1997), and sympatric populations
of Virginia Opossums and Raccoons (Carver et al. 2011). Cameras provide a useful
survey system to evaluate wildlife activity-patterns over long time periods because
they can be operated continuously in a cost-effective manner. Infrared-triggered cameras
are also well suited for the collection of data on activity patterns because human
influence on animal activity is reduced compared with human impacts in studies that
use direct observation or radiotelemetry.
Analyzing temporal data over long periods of time is complicated because researchers
must account for the changes in sunrise and sunset times that occur over
the course of their studies. Ladine (1997) used timers on live traps to accurately
record activity time; image capture-times were then standardized as a percent scale
between 0 (sunset) and 1 (sunrise). However, the author did not provide details on
if or how data were standardized during the full 24-hr period, making it impossible
for others to replicate the study. Recently, Carver and coworkers (2011) standardized
time to a 12-hr day-length to present time-activity data collected on circular
plots. Perhaps because of the lack of an accepted system to compile long-term activity
data, few researchers have evaluated diel activity patterns of multiple species
within a forest population (but see Carver et al. 2011).
The effects of moon phase have not been found to have a significant effect on terrestrial
mammal activity (Bender et al. 1996, Roseberry and Woolf 1986, Springer
1982), yet many charts and tables that predict periods of greatest animal activity
based on lunar cycles are available to hunters who wish to increase their success
(e.g., Solunar Tables®; solunarforecast.com). A clear and scientific understanding
of moon phase effects on animal behavior would refute or verify the utility of these
tables to predict the activity levels of terrestrial mammals, and inform the public.
Southeastern Naturalist
M.E. Symmank, C.E. Comer, and J.C. Kroll
2014
174
Vol. 13, Special Issue 5
Our objectives were to (1) use infrared-triggered cameras to obtain data on
predator temporal activity patterns, (2) develop a system to accurately analyze data
to account for changes in sunrise and sunset, and (3) evaluate the effects of moon
phase on predator activity. To accomplish our objectives, we used a system of infrared-
triggered cameras to record the activity of several species of forest predators in
eastern Texas. We also developed a procedure similar to Ladine (1995) to analyze
temporal data by standardizing day- and night-length, and measuring time using a
24-hr percent scale. This system allows temporal data collected over long periods
of time to be accurately compared in relation to sunrise and sunset times.
Field-Site Description
The study was conducted on a 1318-ha privately owned tract located approximately
16 km west of Nacogdoches, TX (Nacogdoches County). The study site
was a mixture of upland Pinus taeda L. (Loblolly Pine) plantations of various ages
(including numerous clearcuts where trees were <5 years old), hardwood lowlands,
and mixed pine-hardwood forests. The property had an extensive network of gravel
roads, and numerous warm- and cool-season food-plots were planted to provide
supplemental forage for White-tailed Deer. The study area was surrounded by a
deer-proof fence. The property was primarily used for timber, oil, and gas production
and is leased for White-tailed Deer hunting. Predators are not actively harvested
on the property but are opportunistically taken by lease members.
The study area is located in the Pineywoods ecoregion of East Texas, which is
characterized by managed and natural pine forests on upland sites. Dominant overstory
species include Loblolly Pine, Pinus echinata Mill. (Shortleaf Pine), and Pinus
palustris Mill. (Longleaf Pine). Upland pine forests are interspersed with hardwoods
in low-lying areas, mixed pine-hardwood forests, and upland hardwood stands
(Diggs et al. 2006). Regional climate is humid and subtropical with an annual average
rainfall of approximately 128 cm; average mean temperature during January is 9 °C,
and average mean temperature during July is 27 °C (Stephen F. Austin State University/
National Weather Service weather station, Nacogdoches, TX).
Methods
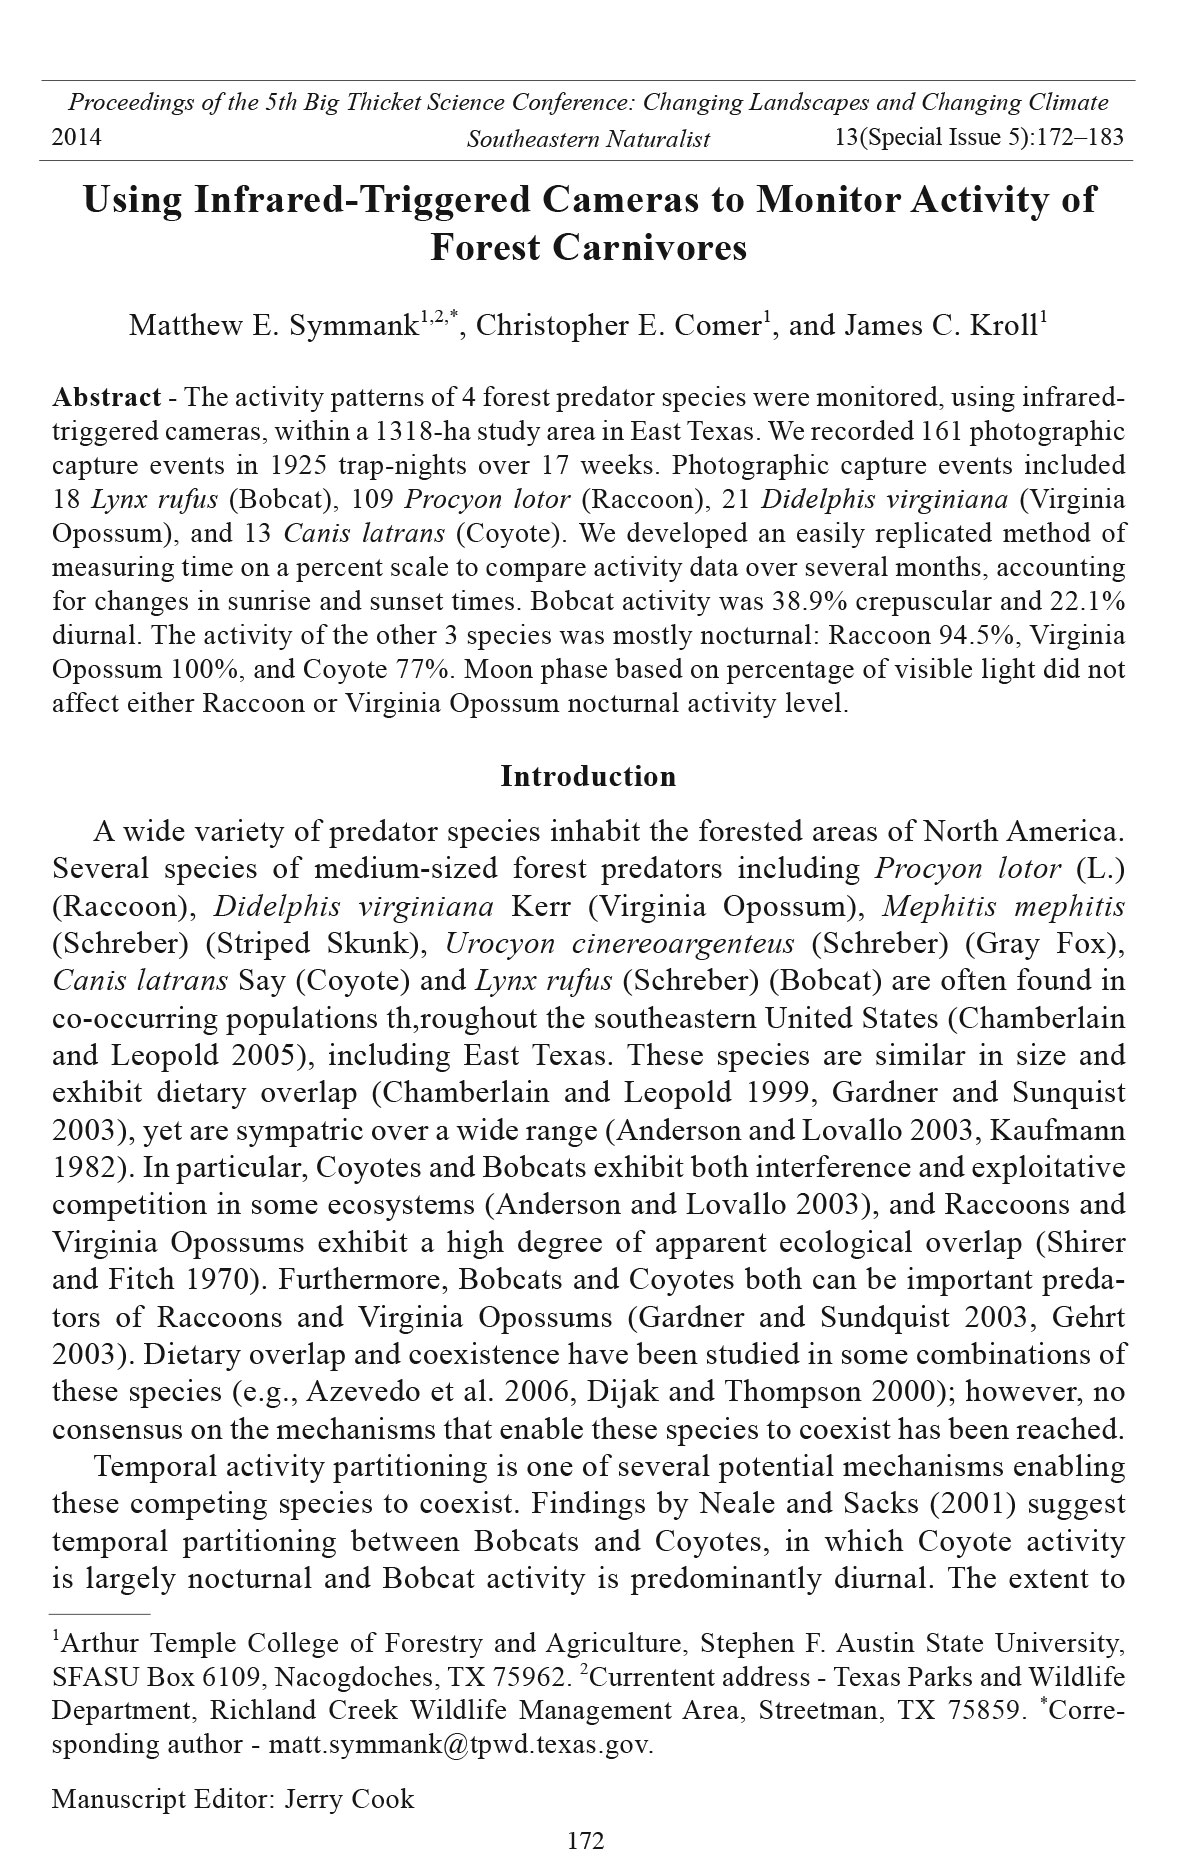
Camera survey of predator activity patterns
We collected data during two sampling periods from 29 June–2 August and 6
September–28 November 2005. For the first sampling period, we established 21
camera stations on 7 transects located throughout the 1318-ha research site. We
placed 3 camera stations along transects at intervals of 200 m. We randomly assigned
coordinates for the first station per transect and the transect azimuth using
ArcGIS (Environmental Systems Research Institute Inc., Redlands, CA). This
configuration yielded a mean coverage of ≈1 camera/188.3 ha. For the second
sampling period, we overlaid the 1318-ha research site with a 65-ha block grid
and systematically established a camera station within each block for a total of 20
camera stations (Fig. 1). We set up cameras near game trails, roads, or other suitable
Southeastern Naturalist
175
M.E. Symmank, C.E. Comer, and J.C. Kroll
2014 Vol. 13, Special Issue 5
locations (Jacobson et al. 1997) within 200 m of the center of each grid block. This
configuration yielded a mean coverage of ≈1 camera/65.9 ha. We recorded the
GPS coordinates of each camera station using a Trimble® Pro XRS GPS receiver
(Trimble Navigation Limited, Sunnyvale, CA).
During both sampling periods, camera stations were comprised of a Trailmaster®
1500 transmitter and model TM1500 Active Infrared Unit receiver (Goodson and
Figure 1. Locations of infrared-triggered camera stations for assessment of time-activity
patterns of forest carnivores, Nacogdoches County, TX, from 29 June–2 August and 6 September–
28 November 2005.
Southeastern Naturalist
M.E. Symmank, C.E. Comer, and J.C. Kroll
2014
176
Vol. 13, Special Issue 5
Associates, Inc., Lenexa, KS). We placed the transmitter and receiver portion of
the camera stations 3–4 m apart, 30 cm above the ground. We oriented the stations
in a north–south direction only if necessary to reduce the number of false events
created by direct sunlight shining on the receiver window (Hernandez et al. 1997).
We programmed camera stations for 24-hr-per-day activity, with a 6-sec delay between
photographs and a pulse delay setting of 5, so that the infrared beam had to
be broken for 0.25 sec before a photograph was taken. At each station, we wrapped
a clean, unused rag around a 20-cm wooden post, fastened the rag with twine, put a
chemical attractant (Bobcat urine) on the rag, and placed the post halfway between
the camera transmitter and receiver. We displayed a visual attractant (an aluminum
pie plate for the first sampling period or 3 large feathers tied together for the second
sampling period) approximately 2–3 m from the ground in close proximity to the
infrared-triggered camera and chemical attractant. We checked all cameras twiceweekly
to replace film, batteries, and lure as necessary .
We categorized all photographs by the species that triggered the camera system,
and considered multiple photographs of the same species or group of the same
species taken within 30 minutes as one capture event. No capture events recorded
multiple species.
Data analysis
Because day/night length varied nearly 4 hours throughout the 17 weeks of sampling,
it was necessary to standardize time data for comparisons of time activity.
We converted all time measurements into hourly decimal format and set sunrise and
sunset as zero values. We then calculated all night photographic capture times as:
(time since sunset) X 10
night length
and calculated day photographic capture times as:
- (time since sunrise) X 10
day length
We collected activity information on 4 species of forest predators (Bobcat, Raccoon,
Coyote, and Virginia Opossum) and analyzed the data using our system of
standardizing time based on sunrise and sunset. We classified activity as crepuscular,
nocturnal, or diurnal, and defined crepuscular periods as 5% of time before
and after sunset plus 5% of time before and after sunrise. We defined nocturnal and
diurnal periods as all day and night periods exclusive of crepuscular times.
We used chi-square goodness-of-fit tests to determine if the temporal distribution
(crepuscular or day/night) of activity of forest predators as captured in our
photographic data differed from what would be expected of a random pattern of
activity at the camera stations. We also compared the activity patterns among the
species using pairwise chi-squared tests. In cases where the expected values of
some cells were <5, we also calculated Fisher’s exact tests for those pairs. All
statistical analyses were performed in SAS 9.2 (SAS Institute 2003) using α = 0.05.
Southeastern Naturalist
177
M.E. Symmank, C.E. Comer, and J.C. Kroll
2014 Vol. 13, Special Issue 5
Effects of moon phase on predator activity patterns
We compared nocturnal activity levels of two forest predators (Raccoon and Virginia
Opossum) among four lunar cycles. We analyzed only Raccoon and Virginia
Opossum data because these datasets contained sufficient numbers of photographic
captures throughout the moon cycle. The first lunar cycle was from 29 June–27 July
2005. The other three lunar cycles were from 6 September–28 November 2005.
We divided the cycles into 5 categories based on the percentage of moon visible
(0–20%, 21–40%, 41–60%, 61–80%, and 81–100% moon visibility). We used a chisquared
goodness-of-fit test to compare observed Raccoon and Virginia Opossum
activity at different moonlight levels to a random expectation.
Results
Camera survey of predator activity patterns
We recorded 1925 trap-nights during the 2 sampling periods. These efforts resulted
in a total of 161 photographs of 4 species of forest predators taken during 17
weeks of camera surveys. We observed asymmetric predator activity patterns for all
4 species of forest carnivores among diurnal, nocturnal, and crepuscular periods of
activity (Table 1). One photograph of a 5th forest predator, a Striped Skunk, was also
taken during our survey period but was not analyzed.
Eighteen Bobcat photographic capture events were recorded at 11 of 27 camera
stations. Bobcats were active periodically throughout the day and night, with 22.1%
of all Bobcat activity recorded during daylight periods, however the peak of diurnal
activity was immediately prior to sunset (Fig. 2). Crepuscular activity accounted for
38.9% of all Bobcat activity. Bobcat activity did not differ from a random distribution
of activity (c2 = 4.64, P = 0.098).
We recorded 109 Raccoon photographic capture events at 23 of 27 camera
stations. Raccoons were found to be almost entirely nocturnal with only 5.5% of
photographs recorded during daylight. Raccoon activity began immediately following
sunset and continued until immediately preceding sunrise (Fig. 2). Raccoons
were significantly more active at night and less active at both crepuscular periods
and during the day (c2 = 85.36, P < 0.0001).
We recorded 13 Coyote photographic capture events at 11 of 27 camera stations.
Coyotes were found to be active periodically throughout the day (15.3%) and crepuscular
periods (7.7%), with most activity confined to nocturnal periods or early
morning (77%) (Fig. 2). Coyotes were significantly more active at night and less
active during the day (c2 = 7.38, P = 0.025).
Table 1. Diel activity patterns of forest carnivores in east Texas, recorded using infrared-triggered
cameras. All data from study area, Nacogdoches County, TX, from 29 June–2 August and 6 September–
28 November 2005.
Diurnal Nocturnal Crepuscular
Bobcat (n = 18) 22.1% 39.0% 38.9%
Raccoon (n = 109) 5.5% 82.6% 11.9%
Coyote (n = 13) 15.3% 77.0% 7.7%
Virginia Opossum (n = 21) 0.0% 95.2% 4.8%
Southeastern Naturalist
M.E. Symmank, C.E. Comer, and J.C. Kroll
2014
178
Vol. 13, Special Issue 5
We recorded 21 Virginia Opossum photographic capture events at 7 of 27 camera
stations. Virginia Opossums were the only species recorded exclusively during
nocturnal periods, with two distinct activity periods during the night. The first activity
period began after sunset and slowed at midnight and the second began after
midnight and slowed toward sunrise (Fig. 2). Virginia Opossums were significantly
more active during the nocturnal period compared to crepuscular or diurnal periods
(c2 = 26.9, P = < 0.0001).
Bobcat temporal activity patterns differed from both Raccoon (c2 = 16.5,
P = 0.0003; Fisher’s P = 0.0003) and Virginia Opossum (c2 = 14.6, P = 0.007;
Fisher’s P = 0.00025) activity patterns (Fig. 2). The Bobcat pattern was somewhat
similar to Coyote activity (c2 = 5.02, P = 0.081; Fisher’s P = 0.12). All other comparisons
(i.e., Coyotes, Raccoons, and Virginia Opossums) showed that temporal
activity patterns were not significantly different (c2 < 3.65 16.5, P > 0.16; Fisher’s
P > 0.26). Bobcats differed from the other species primarily in their greater
daytime and crepuscular activity.
When analyzing the time-activity data, we observed a 74% reduction in activity
during the midnight period occurring one-half way between sunrise and sunset
from average pre- and post-midnight periods (see Fig. 2). This period of reduced
Figure 2.(A) Bobcat n = 18, (B) Raccoon n = 109, (C) Coyote n = 13 and (D) Virginia Opossum
n = 21 activity at Bobcat-urine scent stations. Displayed as percent of photographic
captures with time measurement recorded as a percent of daylight and dark hours. Crepuscular
activity is shown in gray. Data recorded 29 June–2 Aug. and 6 Sept–28 Nov 2005,
Nacogdoches County, TX.
Southeastern Naturalist
179
M.E. Symmank, C.E. Comer, and J.C. Kroll
2014 Vol. 13, Special Issue 5
activity occurred in all 4 species surveyed, but was most evident in Raccoons and
Virginia Opossum.
Effects of lunar cycle on predator activity patterns
We analyzed 98 Raccoon and 21 Virginia Opossum photographic capture-events
during 4 moon cycles. For this analysis, we included only nocturnal photographic
captures (Fig. 3). The number of observations did not significantly differ from
Figure 3. (A) Raccoon (n = 98) and (B) Virginia Opossum (n = 21) nocturnal activity at
Bobcat urine scent stations based on percent moon visibility. Displayed as percent of photographic
captures. Four moon cycles were recorded: 29 June–27 July and 6 Sept–28 Nov
2005, Nacogdoches County, TX.
Southeastern Naturalist
M.E. Symmank, C.E. Comer, and J.C. Kroll
2014
180
Vol. 13, Special Issue 5
a random distribution for either Raccoon (c2 = 0.7755, P = 0.9417) or Virginia
Opossum (c2 = 5.4286, P = 0.2461). Therefore, we found that moon phase had no
effect on either Raccoon or Virginia Opossum activity level. We did not analyze
the effects of moon phase for Bobcat or Coyote because of the small number of
photographic captures of these species during nocturnal periods.
Discussion
During our evaluation of forest predator activity patterns, we found infraredtriggered
cameras to be well suited to the task of gathering large amounts of activity
data over extended time periods, with limited human effort, in a cost effective manner.
We experienced some camera malfunctions such as exposure of all film before
twice-weekly camera checks and rodents chewing wires; however, these incidents
were limited and did not affect data collection significantly. Our system of standardizing
time data on a percent scale to eliminate distortion caused by changes
in time of sunrise and sunset was also effective in describing activity patterns of
4 forest carnivores. Our tests on the effects of moon phase on activity patterns of
Raccoons and Virginia Opossums suggest that moon phase has no effect on activity
patterns of these predators.
Bobcat activity was mainly nocturnal with activity peaks occurring at crepuscular
periods. These findings for a visual predator like the Bobcat agree with the
reported results by Kavanau (1971) during laboratory testing, and Hall and Newsome
(1976) in Louisiana. Our Coyote activity data agreed with results reported by
Grinder and Krausman (1999) in Arizona and McClennen et al. (2001) in Wyoming,
who suggest Coyotes are both diurnal and nocturnal. However, these authors also
suggest that Coyotes have activity peaks during crepuscular periods: a finding not
supported by our results. Although we had a limited number of Coyote captures, it
appears that Coyotes were less active when Bobcats were most active right before
and after sunset.
Raccoon activity during the study period was found to be primarily nocturnal,
with activity initiated immediately after sunset and ending at sunrise. This pattern
of nocturnal activity has long been identified by researchers as the typical pattern of
Raccoon activity throughout North America (Carver et al. 2011, Kaufmann 1982).
Our study documented Virginia Opossum activity during the 17 weeks of camera
surveying as strictly nocturnal, with no photographs taken during diurnal periods.
Findings by McManus (1971), in New York and Carver et al. (2011), in Tennessee,
are similar to our results with Virginia Opossums, which we classified as nocturnal,
with activity peaks during the middle of the night. Activity peaks of both Virginia
Opossums and Racoons avoided periods of high Bobcat activity around sunset,
suggesting that predation risk may be influencing activity period for these species.
Differences between our study location and study locations described in the literature
may have effects on activity patterns. Some differences include: habitat type,
habitat quality, latitude, altitude, etc.
The reduced activity we observed during the period around midnight was unexpected
and most evident in Raccoons and Virginia Opossums. This nocturnal time
Southeastern Naturalist
181
M.E. Symmank, C.E. Comer, and J.C. Kroll
2014 Vol. 13, Special Issue 5
of inactivity may be a period of rest during long bouts of hunting and/or foraging.
To our knowledge a reduction of midnight activity has not been observed before for
these four species and should be investigated further.
Limited numbers of photographic captures may have affected our results for
Bobcats, Virginia Opossums, and Coyotes; however, sample size appeared adequate
in the case of Raccoons. We believe that the sample size of Raccoons (n =
109) was sufficient to determine accurate time activity patterns .
Because it is difficult to uniquely identify individual Coyotes, Raccoons, and
Virginia Opossums by unique pelage markings during photographic capture, we
are unsure how many animals of these 3 species comprised the total number of
photographs. However, during the second sampling period we conducted a Bobcat
population survey in which 7 individual Bobcats were photographed a total of 15
times (Symmank et al. 2008). This confirms that multiple individual Bobcats were
recorded and activity findings for this species were not based on a sample of just a
few individuals.
We believe that our system of recording and analyzing numerous photographic
captures of multiple species will aid future research efforts in better analyzing
activity patterns and possible temporal partitioning of predator species. Although
our data were limited, temporal differences in activity patterns were evident among
the 4 species analyzed. Bobcats were active periodically throughout the day and
night and Raccoons and Virginia Opossums showed activity peaks between sunset
and sunrise. We found that Coyotes were mainly nocturnal but were more diurnal
than both Raccoons and Virginia Opossums. It is possible that Raccoons and Virginia
Opossums are essentially nocturnal to avoid predation by or competition with
larger carnivores such as Bobcats and Coyotes that are active during diurnal and
crepuscular periods. Further research into the temporal partitioning will advance
our understanding of co-occurring populations of medium-sized predators.
Acknowledgments
This project was supported by funds from the Institute for White-tailed Deer Management
and Research and by McIntire-Stennis funding through the Arthur Temple College
of Forestry and Agriculture, Stephen F. Austin State University. During this research, M.
Symmank was supported by a scholarship from the Houston Safari Club and by the Arthur
Temple College of Forestry and Agriculture, Stephen F. Austin State University. The Hayter
Trust provided access to the study site, and field assistance was provided by B. Koerth and
D. Hollowell.
Literature Cited
Anderson, E.M., and M.J. Lovallo. 2003. Bobcat and Lynx. Pp. 758–786, In G.A. Feldhammer,
B.C. Thompson and J.A. Chapman (Eds.). Wild Mammals of North America: Biology,
Management, and Economics. The Johns Hopkins University Press, Baltimore, MD
Azevedo, F.C.C., V. Lester, W. Gorsuch, S. Lariviere, A.J. Wirsing, and D.L. Murray. 2006.
Dietary breadth and overlap among five sympatric prairie carnivores. Journal of Zoology
269:127–135.
Southeastern Naturalist
M.E. Symmank, C.E. Comer, and J.C. Kroll
2014
182
Vol. 13, Special Issue 5
Bender, D.J., E.M. Bayne, and R.M. Brigham. 1996. Lunar condition influences Coyote
(Canis latrans) howling. American Midland Naturalist 136:413–417.
Carver, B.D., M.L. Kennedy, A.E. Houston, and S.B. Franklin. 2011. Assessment of temporal
partitioning in foraging patterns of syntopic Virginia Opossums and Raccoons.
Journal of Mammalogy 92:134–139.
Chamberlain, M.J., and B.D. Leopold. 1999. Dietary patterns of sympatric Bobcats and
Coyotes in central Mississippi. Proceedings of the Annual Conference of the Southeastern
Association of Fish and Wildlife Agencies 53:204–219.
Chamberlain, M.J., and B.D. Leopold. 2005. Overlap in space use of Bobcats (Lynx rufus),
Coyotes (Canis latrans), and Gray Foxes (Urocyon cinereoargenteus). American Midland
Naturalist 153:171–179.
Diggs, G.M., B.L. Lipscomb, M.D. Reed, and R.J. O’Kennon. 2006. Illustrated Flora of
East Texas. Botanical Research Institute of Texas, Fort Worth, TX.
Dijak, W.D., and F.R. Thompson. 2000. Landscape and edge effects on the distribution of
mammalian predators in Missouri. Journal of Wildlife Management 64:209–216.
Gardner, A.L., and M.E. Sunquist. 2003. Opossum. Pp. 3–29, In G.A. Feldhammer, B.C.
Thompson, and J.A. Chapman (Eds.). Wild Mammals of North America: Biology, Management,
and Economics. Johns Hopkins University Press, Baltimore, MD. 1168 pp.
Gehrt, S.D. 2003. Raccoon (Procyon lotor) and allies. Pp. 611–634, In G.A. Feldhamer, B.C.
Thompson, and J.A. Chapman (Eds.). Wild Mammals of North America: Biology, Management,
and Economics. Johns Hopkins University Press, Baltimore, MD. 1168 pp.
Greenwood, R.J. 1982. Nocturnal activity and foraging of prairie Raccoons (Prycyon lotor)
in North Dakota. The American Midland Naturalist 107:238–243.
Grinder, M.I., and P.R. Krausman. 1999. Home range, habitat use, and nocturnal activity of
Coyotes in an urban landscape. Journal of Wildlife Management 65:887–898.
Hall, H.T., and J.D. Newsome. 1976. Summer home-ranges and movements of Bobcats in
bottomland hardwoods of southern Louisiana. Proceedings of the Annual Conference of
the Southeastern Association of Fish and Wildlife Agencies 30:427–436.
Hernandez, F., D. Rollins, and R. Cantu. 1997. An evaluation of Trailmaster® camera systems
for identifying ground-nest predators. Wildlife Society Bulletin 25:848–853.
Jacobson, H.A., J.C. Kroll, R.W. Browning, B.H. Koerth, and M.H. Conway. 1997.
Infrared-triggered cameras for censusing White-tailed Deer. Wildlife Society Bulletin
25:547–556.
Kaufmann, J.H. 1982. Raccoon and Allies. Pp. 567–585, In G.A. Feldhamer, B.C. Thompson,
and J.A. Chapman (Eds.). Wild Mammals of North America: Biology, Management,
and economics. Johns Hopkins University Press, Baltimore, MD. 1168 pp.
Kavanau, J. L. 1971. Locomotion and activity phasing of some medium-sized mammals.
Journal of Mammalogy 52:386–403.
Kitchings, J.T., and J.D. Story. 1978. Preliminary studies of Bobcat activity patterns. Proceedings
of the Annual Conference of the Southeastern Association of Fish and Wildlife
Agencies 32:53–59.
Koerth, B.H., C.D. McKown, and J.C. Kroll. 1997. Infrared-triggered camera versus helicopter
counts of White-tailed Deer. Wildlife Society Bulletin 25:557–562.
Ladine, T.A. 1995. Ecology of co-occurring populations of Opossums (Didelphis virginiana)
and Raccoons (Procyon lotor) in Tennessee. Doctoral Dissertation. The University
of Memphis, Memphis, TN.
Ladine, T.A. 1997. Activity patterns of co-occurring populations of Virginia Opossums
(Didelphis virginiana) and Raccoons (Procyon lotor). Mammalia 61:345–354.
Southeastern Naturalist
183
M.E. Symmank, C.E. Comer, and J.C. Kroll
2014 Vol. 13, Special Issue 5
McClennen, N., R.R. Wigglesworth, and S.H. Anderson. 2001. The effects of suburban and
agricultural development on the activity patterns of Coyotes (Canis latrans). American
Midland Naturalist 146:27–36.
McManus, J.J. 1971. Activity of captive Didelphis marsupialis. Journal of Mammalogy
52:846–848.
Neale, J.C.C., and B.N. Sacks. 2001. Resource utilization and interspecific relations of
sympatric Bobcats and Coyotes. Oikos 94:236–249.
Pierce, B.M., V.C. Bleich, C.B. Chetkiewicz, and J.D. Wehausen. 1998. Timing of feeding
bouts of Mountain Lions. Journal of Mammalogy 79:222–226.
Roseberry, J.L., and Alan Woolf. 1986. Can sun and moon charts predict wildlife activity?
Proceedings of the Annual Conference of the Southeastern Association of Fish and
Wildlife Agencies 40:353–363.
SAS Institute. 2003. SAS Version 9. SAS Institute, Cary, NC.
Sharp, W.M., and L.H. Sharp. 1956. Nocturnal movements and behavior of wild Raccoons
at a winter feeding station. Journal of Mammalogy 37:170–177.
Shirer, H.W., and H.S. Fitch. 1970. Comparison from radiotracking of movements and
denning habits of the Raccoon, Striped Skunk, and Opossum in northeastern Kansas.
Journal of Mammalogy 51:491–503.
Springer, J.T. 1982. Movement patterns of Coyotes in south-central Washington. Journal of
Wildlife Management 46:191–200.
Symmank, M.E., C.E. Comer, and J.C. Kroll. 2008. Estimating Bobcat abundance in East
Texas using infrared-triggered cameras. Proceedings of the Annual Conference of the
Southeastern Association of Fish and Wildlife Agencies 62:64–69.


 The Southeastern Naturalist is a peer-reviewed journal that covers all aspects of natural history within the southeastern United States. We welcome research articles, summary review papers, and observational notes.