Habitat Characteristics Associated with the Distribution and Abundance of Histrionicus histrionicus (Harlequin Ducks) Wintering in Southern New England
Richard A. McKinney, Scott R. McWilliams,and Michael A. Charpentier
Northeastern Naturalist, Volume 14, Issue 2 (2007): 159–170
Full-text pdf (Accessible only to subscribers.To subscribe click here.)
Access Journal Content
Open access browsing of table of contents and abstract pages. Full text pdfs available for download for subscribers.
Current Issue: Vol. 30 (3)

Check out NENA's latest Monograph:
Monograph 22


2007 NORTHEASTERN NATURALIST 14(2):159–170
Habitat Characteristics Associated with the Distribution
and Abundance of Histrionicus histrionicus (Harlequin
Ducks) Wintering in Southern New England
Richard A. McKinney1,*, Scott R. McWilliams2,
and Michael A. Charpentier3
Abstract - Histrionicus histrionicus (Harlequin Ducks) that winter along the east coast
of North America are listed as a population of special concern in Canada, and they use
several coastal wintering sites in southern New England that are subject to varying
degrees of urbanization. We studied patterns of habitat use by Harlequin Ducks at 12
known wintering sites in southern New England. An average of 327 ± 114 Harlequin
Ducks were found at the sites during the winters of 2001–2003. More Harlequin Ducks
wintered at sites south of Cape Cod, MA that had greater mollusk (709,133 ± 504,568
versus 97,154 ± 72,427 kcal ha-1) and crustacean (27,907 ± 16,312 versus 1412 ± 1675
kcal ha-1) prey energy density, and a higher index of hunting activity (2.4 ± 1.2 versus 1.4
± 0.5) than sites to the north. We used logistic regression analysis at 12 sites inhabited by
Harlequin Ducks and 12 nearby sites of similar geomorphology that did not support
Harlequin Ducks to identify habitat characteristics that best explained their distribution
in southern New England. Our analysis identified two habitat characteristics that
affected the likelihood a site was used by Harlequin Ducks: 1) the proportion of
residential, commercial, and industrial land use within a 100-m radius of the perimeter
of the site; and 2) distance to the nearest Harlequin Duck wintering site. However, other
factors, including those related to their extremely low population size, need to also be
considered as recommendations are developed for the conservation of east coast
Harlequin Ducks.
Introduction
Histrionicus histrionicus Linnaeus (Harlequin Ducks) are sea ducks
that breed in remote stream reaches and frequent turbulent coastal marine
habitats in winter. Two of the four populations of Harlequin Ducks are
found in North America (CWS 1997), and declines were noted in the
eastern Canadian population by the late 1980s. Recognition of these declines
led to their being designated as endangered by the Committee on
the Status of Endangered Wildlife in Canada in 1990, and subsequently
down-graded to a “species of special concern” upon reevaluation in 2001.
Harlequin Ducks were added to Canada’s Species at Risk Act in 2003 (P.
Thomas, Canadian Wildlife Service, Mount Pearl, NL, Canada, pers.
1US Environmental Protection Agency, Office of Research and Development, National
Health and Environmental Effects Research Laboratory, Atlantic Ecology
Division, 27 Tarzwell Drive, Narragansett, RI 02882. 2Department of Natural Resources
Science, University of Rhode Island, Kingston, RI 02881. 3Computer Sciences
Corporation, 27 Tarzwell Drive, Narragansett, RI 02882. *Corresponding
author - mckinney.rick@epa.gov.
160 Northeastern Naturalist Vol. 14, No. 2
comm.). These listings highlight the need for studies examining
Harlequin Duck behavior and ecology on both their breeding and wintering
grounds (Robertson and Goudie 1999).
Research priorities for the conservation of North American Harlequin
Ducks include documenting the impact of human activity and disturbance
near their wintering grounds (Robertson and Goudie 1999). Harlequin
Ducks may be particularly vulnerable while concentrated on their wintering
grounds, where even small, localized disturbances can affect substantial
portions of the population (Goudie and Ankney 1986). Threats to wintering
Harlequin Ducks include over-harvesting, oil spills, and, particularly in
urban areas, loss of habitat caused by development. In addition to investigations
into the impacts of direct human disturbance such as hunting and oil
spills (Esler et al. 2000b, 2002; Lance et al. 2001), several studies have
examined winter habitat use by North American Harlequin Ducks in relation
to location, site morphology, and food availability (Esler et al. 2000a,
Goudie and Ankney 1988, Mittlehauser et al. 2002). However, no studies
have examined the impact of human activity adjacent to Harlequin Duck
wintering grounds, even though significant numbers of Harlequin Ducks
winter in areas that are increasingly under pressure from urbanization.
In this study, we examined patterns of habitat use by Harlequin Ducks
wintering in southern New England, an area characterized by widespread
coastal development that is host to about one fifth of the estimated 1800
Harlequin Ducks wintering on the east coast of North America
(Mittlehauser 2000, Montevecchi et al. 1995). Our primary objective was
to identify habitat characteristics that are associated with the distribution
and abundance of Harlequin Ducks during winter in southern New England.
We compared characteristics between sites inhabited during winter
by Harlequin Ducks and nearby sites with similar geomorphology that do
not support wintering Harlequin Ducks. We also compared Harlequin Duck
abundance and habitat characteristics to the north and south of Cape Cod,
MA, traditionally considered a dividing line for the southern New England
marine environment (Roman et al. 2000). Differences in wintering-site use
to the north and south of the Cape could have consequences for Harlequin
Duck conservation since southern sites are often subject to increased development
pressures.
Methods
Study sites
Our study sites included twelve locations from Cape Ann, MA to Point
Judith, RI known to regularly support at least four Harlequin Ducks during
winter (Fig. 1). In order to compare characteristics of used and unused
sites ,we included an additional 12 nearby sites of similar area and geomorphology
at which wintering Harlequin Ducks were not regularly observed.
The criteria for determining that a site was not used by Harlequin Ducks
were 1) no ducks were present during surveys, and 2) there was no evidence
2007 R.A. McKinney, S.R. McWilliams, and M.A. Charpentier 161
of past use by more than 2 Harlequin Ducks during repeated observations by
avian ecologists familiar with the survey areas (W. Petersen and S. Perkins,
Massachusetts Audubon, Lincoln, MA, pers. comm.). The study sites consisted
of rocky headlands, shallow coves, or sand beaches. In all cases, we
delineated the sites using natural breaks in the topography of the site: a line
drawn from shoreline to shoreline on either side of the peninsula for rocky
headlands; a line drawn through the cove mouth for shallow coves; and for
sandy beach areas, a line drawn perpendicular to the shoreline at a feature
such as a natural or man-made jetty or rock outcropping beyond which
Harlequin Ducks were not observed. All sites were similar in mean water
depth (range 0.9–8.1 m [mean low water]; mean = 3.8 m), and shoreline
length (range 0.4–4.8 km; mean = 1.3 km).
Waterfowl surveys
Harlequin Duck abundances for Massachusetts sites (Fig. 1) were from
single surveys during the winters of 2001–2002 and 2002–2003 using a 32–
60x spotting scope or through 10 x 50 binoculars from a vantage point or
points from which the entire surface of the site could be viewed. Abundances
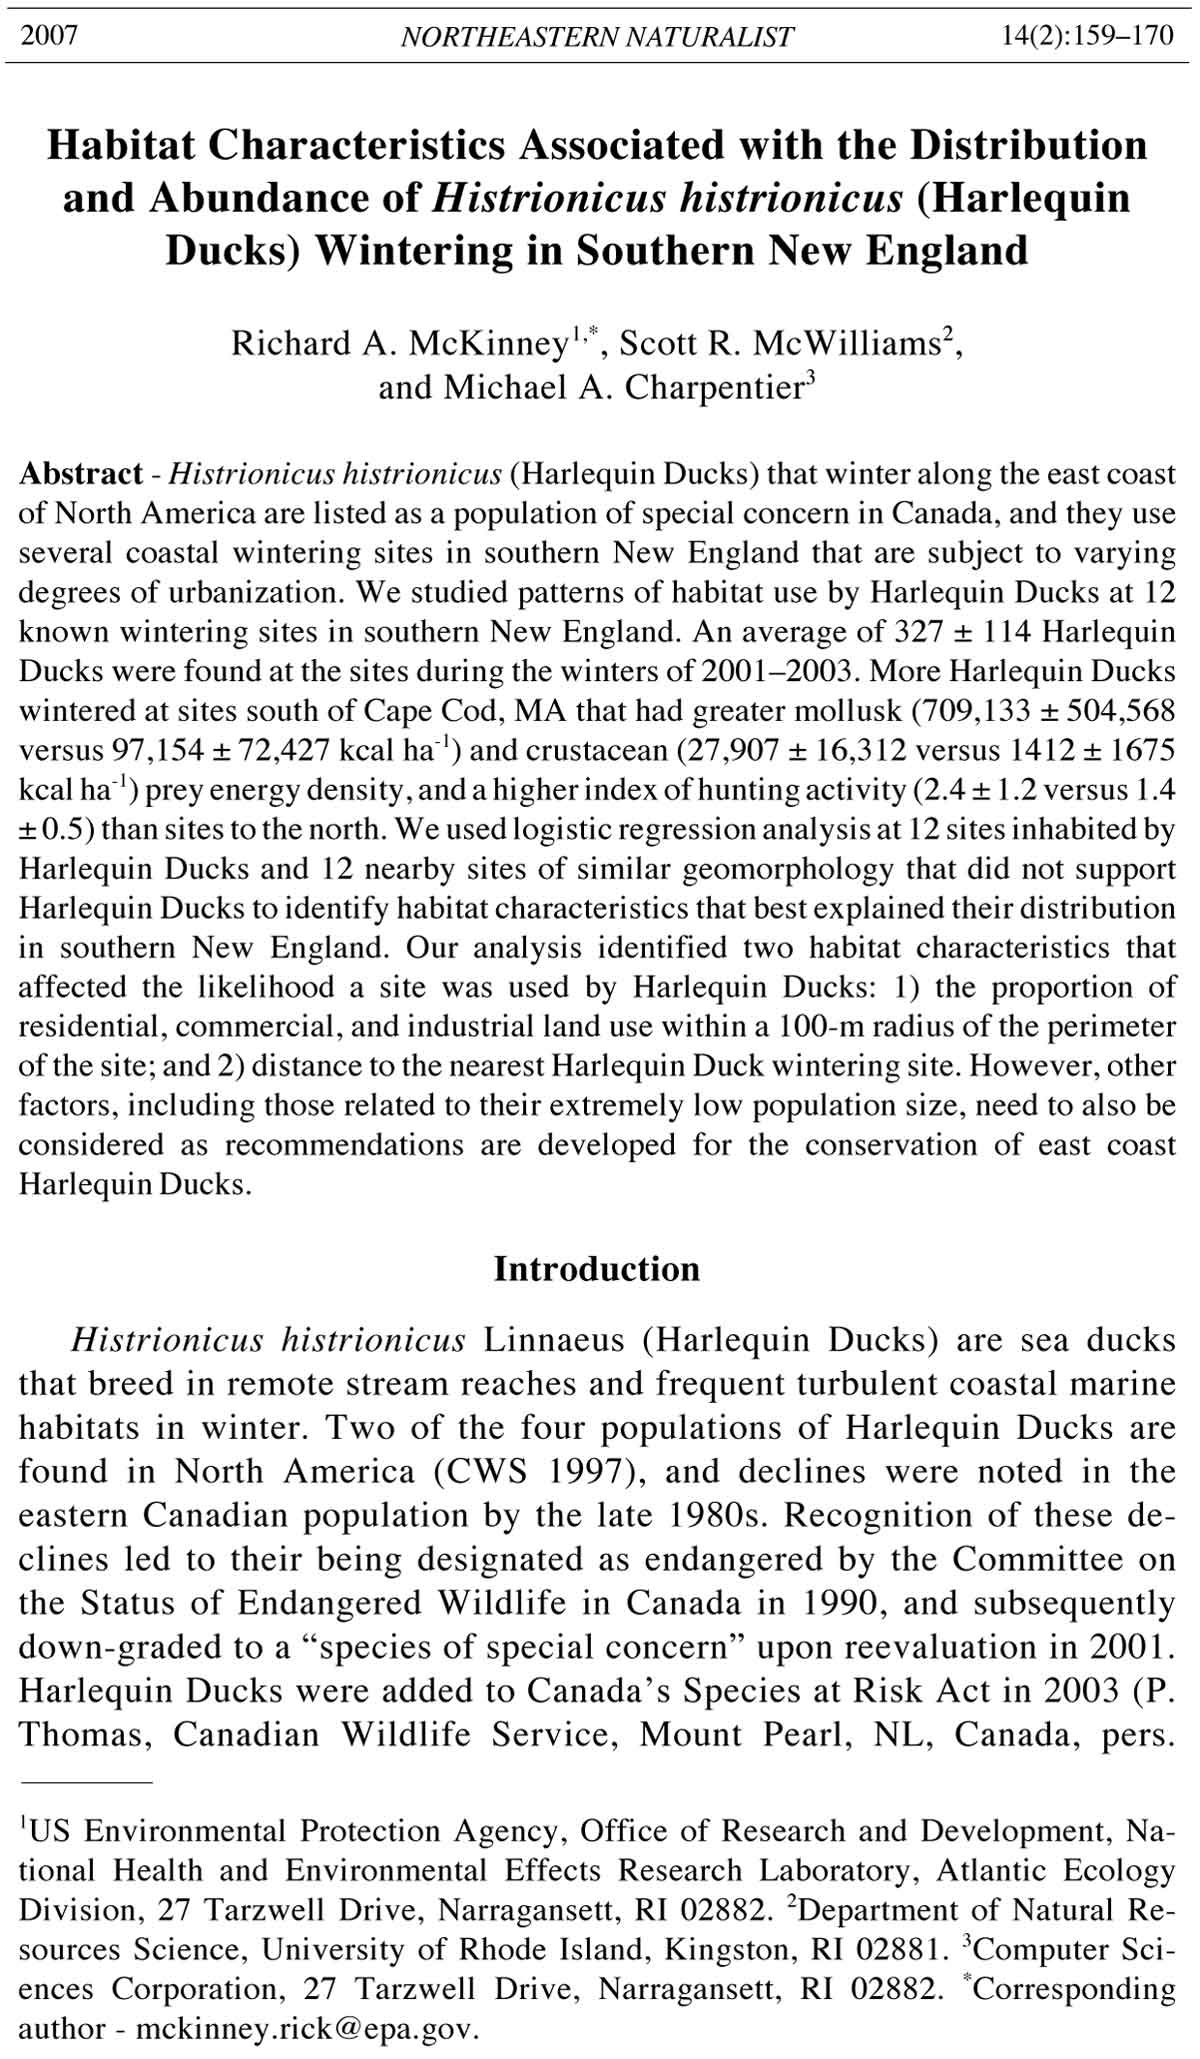
Figure 1. Location of 12
southern New England
Harlequin Duck wintering
sites, 2001–2003,
and 12 unused sites chosen
for habitat comparison.
Presence and absence
refer to winter use
by Harlequin Ducks. 1
= Hodgkins Cove, 2 =
Lanes Cove, 3 = Folly
Point, 4 = Halibut Point,
5 = Andrews Point, 6 =
Cathedral Ledge, 7 =
Gull Point, 8 = Gap
Cove, 9 = The Glades,
10 = Minot Beach, 11 =
Lighthouse Point, 12 =
Standish Road, 13 =
Sankety Head, 14 =
Squam Head, 15 = West
Jetty, 16 = Eel Point,
17 = Squibnocket, 18 =
Gay Head, 19 = Warren
Point, 20 = Sakonnet
Point, 21 = Sachuest
Point, 22 = Beavertail
Point, 23 = Bonnet
Point, 24 = Point Judith.
162 Northeastern Naturalist Vol. 14, No. 2
for Rhode Island sites were calculated from census data collected during the
winters (November through April) of 2001–2003. Bimonthly censuses at
sites were performed on randomly chosen days and at randomly chosen
times of day.
Habitat characteristics
Habitat characteristics were developed using geographic information
system (GIS) topographic databases. The GIS data (e.g., shorelines, land
use, and land cover) were obtained from the Rhode Island (RIGIS) and
Massachusetts (MassGIS) geographic information systems and were processed
using Environmental Systems Research Institute (ESRI) ARC GIS
software (Redlands, CA). Shoreline data were derived from 15-minute
(1:24,000 scale) United States Geological Survey (USGS) topographic
maps. Land-use and land-cover data were developed from 1995 aerial
photography (1:24,000 scale) coded to Anderson modified level 3 (Anderson
et al. 1976) to one-half acre minimum polygon resolution. Shoreline
data were used to determine linear shoreline length. In order to calculate
surrounding land use, we first delineated a 100-m buffer adjacent to a site
by drawing a 100-m wide polygon parallel and upland of the shoreline, or
high-water mark. We then used land-use and land-cover data from within
the buffer to calculate the percent vegetated land (open land, forested, and
wetland) and developed land. Developed land (DEVL) included the landuse
categories residential, commercial, and industrial land. We chose a
100-m buffer because development and resultant human activity near the
shoreline could potentially influence resident Harlequin Ducks. We measured
the direct distance in km from the center of a site to the nearest
stream mouth (NSTR) and to the center of the nearest adjacent site where
Harlequin Ducks were present (NWFS). An intertidal slope estimate for
each site (ITSL) was determined by first using bathymetry data for each
site to generate a 2-m depth contour. The area between the shoreline of
each site and the 2-m depth contour was calculated and then divided by
the shoreline length. This provided a mean distance to the 2-m depth
contour. By dividing the mean distance into the 2-m depth, a mean value
of slope was estimated. To determine a fetch value for each site (FETC),
the grid module of Arc Info was utilized. The grid module includes a
visibility tool that uses an elevation model to determine what is visible
from a given location. By using an elevation model of each site that
included the ocean as a flat area, the open ocean area that is visible from
the shoreline of each site was determined. Fetch was calculated as the area
of an arc that consists of open ocean area, described by the shoreline of
the site projected out to 15 km. Fetch can be considered a surrogate for
potential wave exposure; greater fetch represents greater open ocean exposure
and hence greater potential for wave exposure. All habitat
characteristics were determined from archived data; therefore, only one
measurement was made of each characteristic, and these values were used
in constructing habitat models.
2007 R.A. McKinney, S.R. McWilliams, and M.A. Charpentier 163
We used intertidal quadrat sampling to measure the abundance of benthic
invertebrates that could serve as prey for Harlequin Ducks. Three 75-m
transects were laid out parallel to the shoreline within the intertidal zone at
each site. The transect location both horizontally (i.e., its starting point within
the intertidal zone of the site) and vertically (i.e., its relative position with
respect to the mean low-water and mean high-water lines) was chosen using a
probability-based random sampling protocol (Paul et al. 2003). Three 1-m2
quadrats were placed equidistant along each transect, and all invertebrates
were removed by hand or with a trowel if heavily encrusted with barnacles and
macroalgae. Invertebrate samples and barnacle assemblages were passed
through a 0.5-mm sieve and immediately sorted, counted, and measured.
Macroalgae–consisting primarily of rockweeds Fucus spp. and Ascophyllum
mackaii (Linnaeus), but occasionally Chondrus crispus (Linnaeus) J.
Stackhouse (Irish moss)–within the quadrats was sampled by first moving the
macroalgae to a container partially filled with seawater. Approximately 5
drops of a 10% formalin solution was then added to the container, mixed, and
allowed to settle for 2 minutes. Invertebrates, consisting mostly of amphipods
and isopods that escaped from the macroalgae, were then captured by sieving
and were sorted and counted as above. Biomass of available soft tissue for
each was calculated using existing allometric length-weight relationships. We
calculated productivity at each site using known productivity-to-biomass
relationships (Robertson 1979), and used these values along with speciesspecific
tissue-energy densities to estimate energy density (McKinney et al.
2004). Species were aggregated by phylum to calculate available crustacean
energy density (PREC), available mollusk energy density (PREM), and all
available prey energy density (PREY).
An index of waterfowl hunting (HUNT; range: 1–5) was developed for
each of the sites using the best available data on hunting trends for the Rhode
Island sites (C. Allin, Rhode Island Division of Fish and Wildlife, West
Kingston, RI, pers. comm.), observations made during sampling events, and
input from avian ecologists familiar with the survey areas (W. Petersen and S.
Perkins, pers. comm.). Sites at which waterfowl hunting was prohibited by
state waterfowl hunting regulations were assigned an index value of 1. Those
at which hunting was allowed, but which had only occasional hunting activity
documented, were assigned a value of 3. Sites where hunting was allowed and
regular hunting activity had been documented and observed during waterfowl
census events were assigned a value of 5. Other sites were assigned intermediate
values depending on the level and documentation of hunting activity.
Statistical analysis and model development
We used logistic regression analysis (Hosmer and Lemeshow 2000) to
determine which habitat characteristics were most important in explaining
distribution of Harlequin Ducks. For logistic regression analysis, we used a
case-control sampling design that included the 12 known Harlequin Duck
winter habitats and an additional 12 nearby sites of similar area and geomorphology
that did not support Harlequin Ducks (Keating and Cherry 2005). The
164 Northeastern Naturalist Vol. 14, No. 2
following variables were used for this analysis: nearest Harlequin Duck site
(NWFS), fetch (FETC), intertidal slope (ITSL), prey density (PREY), distance
to the nearest stream mouth (NSTR), and proportion of residential,
commercial, and industrial land use within a 100-m radius of the perimeter of
the site (DEVL). Since we were using logistic regression as an exploratory
technique to try to identify habitat characteristics that might be important in
determining harlequin distribution, we relaxed the significance criteria for
entry of variables into the model to = 0.1. Results were reported only
for variables that entered the model.
Analysis of variance (ANOVA) and Student’s t-tests were used to test
for differences in harlequin abundance between northern and southern sites.
For this analysis, we used mollusk and crustacean prey energy density
(PREM, PREC), the index of waterfowl hunting (HUNT), nearest Harlequin
Duck site (NWFS), and intertidal slope (ITSL) as independent variables, and
Harlequin Duck abundance as the dependent variable. Harlequin abundance
and prey energy densities are reported as means ± standard deviation.
Statistical analyses were performed with SAS for Windows ver. 6.12 (Carey,
NC).
Results
We observed on average 327 Harlequin Ducks per year at our study sites
during the winters of 2001–2004 (Table 1). More Harlequin Ducks were
found at sites south of Cape Cod (196 ± 61 ducks per site per year) than at
those north of the Cape (130 ± 53 ducks per site per year; t5 = 2.02, P =
0.027). Southern sites had both the highest (Squibnocket, 79.9 ± 15.2 ducks
per site per year) and lowest (Sakonnet Point, 5.4 ± 5.5 ducks per site per
year) mean abundance.
Table 1. Abundance (number of ducks per site per year ± SD) of Harlequin Ducks at southern
New England wintering sites, 2001–2003.
Harlequin Duck abundance
Site Location 2001–2002 2002–2003 Mean 2001–2003
Folly PointA North 6 12 8.9 ± 4.1
Halibut PointA North 67 51 59.0 ± 11.3
Andrews PointA North 11 7 9.1 ± 2.8
Cathedral LedgeA North 34 14 24.0 ± 14.1
The GladesA North 13 17 15.0 ± 2.8
Minot BeachA North 19 9 14.0 ± 7.1
Sankety HeadA South 19 35 27.1 ± 11.3
West JettyA South 12 29 20.5 ± 12.0
SquibnocketA South 69 91 79.9 ± 15.6
Sakonnet PointB South 6.8 ± 11.0 4.0 ± 4.2 5.4 ± 5.5
Sachuest PointB South 47.0 ± 12.9 51.9 ± 9.0 49.4 ± 11.0
Beavertail PointA South 1 20 10.5 ± 13.4
Total all sites 327.0 ± 114
An = 1 census per year
Bn = 12 censuses per year
2007 R.A. McKinney, S.R. McWilliams, and M.A. Charpentier 165
Sites to the south of Cape Cod had greater prey energy density of
mollusks (392,260 ± 251,998 versus 87,868 ± 76,424 kcal ha-1; ANOVA: df
= 1, F = 8.50, p = 0.02) and crustaceans (31,605 ± 20,304 versus 512 ± 7819
kcal ha-1; ANOVA: df = 1, F = 14.1, p = 0.003), and a higher index of hunting
activity (2.3 ± 1.4 versus 1.3 ± 0.5; ANOVA: df = 1, F = 4.56, p = 0.04) than
sites to the north (Table 2). Also, southern sites had greater distances to
nearest Harlequin Duck sites (4.35 ± 2.39 versus 0.31 ± 0.80 km;
ANOVA:df = 1, F = 17.0, p = 0.002). Northern sites had higher mean
intertidal slopes than southern sites (0.051 ± 0.021 versus 0.024 ± 0.024;
ANOVA: df = 1, F = 4.05, p = 0.07).
Most habitat characteristics used in the logistic regression analysis were
quite variable (Table 3), and only two characteristics were significantly
related to presence/absence of Harlequin Ducks and so entered into the
model (Table 4): DEVL (proportion of residential, commercial, and industrial
land use within a 100-m radius of the perimeter of the site), and NWFS
(distance to the nearest Harlequin Duck wintering site in km). Wintering
sites with Harlequin Ducks were on average closer to other sites with
Harlequin Ducks (2.33 ± 2.66 km) and had less developed land nearby (38.6
± 28.1%) than wintering sites without Harlequin Ducks (3.40 ± 3.49 km,
67.2 ± 31.6%, respectively) (Table 3).
Discussion
Along the northeast coast of the US, Cape Cod has traditionally been
considered a dividing line for the marine environment, with different distributions
of benthic and pelagic species often reported north and south of the
Cape (Roman et al. 2000). Within our southern New England study area
(i.e., from Cape Ann, MA to Narragansett Bay, RI), we found that more
Table 2. Habitat and landscape characteristics for wintering sites used by Harlequin Ducks to
the north and south of Cape Cod, MA in southern New England during 2001–2003. Location =
whether the site is to the north (N) or south (S) of Cape Cod; PREM = energetic content of
invertebrate mollusk prey in kcal per hectare; PREC = energetic content of invertebrate
crustacean prey in kcal per hectare; HUNT = index of hunting activity; NWFS = nearest
Harlequin Duck wintering site; ITSL = intertidal slope (%). Values for PREM and PREC are
means ± SD.
Site Location PREM PREC HUNT NWFS ITSL
Folly Point N 38,995 ± 17,745 227 ± 163 2.0 0.010 0.073
Halibut Point N 76,447 ± 50,509 445 ± 180 2.0 0.010 0.049
Andrews Point N 71,739 ± 34,434 418 ± 178 1.0 0.208 0.065
Cathedral Ledge N 154,686 ± 98,063 901 ± 454 1.0 0.419 0.063
The Glades N 58,623 ± 23,003 341 ± 204 1.0 0.591 0.036
Minot Beach N 126,719 ± 69,695 738 ± 310 1.0 0.590 0.017
Sankety Head S 762,368 ± 71,668 61,425 ± 3482 2.0 3.689 0.066
West Jetty S 630,239 ± 23,409 50,779 ± 2234 2.0 7.567 0.002
Squibnocket S 298,102 ± 141,382 24,018 ± 1014 2.0 6.838 0.012
Sakonnet Point S 323,805 ± 150,216 26,089 ± 1278 5.0 1.700 0.019
Sachuest Point S 94,941 ± 45,571 7649 ± 3400 1.0 4.081 0.020
Beavertail Point S 244,104 ± 23,409 19,668 ± 2234 2.0 2.242 0.020
166 Northeastern Naturalist Vol. 14, No. 2
Table 3. Habitat and landscape characteristics used in logistic regression analysis of winter-site use by Harlequin Ducks in southern New England during 2001–
2003. LENG = linear shoreline length in km; DEPT = water depth (mean low water) in m; NWFS = distance to nearest Harlequin Duck wintering site in km;
FETC = fetch in km2; ITSL = intertidal slope (%); PREY = energetic content of invertebrate prey in kcal per hectare; NSTR = distance to nearest freshwater
stream mouth in km; DEVL = proportion of residential, commercial, and industrial land use within a 100-m radius of the perimeter of the site. Sites are listed in
order from north to south corresponding to Figure 1. Values for PREY and for sites where Harlequin Ducks were present (P) and absent (A) are means ± SD.
Presence/
Site LENG absence NWFS FETC ITSL PREY NSTR DEVL
Hodgkins Cove 1.68 A 0.668 178 0.040 79,438 ± 39,293 0.000 0.506
Lanes Cove 1.60 A 0.013 253 0.045 32,102 ± 18,379 0.683 0.845
Folly Point 2.21 P 0.010 307 0.073 39,222 ± 18,563 0.000 0.620
Halibut Point 1.50 P 0.010 377 0.049 76,892 ± 34,522 0.240 0.044
Andrews Point 1.55 P 0.208 370 0.065 72,156 ± 44,573 1.013 0.306
Cathedral Ledge 1.52 P 0.419 221 0.063 155,587 ± 90,240 1.448 0.484
Gull Point 1.61 A 1.179 97 0.091 88,910 ± 61,266 0.562 0.978
Gap Cove 1.32 A 2.102 281 0.076 97,788 ± 53,783 0.658 0.969
The Glades 1.41 P 0.591 310 0.036 58,964 ± 30,661 2.493 0.216
Minot Beach 1.06 P 0.590 216 0.017 127,457 ± 54,362 2.579 0.944
Lighthouse Point 1.74 A 1.600 110 0.010 29,371 ± 12,923 1.376 0.663
Standish Road 1.25 A 1.600 287 0.010 106,519 ± 54,249 2.722 0.955
Sankety Head 1.12 P 3.689 311 0.066 823,793 ± 353,595 4.604 0.432
Squam Head 1.14 A 3.689 299 0.054 1,391,701 ± 859,691 3.260 0.847
West Jetty 1.70 P 7.567 256 0.002 681,017 ± 493,972 3.099 0.726
Eel Point 2.09 A 7.567 275 0.012 316,938 ± 229,889 10.948 0.159
Squibnocket 2.04 P 6.838 381 0.012 322,121 ± 193,272 0.000 0.056
Gay Head 1.85 A 6.838 449 0.011 591,371 ± 286,121 0.279 0.270
Warren Point 1.14 A 1.700 337 0.019 1,811,075 ± 923,648 0.378 0.686
Sakonnet Point 2.01 P 1.700 322 0.007 349,894 ± 164,450 1.323 0.425
Sachuest Point 2.51 P 4.081 277 0.020 102,590 ± 55,799 0.127 0.059
Beavertail Point 2.59 P 2.242 282 0.039 263,772 ± 134,337 1.991 0.325
Bonnet Point 1.39 A 2.242 114 0.029 910,619 ± 427,991 1.717 0.985
Point Judith 1.67 A 11.651 494 0.016 859,493 ± 403,880 3.647 0.199
Present 1.77 ± 0.50 2.329 ± 2.664 303 ± 56 0.037 ± 0.026 256,122 ± 255,505 1.576 ± 1.438 0.386 ± 0.281
Absent 1.54 ± 0.30 3.404 ± 3.485 288 ± 121 0.034 ± 0.027 526,277 ± 599,117 2.185 ± 3.017 0.672 ± 0.316
2007 R.A. McKinney, S.R. McWilliams, and M.A. Charpentier 167
Harlequin Ducks wintered at sites south of Cape Cod and that these sites had
greater prey energy density and lower intertidal slopes, which may make the
benthic prey more accessible to foraging Harlequin Ducks. Thus, availability
of good-quality foraging areas may in part explain the large-scale
patterns of Harlequin Duck abundance in southern New England. However,
we also found that sites south of Cape Cod had increased hunting activity,
and greater distances between wintering sites. It is possible that Harlequin
Ducks are enduring the costs (e.g., increased migration, higher disturbance)
of wintering at more southerly sites in order to take advantage of more
abundant and accessible prey.
The cumulative abundance of Harlequin Ducks reported at the 12 southern
New England coastal wintering sites in our study (213–441 birds per
year) comprised 12–25% of the estimated population of 1800 ducks wintering
along the east coast of North America (Mittelhauser et al. 2002, Vickery
1988). Sites where Harlequin Ducks were present in southern New England
averaged 38.6% developed land within a 100-m radius of the shoreline, and
the amount of developed land significantly influenced the distribution of
Harlequin Ducks. Several recent studies examined the effects of increasing
urbanization on breeding-bird species diversity and species composition
(Jokimaki and Kaisanlahti- Jokimaki 2003, Melles et al. 2003, Salvati 2003);
however, few studies have examined the effects of urbanization on waterfowl
abundance. In our study, we used adjacent land use as a surrogate for
urbanization and human disturbance, with the expectation that as urban land
use increases, the potential for human disturbance (e.g., boat traffic, humans
and pets walking the shoreline) in close proximity to wintering Harlequin
Ducks also increases at a given site. We found that the presence of
Harlequin Ducks at a given site was negatively influenced by the extent of
developed land within a 100-m radius of the site. Thus, Harlequin Ducks that
winter in southern New England are exposed and apparently respond to
impacts from human disturbance.
In southern New England, Harlequin Ducks appear to exclusively use
narrowly defined winter habitats year after year, a phenomena that may be
related to the extremely high rates of site fidelity or philopatry shown to
wintering and breeding sites by this species (Iverson et al. 2004; Robertson
et al. 1999, 2000). We found relatively similar numbers of Harlequin Ducks
Table 4. Results of logistic regression analysis of Harlequin Duck abundance at southern New
England wintering sites and adjacent sites with similar geomorphology using presence/absence as
the dependent variables and additional habitat and landscape characteristics from Table 3. NWFS
= distance to nearest Harlequin Duck wintering site in km; DEVL = proportion of residential,
commercial, and industrial land use within a 100-m radius of the perimeter of the site.
Standard Wald Prob > Odds-ratio 95% Wald
Site dF Estimate error chi-square chi-square estimate confidence limits
Intercept 1 3.70 1.63 5.20 0.022 — — —
NWFS 1 -0.364 0.206 3.12 0.077 0.69 0.46 1.04
DEVL 1 -0.498 0.209 5.65 0.017 0.61 0.40 0.92
168 Northeastern Naturalist Vol. 14, No. 2
between years at each site, although our analysis also showed that the
likelihood of Harlequin Ducks being present at a site decreased with distance
to the nearest occupied Harlequin Duck wintering site. This indicates
that wintering Harlequin Ducks may prefer sites that are near other sites with
Harlequin Ducks. Other birds are attracted to conspecifics, although this
may lead to increased intra-specific competition (Davoren et al. 2003, Reed
and Dobson 1993, Silverman et al. 2004). If true for Harlequin Ducks, then
they may use conspecifics as indicators of habitat quality and so are attracted
to wintering sites with other ducks, only to be displaced through intraspecific
competition to nearby sites of suitable but lower quality habitat
(Alonso et al. 2004).
Our findings have several implications for the management and conservation
of wintering Harlequin Ducks in southern New England. First, given the
negative effect of development on the presence of Harlequin Ducks at wintering
sites, further development near currently used wintering sites should be
limited. Second, our finding that proximity to nearby occupied sites may
be influencing habitat selection of Harlequin Ducks during winter suggests
that maintaining nearby clusters of suitable coastal wintering sites is important.
Given the difficulty of accurately assessing habitat selection of small
populations such as the east coast Harlequin Ducks (Greene and Stamps
2001), we encourage further studies to determine if these patterns are also
evident when and where Harlequin Duck populations are more dense.
Acknowledgments
We would like to thank Wayne Petersen and Simon Perkins for assistance with
identifying Massachusetts Harlequin Duck wintering sites and providing access to
abundance data. We also thank Glen Mittelhauser for insightful discussions on east
coast wintering Harlequin Ducks, and Jim Heltshe for advice and interpretation of
logistic regression analysis results. Charlie Allin provided information about waterfowl
hunting patterns in Narragansett Bay. We thank Peter Paton, Frank Golet, and
Kathleen Melanson for reviewing and providing insightful comments on an earlier
draft of the manuscript. Mention of trade names or commercial products does not
constitute endorsement or recommendation. Although the research described in this
article has been funded wholly by the US Environmental Protection Agency, it has
not been subjected to Agency-level review. Therefore, it does not necessarily reflect
the views of the Agency. This paper is the Office of Research and Development,
National Health and Environmental Effects Research Laboratory, Atlantic Ecology
Division contribution number AED-06-024.
Literature Cited
Alonso, J.C., C.A. Martin, J.A. Alonso, C. Palacin, M. Magana, and S.J. Lane. 2004.
Distribution dynamics of a great bustard metapopulation throughout a decade:
Influence of conspecific attraction and recruitment. Biodiversity and Conservation
13:1659–1674.
Anderson, J.R., E.E. Hardy, J.T. Roach, and R.W. Whitmer. 1976. A land-use and
land-cover classification system for use with remote-sensor data. Geological
Survey Professional Paper 964. US Geological Survey, Washington, DC.
2007 R.A. McKinney, S.R. McWilliams, and M.A. Charpentier 169
Canadian Wildlife Service (CWS). 1997. Conservation issues for North American
sea ducks. A concept paper for a sea duck joint venture under the North American
Waterfowl Management Plan. Canadian Wildlife Service (in cooperation with
US Fish and Wildlife Service, and US Geological Survey - Biological Sciences
Division), Gatineau, Quebec, Canada.
Davoren, G.K., W.A. Montevecchi, and J.T. Anderson. 2003. Distributional patterns
of a marine bird and its prey: Habitat selection based on prey and conspecific
behaviour. Marine Ecology Progress Series 256:229–242.
Esler, D., T.D. Bowman, T.A. Dean, C.E. O’Clair, S.C. Jewett, and L.L. McDonald.
2000a. Correlates of Harlequin Duck densities during winter in Prince William
Sound, Alaska. Condor 102:920–926.
Esler, D., J.A. Schmutz, R.L. Jarvis, and D.M. Mulcahy. 2000b. Winter survival of
adult female Harlequin Ducks in relation to history of contamination by the
Exxon Valdez oil spill. Journal of Wildlife Management 64:839–847.
Esler, D., T.D. Bowman, K.A. Trust, B.E. Ballachey, T.A. Dean, S.C. Jewett, and
C.E. O’Clair. 2002. Harlequin Duck population recovery following the Exxon
Valdez oil spill: Progress, process, and constraints. Marine Ecology Progress
Series 241:271–286.
Goudie, R.I., and C.D. Ankney. 1986. Body size, activity budgets, and diets of sea
ducks wintering in Newfoundland. Ecology 67:1475–1482.
Goudie, R.I., and C.D. Ankney. 1988. Patterns of habitat use by sea ducks wintering
in southeastern Newfoundland, Canada. Ornis Scandanavica 19:249–256.
Greene, C.M., and J.A. Stamps. 2001. Habitat selection at low population densities.
Ecology 82:2091–2100.
Hosmer, D.W., and S. Lemeshow. 2000. Applied Logistic Regression, 2nd Edition. J.
Wiley and Sons. New York, NY. 378 pp.
Iverson, S.A., D. Esler, and D.J. Rizzolo. 2004. Winter philopatry of Harlequin
Ducks in Prince William Sound, Alaska. Condor 106:711–715.
Jokimaki, J., and M.L. Kaisanlahti-Jokimaki. 2003. Spatial similarity of urban bird
communities: A multiscale approach. Journal of Biogeography 30:1183–1193.
Keating, K.A., and S. Cherry. 2005. Use and interpretation of logistic regression in
habitat-selection studies. Journal of Wildlife Management 68:774–789.
Lance, B.K, D.B. Irons, S.J. Kendall, and L.L. McDonald. 2001. An evaluation of
marine bird population trends following the Exxon Valdez oil spill, Prince William
Sound, Alaska. Marine Pollution Bulletin 42:298–309.
McKinney, R.A., S.M. Glatt, and S.R. McWilliams. 2004. Allometric length-weight
relationships for benthic prey of aquatic wildlife in coastal marine habitats.
Wildlife Biology 10:241–249.
Melles, S., S. Glenn, and K. Martin. 2003. Urban bird diversity and landscape
complexity: Species-environment associations along a multiscale habitat gradient.
Conservation Ecology 7:271–279.
Mittelhauser, G.H. 2000. The winter ecology of Harlequin Ducks in coastal Maine.
M.Sc. Thesis. University of Maine, Orono, ME. 131 pp.
Mittelhauser, G.H., J.B. Drury, and P.O. Corr. 2002. Harlequin Ducks (Histrionicus
histrionicus) in Maine, 1950–1999. Northeastern Naturalist 9:163–182.
Montevecchi, W.A., A. Bourget, J. Brazil, R.I. Goudie, A.E. Hutchinson, B.C.
Johnson, P. Kehoe, P. Laporte, M.A. McCollough, R. Milton, and N. Seymour.
1995. National recovery plan for the Harlequin Duck in eastern North America.
Report No. 12. Recovery of Nationally Endangered Wildlife Committee. Ottawa,
ON, Canada. 30 pp.
170 Northeastern Naturalist Vol. 14, No. 2
Paul, J.F., J.L. Copeland, M.A. Charpentier, P.V. August, and J.W. Hollister. 2003.
Overview of GIS applications in estuarine monitoring and assessment research.
Marine Geodesy 26:63–72.
Reed, J.M., and A.P. Dobson. 1993. Behavioural constraints and conservation biology:
Conspecific attraction and recruitment. Trends in Ecology and Evolution
8:253–256.
Robertson, A.I. 1979. The relationship between annual production: Biomass ratios
and lifespans for marine macrobenthos. Oecologia 38:193–202.
Robertson, G.J., and R.I. Goudie 1999. Harlequin Duck (Histrionicus histrionicus).
No. 466, In A. Poole, and F. Gill (Eds.). The Birds of North America. The Birds
of North America, Inc. Philadelphia, PA. 32 pp.
Robertson, G.J., F. Cooke, R.I. Goudie, and W.S.Boyd. 1999. Within-year fidelity
of Harlequin Ducks to a moulting and wintering area. Pp. 44-50, In R.I. Goudie,
M.R. Petersen, and G.J. Robertson (Eds.). Behavior and Ecology of Sea Ducks.
Occasional Paper Number 100. Canadian Wildlife Service, Ottawa, ON,
Canada. 88 pp.
Robertson, G.J., F. Cooke, R.I. Goudie, and W.S. Boyd. 2000. Spacing patterns,
mating systems, and winter philopatry in Harlequin Ducks. Auk 117:299–307.
Roman, C.T., N. Jaworski, F.T. Short, S. Findlay, and R.S. Warren. 2000. Estuaries
of the northeastern United States: Habitat and land use signatures. Estuaries
23:743–764.
Salvati, L. 2003. Distribution and relative abundance of wintering birds in a Mediterranean
urban area: The influence of habitat variables. Biota 4:91–100.
Silverman, E.D., R.R. Veit, and G.A. Nevitt. 2004. Nearest neighbors as foraging
cues: Information transfer in a patchy environment. Marine Ecology Progress
Series 277:25–35.
Vickery, P.D. 1988. Distribution and population status of Harlequin Ducks
(Histrionicus histrionicus) wintering in eastern North America. Wilson Bulletin
100:119–126.

