2010 NORTHEASTERN NATURALIST 17(2):229–238
Do Trends in Muskrat Harvest Indicate Widespread
Population Declines?
Nathan M. Roberts1,* and Shawn M. Crimmins2
Abstract - Ondatra zibethicus (Muskrat) is one of the most widely distributed
furbearers in eastern North America. Anecdotal evidence suggests that Muskrats are
experiencing a regional decline in numbers, although little empirical evidence exists to
support this claim. Our objectives were to document temporal trends in Muskrat harvest
in eastern North America, and to use the relationship between harvest and pelt price to
infer potential trends in regional Muskrat populations. Muskrat harvest has declined by
approximately 75% since 1986 in eastern North America, despite a recent resurgence in
pelt prices. Recent harvest rates showed little correlation (r2 = 0.355–0.559) with current
or time-lagged pelt prices, despite large correlations (r2 = 0.785–0.823) between
pelt price and harvest from historic data (1948–1968). These results suggest that, at low
harvest levels, there is only a weak correlation between harvest and pelt price. These
results may be indicative of regional declines in Muskrat abundance, although future
research is needed to substantiate this hypothesis.
Introduction
Ondatra zibethicus L. (Muskrat) is one of the most widely distributed
and heavily harvested furbearers in North America (Boutin and Birkenholz
1987, Errington 1963). Muskrats occupy almost every type of freshwater
aquatic habitat in eastern North America and are often the dominant herbivore
in these systems (Erb and Perry 2003). As such, Muskrats are critical to
the structuring of marshland vegetation and chemical cycles (Connors et al.
2000, Weller 1981, Weller and Fredrickson 1973) and can often completely
restructure vegetative communities (Danell 1979, Smirnov and Tretyakov
1998). The influence of Muskrats on vegetative structure can affect invertebrate
communities (de Szalay and Cassidy 2001, Nelson and Kadlec 1984,
Nummi et al. 2006) as well as bird abundance (Kaminski and Prince 1981)
and diversity (Bishop et al. 1979). Muskrats can also serve as indicators of
ecosystem health by responding to various toxins and chemicals that commonly
degrade aquatic habitats (Erickson and Lindzey 1983, Halbrook et al.
1993, Stevens et al. 1997). Furthermore, Muskrat predation can reduce the
abundance of exotic species such as Dreissena polymorpha Pallas (Zebra
Mussel) (Sietman et al. 2003). As wetland loss becomes more prevalent
(Dahl 2000), maintenance of the remaining functioning wetland and aquatic
systems is of great importance to managers. As such, conserving viable
Muskrat populations may be of critical importance.
1Department of Natural Resources, 207 Fernow Hall, Cornell University, Ithaca, NY
14853. 2Department of Forest Management, 207 Forestry Building, University of
Montana, Missoula, MT 59812. *Corresponding author - nmr25@cornell.edu.
230 Northeastern Naturalist Vol. 17, No. 2
Muskrats are used in the wild fur trade and are managed as a game or
furbearer species in most jurisdictions (Erb and Perry 2003). As recently as
1992, fur trappers in the northeastern United States considered Muskrats
the most important of local furbearing species (International Association
of Fish and Wildlife Agencies 2005). Trappers have claimed that Muskrat
populations and distributions have been declining for over a decade. Numerous
anecdotal sources suggest that Muskrat densities have declined at sites
once inhabited by thriving populations and that little population expansion
has occurred into previously uninhabited areas, despite their ability to rapidly
colonize previously uninhabited areas (Hansen 1965, Matis et al. 1996,
Wood 1974). Similarly, wildlife managers have recorded substantial declines
in Muskrat harvests throughout the northeast United States and eastern Canada
(Northeast Fur Resources Technical Committee 2005). However, most
survey techniques for Muskrats are only feasible across small geographic
extents (e.g., Schooley and Branch 2005) and may not be useful for examining
large-scale population trends.
Fur harvest dynamics and the value of pelts are major factors influencing
fur harvest effort (Erickson 1981, Erickson and Sampson 1978). A positive
relationship between fur harvest and pelt prices is well documented for
species including Castor canadensis Kuhl (Beaver) (Bailey 1981), Martes
pennanti Erxleben (Fisher) (Powell 1993), and Lontra canadensis Schreber
(River Otter) (Chilelli et al. 1996). However, this relationship has not been
examined in Muskrats. If changes in Muskrat harvests are merely an artifact
of changing market conditions, it would be logical to assume a correlation
between pelt price and harvest. Conversely, if changes in Muskrat harvests
are reflective of underlying population fluctuations, we would not expect to
see as strong a correlation between harvests and pelt prices. Because of the
relationship between pelt price and fur harvest, the use of pelt prices to model
furbearer populations and harvest dynamics is common (e.g., Scognamillo
and Chamberlain 2006). The objectives of our study were to 1) document
Muskrat harvest trends in the northeastern United States and eastern Canada,
2) examine the relationship between Muskrat harvest and pelt price during
the past 20 years, and 3) examine historical relationships between Muskrat
harvest and pelt price between 1948 and 1968.
Materials and Methods
We obtained annual Muskrat harvest data from 1986–2006 (hereafter
referred to as contemporary data), when available, from three jurisdictions
in eastern Canada (New Brunswick, Ontario, and Quebec) and nine jurisdictions
in the northeastern United States (Connecticut, Massachusetts, Maine,
New Jersey, New Hampshire, Pennsylvania, Rhode Island, Vermont, Virginia,
and West Virginia) (Table 1). Harvest data beyond the 1996/1997 season
for Massachusetts were excluded from analysis because trapping activity
since this season was severely affected by legislative actions. Historical
Muskrat harvest data (1948–1968) were acquired from five jurisdictions for
2010 N.M. Roberts and S.M. Crimmins 231
Table 1. Annual Muskrat harvest from 1986/1987–2004/2005 trapping seasons by jurisdiction.
Year CT MA NB NJ NH ON PA RI VA VT WV QC
1986 10,893 28,404 22,915 199,056 6115 540,106 440,880 1337 64,579 * 34,397 322,643
1987 11,179 28,656 18,229 184,805 6871 491,067 346,558 1211 63,464 * 34,643 307,396
1988 5024 13,780 27,859 177,402 5809 172,715 229,958 728 * * 13,234 113,335
1989 3033 19,958 12,074 126,807 3746 95,143 141,577 284 13,080 * 6669 81,838
1990 3686 13,519 12,037 66,349 2381 65,965 112,358 473 15,734 2117 4692 59,658
1991 3754 12,517 17,226 72,909 3886 50,564 156,014 442 21,961 3308 11,148 58,078
1992 3226 9474 16,028 78,228 2525 84,344 135,533 461 10,380 2632 7074 45,978
1993 1710 9595 17,396 42,274 2273 87,687 121,657 367 14,832 4442 5661 80,076
1994 4512 11,341 23,075 56,737 4389 83,069 178,145 472 21,353 4647 8419 102,209
1995 3159 7,873 22,306 82,506 2731 65,432 130,442 356 7010 2002 4233 9103
1996 3104 7,062 29,650 74,837 2976 124,877 146,013 417 23,925 9475 9440 11,547
1997 3222 712 39,386 81,351 3980 97,365 216,066 454 20,045 11,218 7474 13,648
1998 2767 1017 28,617 66,732 3517 85,316 148,205 512 3888 7389 2833 10,593
1999 1568 747 22,063 33,185 1714 63,820 94,215 243 9673 4010 1734 7377
2000 2443 667 17,064 70,882 2137 60,054 79,880 275 18,343 4351 2857 7214
2001 3022 917 23,472 49,590 3604 95,574 121,994 283 11,743 4420 5785 13,702
2002 1347 649 19,306 36,402 1453 59,670 75,340 216 7739 3355 4160 10,805
2003 2249 1419 19,741 56,413 1929 57,106 71,368 177 9683 2415 3210 38,539
2004 1966 1063 20,121 39,208 2396 53,553 * 197 8654 4219 2523 43,608
2005 * * * 34,465 * 68,215 70,995 * 8451 3097 * *
2006 * * * 33,747 * 84,107 121,167 * 10,308 5802 * *
*Data unavailable.
232 Northeastern Naturalist Vol. 17, No. 2
which complete harvest data was available including New Hampshire, New
Jersey, Ontario, Quebec, and Rhode Island (Table 2). These historic data
represented the most complete historic harvest records available for this
geographic region.
Average pelt prices for each season were provided by North American
Fur Auctions, formerly Hudson’s Bay Company (Toronto, ON, Canada).
North American Fur Auctions is the largest wild fur auction in the world,
thus we assumed that prices and price trends realized at this auction reflected
the current state of the overall wild fur market. Mean per-pelt prices were
adjusted for inflation to represent 2007 Canadian dollars (Statistics Canada)
(Figs. 1A, 2A).
We examined the relationship between pelt price and harvest by constructing
two linear regression models for recent (1986–2006) and historic
(1948–1968) Muskrat harvest. Our first model considered harvest as a function
of current pelt price, while our second model considered a one-year time
lag in pelt price. Previous research indicated that fur harvest can be affected
by lagged pelt prices (Chilelli et al. 1996, Scognamillo and Chamberlain
2006). This lag is due to marketing practices that result in the sale of large
quantities of fur that establish international market trends prior to the majority
of the harvest effort during a given season. Linear regression models
were constructed in SAS (SAS Institute, Carey, IN) using the PROC GLM
procedure. Annual pelt harvest was treated as the dependent variable and
annual mean pelt price was considered the predictor variable. In all models,
Table 2. Annual Muskrat harvest from 1948/1949–1968/1969 trapping seasons by jurisdiction.
Year NJ NH ON RI QC
1948 * 13,185 742,761 * 231,062
1949 * 11,165 562,587 10,104 220,082
1950 * 12,313 656,388 9828 180,648
1951 * 12,820 741,814 11,795 172,417
1952 * 20,394 838,392 10,932 176,294
1953 * 20,512 780,090 9884 190,457
1954 * 12,641 841,135 7868 122,709
1955 * 11,975 500,111 8569 141,511
1956 * 9430 564,511 9271 123,530
1957 * 8439 446,578 6524 136,205
1958 * 9767 337,986 5234 162,608
1959 * 8431 320,287 7836 206,195
1960 * 9125 304,731 5205 204,011
1961 * 8753 377,888 3627 124,677
1962 * 6103 345,428 5320 118,239
1963 * 6811 497,091 4566 191,626
1964 287,982 9993 251,795 4573 176,489
1965 215,000 6917 390,685 4468 103,835
1966 184,807 7271 359,142 4396 126,310
1967 120,471 8235 369,848 3113 121,376
1968 209,818 9505 539,034 4320 155,945
*Data unavailable.
2010 N.M. Roberts and S.M. Crimmins 233
harvests were treated as nested within each jurisdiction to account for regional
variation in harvest. Model fit was assessed by examining the mean
squared error (MSE) of the least squared estimates of the model parameters
and the associated r² values.
We examined for temporal trends in Muskrat harvest independent of
pelt price using simple regression analysis. Because we did not have harvest
values for each jurisdiction every year we could not use total annual
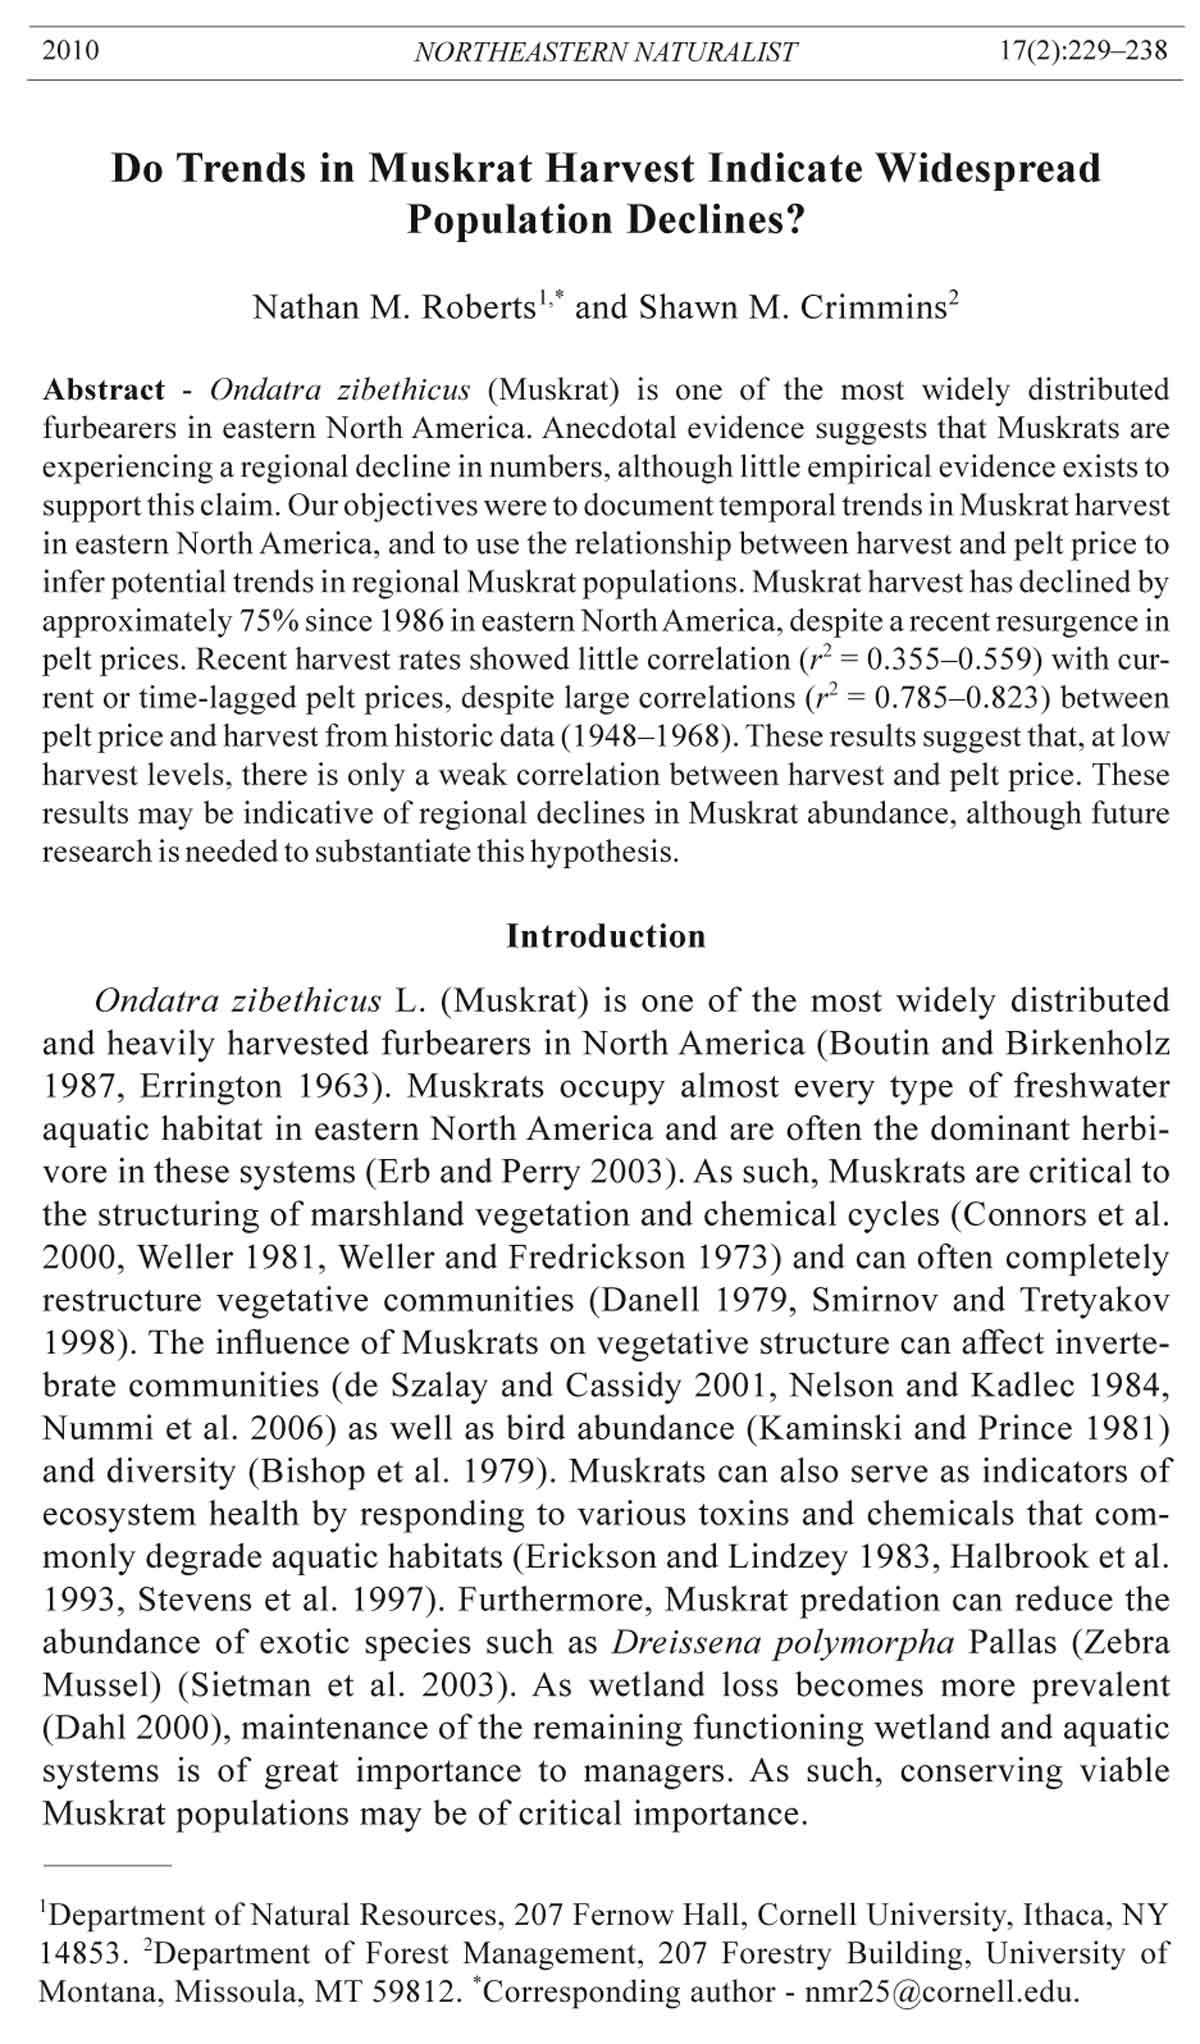
Figure 1. Inflation-adjusted Muskrat pelt prices in 2007 Canadian dollars (A) and
harvest totals (B) for historic period (1948–1968).
234 Northeastern Naturalist Vol. 17, No. 2
harvest (see Table 1). Rather, we used total harvest per area (km2) each
year only from those jurisdictions for which we had harvest data (Figs 1B,
2B). Thus, our model would not be subject to variability caused by jurisdictions
that did not report or have access to total harvest values, or by those
that did not allow Muskrat harvest. Data on jurisdiction size were gathered
from the National Atlas (National Atlas of the United States 2008) and the
Atlas of Canada (NRC 2008).
Figure 2. Inflation-adjusted Muskrat pelt prices in 2007 Canadian dollars (A) and
harvest totals (B) for modern period (1985–2006).
2010 N.M. Roberts and S.M. Crimmins 235
Results
Muskrat harvest decreased substantially during our study, declining by
approximately 75% since 1986. Declines occurred primarily between 1986
and 1990, with harvest levels stabilizing after 1990 (Fig. 2B). Harvest varied
substantially during the historic period (Fig. 1B). All models of Muskrat
harvest were highly significant (P < 0.0001), although predictive accuracy
varied greatly (Table 3). Models of historic Muskrat harvests predicted by
pelt price exhibited high model fit (r2 = 0.785–0.823), performing better than
models of current harvest (r2 = 0.355–0.559). Models incorporating a oneyear
time lag did not perform as well as models predicting harvests as a
function of current pelt price (Table 3).
Discussion
As with many furbearers, assessing population trends of Muskrats is
challenging (Erb and Perry 2003). The high costs associated with large-scale
mark-recapture and population-dynamics studies often preclude their use
for monitoring furbearer populations, particularly for species with relatively
low monetary value such as Muskrats. Despite their ecological importance,
little is known of the population status of Muskrats (Erb and Perry 2003).
The correlation between pelt prices and harvest levels has been suggested as
a means of monitoring furbearer populations and has been used by previous
researchers (Bailey 1981, Butler 1942). However, geographic and speciesspecific variability in such relationships is poorly understood (Chilelli et al.
1996). Despite these factors, it is generally thought that a strong relationship
between pelt prices and harvest levels can often be expected.
Our comparison of historic and current Muskrat harvests in relation
to pelt price demonstrates that, while historically strong, this relationship
has declined in recent years. Although other factors can influence trapper
behavior (e.g., pelt prices of other species, pelt handling time, access to
animals), our findings for Muskrat harvests are unique in that a relationship
between pelt value and harvest existed historically but weakened over time.
Similar observations have not been reported in other investigations examining
pelt value and harvest relationships for other species, suggesting that,
even if these other factors did influence the pelt value and harvest relationship,
the general trend of pelt value driving harvest effort should still hold
given relatively stable population status. Given that this correlation was
apparent for Muskrat harvest in our historical data set (1948–1968) but not
Table 3. Model parameters for Muskrat harvest in the northeastern US and eastern Canada.
Model r2 CV Mean F P-value
Current Muskrat harvest 0.559 126.4 41,692 21.58 <0.0001
Current Muskrat harvest with time lag 0.355 152.9 41,692 9.35 <0.0001
Historic Muskrat harvest 0.823 54.5 176,521 76.25 <0.0001
Historic Muskrat harvest with time lag 0.785 60.1 176,521 59.77 <0.0001
236 Northeastern Naturalist Vol. 17, No. 2
in our contemporary data set (1986–2006), anecdotal reports of declining
Muskrat populations in the northeastern United States and Eastern Canada
may be valid.
Although the relationship between pelt price and harvest has been used
for other furbearers (Scognamillo and Chamberlain 2006), this relationship
has not previously been examined in Muskrats. Our models are, to our
knowledge, the only attempt to describe Muskrat population status over such
a large geographic extent. However, the relatively poor fit of models for
contemporary harvest suggests that this relationship may break down at low
harvest levels. As such, caution should be exercised if pelt prices are used to
predict harvest or population trends, especially when harvest levels are low.
It is impossible to know if the observed breakdown in the pelt price-harvest
relationship is the result of population declines or simply poorly performing
models. Changes in trapping effort or trapper demographics could influence
these results; however, it seems reasonable that the effect would be seen for
other furbearers, not just Muskrat harvests. This breakdown further necessitates
the need for additional research on Muskrat populations. It has been
suggested that Muskrats experience cyclical population fluctuations (Erb et
al. 2000). Indeed, historic harvest levels did appear to exhibit mild periodicity
in our data; however, the lack of periodic fluctuations in our modern
harvest data provides further support for the hypothesis of widespread
population declines. The overall lack of information on regional population
trends for Muskrats is concerning, although our research does support the
hypothesis that Muskrat populations are declining in eastern North America.
However, given the tenuous strength of our supporting evidence, we suggest
that further research regarding Muskrat population status and potential
decline in eastern North America is justified.
Acknowledgments
We would like to thank the members of the Northeast Association of Fish and
Wildlife Agencies, Northeast Furbearer Resources Technical Working Group for
providing harvests figures. We thank North American Fur Auctions for providing
valuable information on pelt values. Milo Richmond provided useful insight, and
Cornell University provided essential logistical assistance for this study. Several
anonymous reviewers and guest editor John J. Daigle provided helpful comments and
suggestions on an earlier draft of this manuscript.
Literature Cited
Bailey, T.N. 1981. Factors influencing furbearer populations and harvest on the Kenai
National Moose Range, Alaska. Pp. 249–272, In J.A. Chapman and D. Pursley
(Eds.). Proceedings of the Worldwide Furbearer Conference. International
Fur Trade Federation, Maryland Furtrappers Association. Frostburg, MD.
Bishop, R.A., R.D. Andrews, and R.J. Bridges. 1979. Marsh management and its
relationship to vegetation, waterfowl, and Muskrats. Proceedings of the Iowa
Academy of Science 86:50–56.
2010 N.M. Roberts and S.M. Crimmins 237
Boutin, S., and D.E. Birkenholz. 1987. Muskrat and Round-tailed Muskrat. Pp.
315–325, In M. Novak, J.A. Baker, M.E. Obbard, and B. Malloch (Eds.). Wild
Furbearer Management and Conservation in North America. Ontario Ministry of
Natural Resources. Toronto, ON, Canada.
Butler, L. 1942. Fur cycles and conservation. Transactions of the North American
Wildlife Conference 7:463–472.
Chilelli, M., B. Griffith, and D.J. Harrison. 1996. Interstate comparisons of River
Otter harvest data. Wildlife Society Bulletin 24:238–246.
Connors, L.M., E. Kiviat, P.M. Groffman, and R.S. Ostfield. 2000. Muskrat (Ondatra
zibethicus) disturbance to vegetation and potential net nitrogen mineralization
and nitrification rates in a freshwater tidal marsh. American Midland Naturalist
143:53–63.
Dahl, T.E. 2000. Status and trends of wetlands in the conterminous United States
1986 to 1997. US Department of the Interior, Fish and Wildlife Service, Washington,
DC.
Danell, K. 1979. Reduction of aquatic vegetation following the colonization
of a northern Swedish lake by the Muskrat, Ondatra zibethica. Oecologica
38:1432–1439.
de Szalay, F.A., and W. Cassidy. 2001. Effects of Muskrat (Ondatra zibethicus)
lodge construction on invertebrate communities in a Great Lakes coastal wetland.
American Midland Naturalist 146:300–310.
Erb, J., and H.R. Perry, Jr. 2003. Muskrats. Pp. 311–348, In G.A. Feldhamer, B.C.
Thompson, and J.A. Chapman (Eds.). Wild Mammals of North America: Biology,
Management, and Conservation. Johns Hopkins University Press, Baltimore,
MD.
Erb, J., N.C. Stenseth, and M.S. Boyce. 2000. Geographic variation in population
cycles of Canadian Muskrats (Ondatra zibethicus). Canadian Journal of Zoology
78:1009–1016.
Erickson, D.W. 1981. Furbearer harvest mechanics: An examination of variable influencing fur harvest in Missouri. Pp. 1469–1491, In J.A. Chapman and D. Pursley
(Eds.). Proceedings of the Worldwide Furbearer Conference. International
Fur Trade Federation, Maryland Furtrappers Association. Frostburg, MD.
Erickson, D.W., and J.S. Lindzey. 1983. Lead and cadmium in Muskrat and Cattail
tissues. Journal of Wildlife Management 47:550–555.
Erickson, D.W., and F.W. Sampson. 1978. Impact of market dynamics on Missouri’s
furbearer harvest system. Proceedings of the Southeastern Association of Fish
and Wildlife Agencies 32:17–29
Errington, P.L. 1963. Muskrat Populations. Iowa State University Press, Ames, IA.
Halbrook, R.S., R.L. Kirkpatrick, P.F. Scanlon, M.R. Vaughn, M.R., and H.P. Veit.
1993. Muskrat populations in Virginia’s Elizabeth River: Physiological condition
and accumulation of environmental contaminants. Archives of Environmental
Contamination and Toxicology 25:438–445.
Hansen, E.L. 1965. Muskrat distribution in south-central Oregon. Journal of Mammalogy
45:669–671.
International Association of Fish and Wildlife Agencies. 2005. Ownership and the
use of traps by trappers in the United States in 2004. Responsive Management.
Harrisonburg, VA.
Kaminski, R.A., and H.H. Prince. 1981. Dabbling duck and aquatic macroinvertebrate
responses to manipulated wetland habitat. Journal of Wildlife Management
45:1–15.
238 Northeastern Naturalist Vol. 17, No. 2
Matis, J.H., T.R. Kiffe, and R. Hengevekd. 1996. Estimating parameters for birthdeath-
migration models from spatio-temporal abundance data: Case of Muskrat
spread in the Netherlands. Journal of Agricultural, Biological, and Environmental
Statistics 1:40–59.
National Atlas of the United States. 2008. Available online at http://www.nationalatlas.
gov. Accessed 15 September 2007.
Natural Resources Canada (NRC). 2008. The Atlas of Canada. Available online at
http://atlas.nrcan.gc.ca. Accessed 15 September 2007.
Nelson, J.W., and J.A. Kadlec. 1984. A conceptual approach to relating habitat structure
and macroinvertebrate production in freshwater wetlands. Transactions of
the North American Wildlife and Natural Resources Conference 49:262–270.
Northeast Fur Resources Technical Committee. 2005. Minutes of the annual meeting
of the Northeast Fur Resources Technical Committee September 7–10, 2005.
Modus, CT.
Nummi, P., V.M. Vaananen, and J. Malinen. 2006. Alien grazing: Indirect effects of
Muskrats on invertebrates. Biological Invasions 8:993–999.
Powell, R.A. 1993. The Fisher: Life History, Ecology, and Behavior. Second Edition.
University of Minnesota Press, Minneapolis, MN.
Schooley, R.L., and L.C. Branch. 2005. Survey techniques for determining occupancy
of isolated wetlands by Round-tailed Muskrats. Southeastern Naturalist
4:745–756.
Scognamillo, D.G., and M.J. Chamberlain. 2006. Forecasting models for harvest of
River Otter in Louisiana. Proceedings of the Southeastern Association of Fish
and Wildlife Agencies 60:25–32.
Sietman, B.E., H.L. Dunn, J.K. Tucker, and D.E. Kelner. 2003. Muskrat (Ondatra
zibethicus) predation on Zebra Mussels (Dreissena polymorpha) attached to
unionid bivalves. Journal of Freshwater Ecology 18:25–32.
Smirnov, V.V., and K. Tretyakov. 1998. Changes in aquatic plant communities on the
island of Valaam due to invasion by the Muskrat Ondatra zibethicus (Rodentia,
Mammalia). Biodiversity and Conservation 7:673–690.
Stevens, R.T., T.L. Atwood, and J.M. Sleeman. 1997. Mercury in hair of Muskrats
(Ondatra zibethicus) and Mink (Mustela vison) from the US Department of
Energy Oak Ridge Reservation. Bulletin of Environmental Contamination and
Toxicology 58:720–725.
Wellner, M.W. 1981. Freshwater Marshes. University of Minnesota Press, Minneapolis,
MN.
Wellner, M.W., and L.H. Fredrickson. 1973. Avian ecology of a managed glacial
marsh. Living Bird 12:269–291.
Wood, W. 1974. Muskrat origin, distribution, and range expansion through the
coastal areas of Del Norte County, California and Curry County, Oregon. Murrelet
55:1–4.