2013 NORTHEASTERN NATURALIST 20(1):69–90
Fish and Blue Crab Assemblages in the Shore Zone of
Tidal Creeks in the Delaware Coastal Bays
Brian P. Boutin1,2,* and Timothy E. Targett1
Abstract - Spatial and temporal dynamics of shore zone fish and Callinectes sapidus
(Blue Crab) densities in tidal creeks of the Delaware Coastal Bays were examined during
the spring/summer nursery period and in the winter of 2004, 2005, and early 2006
to identify underlying abiotic conditions driving the structure of species assemblages.
Distinct spring/summer species assemblages were identified within separate tidal
creeks, correlated with dissolved oxygen range. Differences were driven by the dominance
of hypoxia-tolerant species in the intensely developed White Creek watershed
and hypoxia-sensitive species in the less-developed Miller Creek watershed. In winter,
species assemblages were somewhat homogenized and were less influenced by abiotic
conditions. Results of this study indicate that the fish and Blue Crab assemblage in
the shore zone of tidal creeks in the Delaware Coastal Bays is affected primarily by
location-specific influences, such as anthropogenic alteration and associated hypoxia,
particularly in the spring and summer.
Introduction
Coastal embayments and their tributaries provide important habitat for numerous
economically and ecologically important fishes and invertebrates (Nixon
1982, Sogard and Able 1991, Szedlmayer and Able 1996, Yanez-Arancibia et
al. 1994). Unlike river-dominated estuarine systems, coastal bays are generally
well mixed with less dramatic environmental gradients (Kjerfve 1986, Kjerfve
and Magill 1989, Mariani 2001). The physical and hydrodynamic features of
coastal bays, as well as their interaction with tides and predominant patterns in
wind speed and direction can therefore influence the structure of the associated
faunal communities (Mariani 2001, Murphy and Secor 2006). Fishes that use
coastal bay habitats can be classified into numerous groups that describe their
level of residency in the system (Yanez-Arancibia et al. 1994, Whitfield 1999).
Resident species remain in the coastal bay for their entire life cycle. Transient
species use coastal bays as opportunistic foraging grounds, spawning areas, juvenile
nurseries, and migration corridors (Day et al. 1989, Moyle and Cech 1982).
Some transient species are facultative in their use of coastal lagoons, while others
commonly described as estuary dependent use coastal bays as primary nursery
habitats. The high productivity, abundant prey resources, suitable physicochemical
conditions, and shallow nature of coastal bays provide fishes with favorable
conditions for reproduction, growth, and refuge from predation (Nixon 1982,
Yanez-Arancibia et al. 1994).
1University of Delaware, School of Marine Science and Policy, Lewes, DE 19958. 2Current
address - The Nature Conservancy, 701 W Ocean Acres Drive, Kill Devil Hills, NC
27948. *Corresponding author - bboutin@tnc.org.
70 Northeastern Naturalist Vol. 20, No. 1
The coastal bays of Delaware, Maryland, and Virginia on the Delmarva
Peninsula support numerous species of resident, estuary-dependent, and facultative
transient fishes (Derickson and Price 1973; Love et al. 2009; Murphy and
Secor 2006; Pacheco and Grant 1965; Richards and Castagna 1970; Schwartz
1961, 1964; Weston 1993). As in most temperate estuaries, the composition and
abundance of the fish fauna of the Delmarva coastal bays is seasonally variable.
Many estuary-dependent fishes, such as those in the families Sciaenidae and
Clupeidae, utilize these bays as seasonal nursery grounds (Able and Fahay 2010,
Wang and Kernehan 1979), occurring in greatest abundance during summer and
early autumn (Cowan and Birdsong 1985, Derickson and Price 1973, Pacheco
and Grant 1965, Weston 1993). The nekton assemblages in the Delmarva coastal
bays have been found to differ spatially among individual embayments (Murphy
and Secor 2006) with distributions within embayments influenced by variability
of environmental factors such as salinity (Love et al. 2009).
The Delaware Coastal Bays are the most anthropogenically impacted on the
Delmarva Peninsula (Chaillou et al. 1996, DIBEP 1995, Maxted et al. 1997,
Price 1998, Valdes-Murtha 1997). Since 1950, the population of Sussex County,
DE, the county bordering the bays, has increased 221% (Delaware Population
Consortium 2010, US Census Bureau 1995). Shoreline alteration and nutrient enrichment
have contributed to the disappearance of Zostera marina L. (Eelgrass)
and Ruppia maritima L. (Widgeongrass) and an increase of dense drift macroalgal
communities dominated by Agardhiella tenera J. Ag. (Red Weed) and Ulva
lactuca L. (Sea Lettuce) (DIBEP 1995, Maxted et al. 1997, Price 1998, Timmons
and Price 1996, Tyler 2010, Weston 1993). Such changes to both physical and
chemical environments often adversely affect the functional role of specific habitats
for the faunal assemblages by altering food webs and species composition
(Deegan 2002, Holland et al. 2004). These changes can result in a homogenization
of species assemblages to those only tolerant of variable conditions (Maxted
et al. 1997) as well as a loss of productive habitat for transient fauna that rely
on such habitat as nursery grounds (Holland et al. 2004). A review of previous
studies examining the shore-zone fish community in the Delaware Coastal Bays
concluded that a shift in dominance had occurred since the 1950s, with a greater
abundance of species in the Family Cyprinodontidae, which are more tolerant of
low dissolved oxygen (DO), and lower abundances of estuary-dependent species
(Chaillou et al. 1996, Price 1998). This shift was primarily attributed to recent
nutrient enrichment in these bays.
Although several studies have examined the fish and Callinectes sapidus
Rathbun (Blue Crab) assemblage structure in the shore zone of the Delaware
Coastal Bays (Clark 2002, Derickson and Price 1973, Pacheco and Grant 1965,
Weston 1993), most did not link trends in assemblage structure to environmental
variability, and all relied on measurements of relative abundance rather than
quantitative measurements of density. This approach limits the usefulness of
the data to identify habitat areas and/or conditions that promote productive,
biodiverse faunal communities. Additionally, the most spatially and temporally
comprehensive studies were conducted several decades ago, while more recent
2013 B.P. Boutin and T.E. Targett 71
studies consist mostly of limited temporal sampling at specific locations. The
need for more extensive current data is highlighted by the fact that there has been
a continued shift in the shore fish assemblage towards hypoxia-tolerant resident
species since those early studies were conducted (Price 1998).
The objective of the present study was to use quantitative sampling to
examine spatial and temporal dynamics of the shore zone fish and the Blue
Crab assemblage in tidal creeks of the Delaware Coastal Bays and attribute
those dynamics to habitat-specific variations in temperature, salinity, and DO.
Specifically, we compared differences in densities of fishes and Blue Crabs
among sections of tidal creeks within different embayments across the spring/
summer nursery period and winter of two years. This comparison provided
insight into spatial and seasonal differences in the density of individuals and
assemblage structure and the underlying physicochemical characteristics that
drive those changes.
Field-Site Description
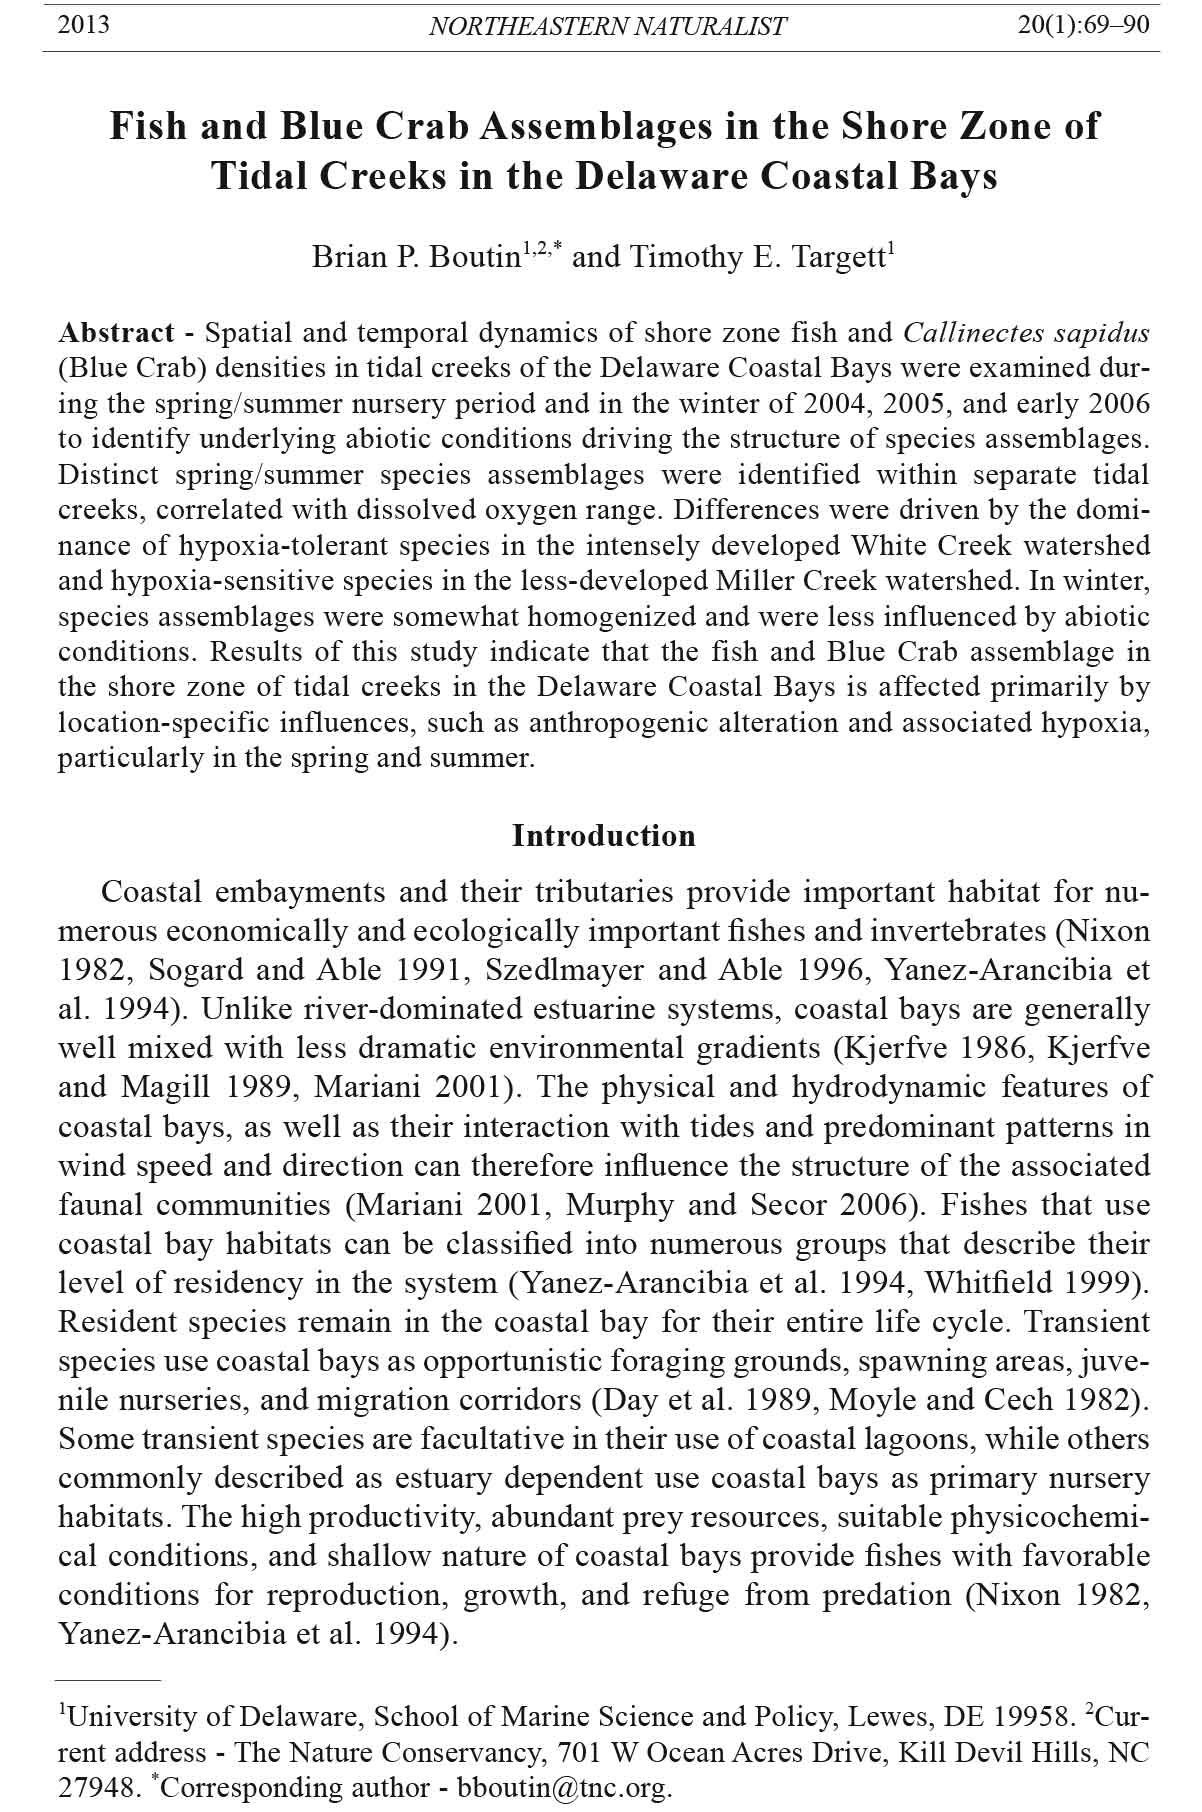
Located in southeastern Delaware, the Delaware Coastal Bays consist of three
interconnected embayments—Rehoboth Bay, Indian River Bay, and Little Assawoman
Bay—and their associated tributaries and canals (Fig. 1). These shallow
(average depth is 1.2 m), polyhaline to mesohaline systems have a combined
water surface area of 83 km2 and are sheltered from substantial direct interaction
with the Atlantic Ocean (DIBEP 1995, Martin et al. 1996, NOAA 1990). The
northernmost bays are contiguous with the Atlantic Ocean at Indian River Inlet,
while Little Assawoman Bay is connected with the ocean through Ocean City
Inlet, MD. All bays are fringed by salt or brackish, tidally influenced marshes
(Tiner 2001, Weston 1993) and have little freshwater inflow (Martin et al. 1996,
Weston 1993). Indian River and Rehoboth bays have more extensive drift macroalgal
communities than does Little Assawoman Bay (Price 1998; Timmons and
Price 1996; Tyler 2005, 2010; Valdes-Murtha 1997).
Sampling was conducted in White Creek (a tributary of Indian River Bay),
Miller Creek (a tributary of Little Assawoman Bay), and Assawoman Canal (a
man-made waterway connecting the two tributaries) (Fig. 1). Two stations were
sampled in both tidal creeks, and four stations were sampled in Assawoman
Canal (Fig. 1). Both White Creek stations were adjacent to substantial shoreline
development and contained dense drift macroalgae. In contrast, the Miller Creek
stations were bordered by conservation lands (Assawoman Wildlife Area) with
salt marsh and sediment bank shorelines and generally contained no macroalgae.
Habitat characteristics of Assawoman Canal varied between northern and southern
stations. Northern Assawoman Canal stations (A1 and A2) were bordered by
steeply sloping, high-bank shorelines and contained scattered deposits of large
woody debris. In contrast, the southern stations (A3 and A4) were bordered by
forested wetlands and fringing salt marsh with wood/leaf-litter detritus. All stations
in Assawoman Canal were bordered by moderate upland development, and
two of the stations (A2 and A4) were adjacent to bridges that traversed the canal.
72 Northeastern Naturalist Vol. 20, No. 1
Methods
Fishes and Blue Crabs were collected in the shore zone with two standardized
quarter-circle hauls of a 7.6-m seine net (1.2 m in height; 5-mm mesh),
which resulted in a total area swept of 45.6 m2. Prior to the initiation of this
study, it was determined that two swiftly replicated seine hauls sampled 95%
of the fish and Blue Crab individuals residing in the area seined, with 70% collected
in the first haul. Thus, two replicate seine hauls were employed at each
station, and the contents were combined as one sample. Fish were identified
to species, and numerical densities of each species and all species combined
were calculated as the number of individuals per area swept. Sampling was
conducted from May through September 2004 and April through September
2005 during the spring/summer nursery period and in December 2004, February
Figure 1. Sampling
stations in
tidal creeks of the
Delaware Coastal
Bays. Numbers indicate
individual
stations in White
Creek (W), Assawoman
Canal (A),
and Miller Creek
(M).
2013 B.P. Boutin and T.E. Targett 73
and March 2005, and January 2006 during winter. All samples were collected
during daylight hours between midmorning and midafternoon. Nursery period
samples were collected weekly at the Assawoman Canal stations and biweekly
at the Miller and White Creek stations in 2004 and weekly at all stations in
2005. Winter samples were collected once monthly at all stations. Infrequently,
during both years, extremely high densities of drift macroalgae prevented
sampling in White Creek. This build up of drift macroalgae occurred on one
occasion in June 2004 at the W1 station and in May and June 2005 when both
stations were sampled biweekly due to macroalgal densities.
Temperature, salinity, and DO were recorded prior to sampling at each
station. Surface salinity was measured using a temperature-compensated refractometer.
Bottom temperature and DO were measured using an YSI 55
handheld DO meter. It should be noted that DO values taken at the time of
sampling do not describe the dynamic diel (day-night) cycle of DO often seen
in shallow estuarine tributaries (Tyler et al. 2009) and were treated as a relative
indication of DO at a given site.
Statistical analysis
Species richness and total density of fish and Blue Crab individuals were compared
among months using one-way ANOVA to examine temporal changes over
the spring/summer nursery period into winter. Winter months were analyzed with
spring/summer nursery period data from the preceding year (e.g., January 2006
analyzed with 2005 spring/summer nursery period months). Data were averaged
across stations for each month. If significant differences were found, a Tukey’s
HSD test was used for multiple comparisons. Fish and Blue Crab density data
were log10 (x + 1) transformed to reduce heterogeneity of variances. All analyses
were conducted using SYSTAT (Version 13.00.05). A significance level of α =
0.05 was used throughout.
Fish and Blue Crab assemblage structure was analyzed using nonparametric
multivariate statistics to relate seasonal and spatial trends to environmental
characteristics. This approach allows for the identification of differences in
the assemblage structure among groups of samples and the underlying drivers
of those differences through construction of similarity matrices, application
of group-average hierarchal cluster analysis and non-metric multidimensional
scaling (NMDS) to identify groupings of stations, calculation of similarity percentages
to identify species contributing most to the overall dissimilarity between
defined groups, and correlating the observed pattern of species assemblages to
environmental characteristics. All analyses were conducted using PRIMER (Version
5.2.4). All species composing less than 1% of the total catch at any station
during each season were eliminated from the analysis.
To identify spatial differences in the fish and Blue Crab assemblage structure
within each season of each year, Bray-Curtis similarity matrices (Bray and Curtis
1957) were constructed from fourth-root transformed mean densities of each species
at each station. Group-average hierarchal cluster analysis and NMDS based
on the Bray-Curtis similarity matrices were performed to identify sample groups
74 Northeastern Naturalist Vol. 20, No. 1
with different assemblage structures. Cluster analysis was used to define levels
of similarity that appeared to assemble samples into ecologically meaningful
groups, while NMDS was used to illustrate these groupings in two dimensions.
NMDS plots were considered adequate if stress coefficients, a measure of goodness
of fit, were less than 0.2 (Clarke 1993). The species which contributed most to the
observed groupings were then identified using a similarity percentages procedure
(SIMPER; Clarke 1993). This procedure calculates each species’ contribution to
the average Bray-Curtis dissimilarity between sample groups (δi), as well as its
standard deviation (SD[δi]). Species with a high ratio of mean δi values to their
respective SD(δi) are deemed important discriminating species. The influence of
abiotic variables on observed groupings of species assemblages was examined
using the BIOENV procedure (Clarke and Ainsworth 1993). Similarity matrices
were constructed for station averages of temperature, salinity, DO, their respective
ranges, and all combinations thereof using Euclidean distance of normalized
values. Then Spearman’s rank correlations (ρ) were calculated between the species
assemblage similarity matrices and all possible abiotic similarity matrices to
identify the combination of abiotic variables which best explain the observed pattern
of assemblages. Permutations tests were used to determine the significance
of these correlations.
Results
Temperature was generally 1–2 °C higher at the White Creek and Miller Creek
stations than at the Assawoman Canal stations in the spring/summer nursery
period of 2004 and 2005 (Table 1). A slight salinity gradient was evident across
stations, with higher mean values at White Creek stations closest to Indian River
Inlet (Table 1). Salinities were higher in 2005 than in 2004, with the largest
variability occurring at Assawoman Canal stations during both years. DO concentrations
ranged from hypoxic to supersaturated conditions during both years
(Table 1). Mean DO concentrations were generally higher at White Creek and
Miller Creek stations than at those in Assawoman Canal. However, the lowest
DO values were often recorded at White Creek and southern Assawoman Canal
stations. Overall, White Creek and Miller Creek stations had greater mean temperatures
and DO than Assawoman Canal stations, with White Creek stations
exhibiting the greatest variability in DO, and Assawoman Canal stations exhibiting
the greatest variability in salinity.
Trends in abiotic characteristics during winter sampling were similar to
those during the spring/summer nursery period. Temperature was generally
1 °C higher at the White Creek stations than at all other stations. Temperature
averaged 7.2 °C in winter 2004/2005 and 8.3 °C in winter 2006 at the White
Creek stations, while other stations averaged less than 6 °C in winter 2004/2005
and near 7 °C in winter 2006. A salinity gradient remained evident during winter
of both years, with higher mean values at the White Creek stations (25.5
PSU in 2004/2005 and 27 PSU in 2006). However, unlike measurements during
the spring/summer nursery period, DO values remained above 6 mg/L at all stations
during each sampling event.
2013 B.P. Boutin and T.E. Targett 75
A total of 21,487 individuals of 32 species were collected during spring/
summer nursery period sampling in 2004 and 2005 (Table 2). The catch was
dominated by Fundulus heteroclitus (Mummichog) (47.5% of total catch) and
Menidia menidia (Atlantic Silverside) (29.7% of total catch). Other species
such as Blue Crab (7%), Leiostomus xanthurus (Spot) (3.9%), and Cyprinodon
variegatus (Sheepshead Minnow) (3.7%) were also abundant. During
winter, only 135 individuals of six species were collected in the shore zone,
with Sheepshead Minnow (64.4%) and Mummichog (25.2%) dominating the
catch (Table 3).
Species richness varied seasonally between the spring/summer nursery
period and winter of each year (Fig. 2). Species richness was significantly
higher in May than in September 2004 (F7,122 = 22.52, P < 0.01), indicating a
slight decline during the spring/summer nursery period, and was significantly
higher in all spring/summer nursery period months than in the following winter
months (December 2004, February and March 2005). During the spring/
summer nursery period of 2005, species richness was significantly higher in
June and July than all other months with the exception of August, indicating a
mid-summer peak (F6,181 = 36.55, P < 0.001). This peak was primarily driven
by later recruitment of transient species as compared to that in the spring/
Table 1. Station means (minimum-maximum range) for abiotic variables in tidal creeks of the
Delaware Coastal Bays from the spring/summer nursery period in 2004 and 2005.
Temperature (°C) Salinity (PSU) DO (mg/L)
Creek/station 2004 2005 2004 2005 2004 2005
White Creek
W1 26.1 25.8 22.0 27.8 7.2 7.5
(22.8–28.9) (15.7–34.6) (15.0–30.0) (20.0–32.0) (2.7–11.0) (2.4–20.0)
W2 26.6 26.0 21.9 27.3 6.8 6.9
(24.2–29.3) (15.8–33.7) (14.0–30.0) (21.0–32.0) (3.3–10.1) (2.2–11.6)
Assawoman Canal
A1 25.3 24.6 20.5 25.4 5.3 5.9
(21.5–29.0 (13.7–32.2) (9.0–2.09) (18.0–32.0) (3.2–7.3) (3.0–9.5)
A2 25.3 24.4 19.7 24.3 4.9 5.1
(21.8–28.8) (13.3–32.1) (11.0–28.0) (17.0–32.0) (3.1–7.3) (2.6–7.0)
A3 24.6 22.8 13.3 15.5 3.9 3.7
(21.2–27.5) (13.1–29.8) (5.0–27.0) (0.0–31.0) (2.4–6.1) (1.1–9.2)
A3 24.6 22.8 13.3 15.5 3.9 3.7
(21.2–27.5) (13.1–29.8) (5.0–27.0) (0.0–31.0) (2.4–6.1) (1.1–9.2)
A4 25.3 24.2 13.6 19.0 5.1 4.1
(21.3–28.6) (12.9–33.5) (4.0–25.0) (5.0–30.0) (2.7–11.1) (2.2–6.3)
Miller Creek
M1 27.3 24.4 17.8 19.7 7.4 5.7
(23.5–31.6) (12.7–32.3) (10.0–25.0) (11.0–31.0) (6.6–8.5) (3.7–7.8)
M2 27.7 24.9 13.9 17.6 7.6 5.5
(24.4–31.7) (13.3–32.9) (5.0–19.0) (9.0–28.0) (5.5–9.1) (3.8–7.5)
76 Northeastern Naturalist Vol. 20, No. 1
Table 2. Mean density (per m2), numerical abundance, and percentage of total catch for fish and Blue Crabs collected from the shore zone in tidal creeks of
the Delaware Coastal Bays during the spring/summer nursery period in 2004 and 2005. Species are listed in descending order of percent contribution to the
total shore zone catch.
White Creek Assawoman Canal Miller Creek Total
Species W1 W2 A1 A2 A3 A4 M1 M2 Number Percent
Fundulus heteroclitus (L.) (Mummichog) 1.44 0.89 0.43 0.75 0.96 1.13 0.30 0.27 10,205 47.5
Menidia menidia (L.) (Atlantic Sivlerside) 0.25 0.29 0.64 0.36 0.27 0.91 0.52 0.45 6381 29.7
Callinectes sapidus Rathbun (Blue Crab) 0.13 0.29 0.07 0.14 0.08 0.08 0.11 0.08 1505 7.0
Leiostomus xanthurus Lacepède (Spot) 0.09 0.05 0.04 0.07 0.04 0.01 0.10 0.14 834 3.9
Cyprinodon variegatus Lacepède (Sheepshead Minnnow) 0.24 0.02 0.01 0.03 0.05 0.10 <0.01 0.01 797 3.7
Lucania parva (Baird and Girard) (Rainwater Killifish) 0.10 0.06 0.02 0.01 0.12 0.04 <0.01 <0.01 567 2.6
Fundulus majalis (Walbaum) (Striped Killifish) 0.19 0.05 0.01 0.05 0.01 0.01 0.03 0.03 519 2.4
Gobiosoma bosc (Lacepède) (Naked Goby) 0.01 0.05 0.01 0.03 0.02 <0.01 <0.01 <0.01 190 0.9
Pseudopleuronectes americanus (Walbaum) (Winter Flounder) 0.01 0.06 <0.01 0.01 157 0.7
Anchoa mitchilli (Cuvier and Valenciennes) (Bay Anchovy) <0.01 <0.01 0.01 0.01 <0.01 0.01 0.01 68 0.3
Fundulus diaphanus (Lesueur) (Banded Killifish) <0.01 0.01 0.03 <0.01 <0.01 66 0.3
Bairdiella chrysoura (Lacepède) (American Silver Perch) <0.01 0.02 <0.01 <0.01 <0.01 29 0.1
Brevoortia tyrannus (Latrobe) (Atlantic Menhaden) 0.02 <0.01 25 0.1
Alosa aestivalis (Mitchill) (Blueback Herring) 0.01 19 <0.1
Lepomis gibbosus (L.) (Pumpkinseed) <0.01 <0.01 <0.01 <0.01 <0.01 19 <0.1
Trinectes maculatus (Bloch and Schneider) (Hogchoker) <0.01 <0.01 <0.01 0.01 17 <0.1
Apeltes quadracus (Mitchill) (Fourspine Stickleback) <0.01 <0.01 <0.01 <0.01 13 <0.1
Pogonias cromis (L.) (Black Drum) 0.01 <0.01 <0.01 <0.01 13 <0.1
Alosa pseudoharengus (Wilson) (Alewife) <0.01 0.01 12 <0.1
Paralichthys dentatus (L.) (Summer Flounder) <0.01 <0.01 <0.01 <0.01 <0.01 <0.01 11 <0.1
Mugil cephalus L. (Flathead Mullet) <0.01 <0.01 <0.01 <0.01 10 <0.1
Opsanus tau (L.) (Oyster Toadfish) <0.01 <0.01 6 <0.1
Pomatomus saltatrix (L.) (Bluefish) <0.01 <0.01 <0.01 5 <0.1
Micropogonias undulatus (L.) (Atlantic Croaker) <0.01 <0.01 <0.01 <0.01 4 <0.1
Morone americana (Gmelin) (White Perch) <0.01 <0.01 4 <0.1
Syngnathus fuscus Storer (Northern Pipefish) <0.01 <0.01 4 <0.1
Hypsoblennius hentz (Lesueur) (Feather Blenny) <0.01 2 <0.1
Anguilla rostrata (Lesueur) (American Eel) <0.01 1 <0.1
Gobiesox strumosus Cope (Skilletfish) <0.01 1 <0.1
Micropterus salmoides (Lacepède) (Largemouth Bass) <0.01 1 <0.1
Morone saxatilis (Walbaum) (Striped Bass) <0.01 1 <0.1
Synodus foetens (L.) (Inshore Lizardfish) <0.01 1 <0.1
Total 21,487 100.0
2013 B.P. Boutin and T.E. Targett 77
Table 3. Mean density (per m2), numerical abundance, and percentage of total catch for fish and
blue crabs collected from the shore zone in tidal creeks of the Delaware Coastal Bays during winter
2004/2005 and 2006. Species are listed in descending order of percent contribution to the total
shore zone catch.
White Creek Assawoman Canal Miller Creek Total
Species W1 W2 A1 A2 A3 A4 M1 M2 # %
Cyprinodon variegatus 0.10 0.10 0.08 0.01 0.19 87 64.4
Fundulus heteroclitus 0.15 0.01 0.07 0.01 34 25.2
Lucania parva 0.03 0.01 6 4.4
Fundulus majalis 0.02 0.02 0.01 5 3.7
Apeltes quadracus 0.02 2 1.5
Callinectes sapidus 0.01 1 0.8
Total 135 100.0
Figure 2. Monthly
mean (a) species
richness (±
standard error)
and (b) density
of fishes and
Blue Crab (per
m2 ± standard error)
collected in
the shore zone
of all stations in
tidal creeks of
the Delaware
Coastal Bays
during 2004,
2005, and 2006.
78 Northeastern Naturalist Vol. 20, No. 1
summer nursery period of 2004. In addition, species richness was significantly
lower in winter (January 2006) than in all spring/summer nursery period
months of 2005 with the exception of April.
Total density followed similar seasonal patterns to that of species richness
in each year (Fig. 2). Total density was significantly higher in May 2004 than
all other spring/summer nursery period and winter months (F7,122 = 23.74, P <
0.001). Overall, total density showed a seasonal decline, with the lowest density
in September 2004 and winter 2004/2005. During the spring/summer nursery
period of 2005, total density of fish and Blue Crabs peaked slightly in June and
was significantly higher than in May (F6,181 = 5.50, P < 0.05), with no significant
differences found among other nursery period months. Total density in winter
2006 was significantly lower than all spring/summer nursery period months in
2005 with the exception of April and May.
Cluster analysis and NMDS ordination of station-specific fish and Blue
Crab density data indicated discrete spatial groupings of stations for each
seasonal period in each year (Fig. 3). For the spring/summer nursery periods
in 2004 and 2005, a similarity level of 80% partitioned the stations into
biologically meaningful groups. In general, Miller Creek and White Creek assemblages
differed from one another. In the spring/summer nursery period of
2004, Miller Creek stations were clearly differentiated from White Creek and
Figure 3. Non-metric multidimensional scaling (NMDS) ordination of stations based on
fourth-root transformed mean densities (per m2) of fishes and Blue Crab collected from
the shore zone in tidal creeks of the Delaware Coastal Bays during (a) spring/summer
2004, (b) winter 2004/2005, (c) spring/summer 2005, and (d) winter 2006. Lines indicate
groups of stations identified in group-average cluster analysis.
2013 B.P. Boutin and T.E. Targett 79
Assawoman Canal stations (Stress = 0.03; Fig. 3). Although close geographically,
the southern Assawoman Canal station A4 and the Miller Creek stations
(M1 and M2) were the most dissimilar. These two groups had a dissimilarity
level of 24.4%, discriminated mostly by differing densities of Lucania
parva (Rainwater Killifish) (18.1%), Sheepshead Minnow (17.2%), and Spot
(13.2%) (Table 4). Spot were absent from the southern Assawoman Canal station
A4, while Sheepshead Minnow densities were 20 times higher than that
in Miller Creek. A combination of mean temperature, mean salinity, and DO
range were found to best correlate with the observed pattern of species assemblages
(ρ = 0.59), and this correlation was significant (P < 0.05). In the
spring/summer nursery period of 2005, Miller Creek and White Creek stations
again differed from one another (Stress = 0.09; Fig. 3). However, unlike 2004,
Miller Creek stations grouped with the northern Assawoman Canal stations
(A1 and A2). The species assemblages of the White Creek stations (W1 and
W2) and the grouped Miller Creek/northern Assawoman Canal stations were
the most dissimilar with a dissimilarity level of 25.8%. Species most responsible
for the dissimilarity between these two groups of stations were Rainwater
Killifish (12.7 %) and Bairdiella chrysoura (Silver Perch) (10.9 %), which had
densities 10 times higher at the White Creek stations, and Pseudopleuronectes
americanus (Winter Flounder) (10.8%), which were only collected at the Miller
Creek/northern Assawoman Canal stations (Table 4). A combination of DO
and DO range were significant correlates of the observed pattern of species assemblages
during this period (ρ = 0.56, P < 0.05).
During the winters following nursery-period collections, a consistent pattern
of spatial partitioning of species assemblages was less clear (Fig. 3). A similarity
level of 40% clustered stations into biologically meaningful groups for both
years. In winter 2004/2005, the Miller Creek station M1 and White Creek station
W2 contained different assemblages from all other stations where individuals
were collected (no individuals were collected at A1 or W1) (Stress = 0.01; Fig. 3).
These two stations were also the most dissimilar due to the absence of Mummichog,
Rainwater Killifish, and Apeltes quadracus (Fourspine Stickleback) at
the Miller Creek station M1 (Table 4). A combination of DO and DO range were
significant correlates of the observed pattern of species assemblages during this
period (ρ = 0.56, P < 0.05). In winter 2006, the typical segregation of Miller
Creek and White Creek stations seen during the other seasons broke down, with
station M1 clustering with station W1 (Stress = 0.01; Fig. 3). This grouping was
the most dissimilar from the northern Assawoman Canal station A1, as Fundulus
majalis (Striped Killifish) and Sheepshead Minnow were absent from collections
at that station (Table 4). No environmental data were significant correlates to the
observed pattern of species assemblages.
Discussion
The fish and Blue Crab assemblage structure in the shore zone of the tidal
creeks sampled in the present study was generally similar to that reported
80 Northeastern Naturalist Vol. 20, No. 1
Table 4. Mean density (per m2), ratio of mean dissimilarity to standard deviation [δi/SD(δi)] and percent contribution of discriminating species to the mean
dissimilarity between groups of stations identified by cluster analysis and NMDS ordination during the spring/summer nursery period in 2004 and 2005, and
the following winters using SIMPER analysis.
Mean density
Year Season Mean dissimilarity Group 1 Group 2 δi/SD(δi) Percent
2004 Spring/summer A1, A2, A3, W1, W2 vs. A4 = 20.4 A1, A2, A3, W1, W2 A4
Leiostomus xanthurus 0.033 12.73 22.0
Fundulus majalis 0.120 0.001 1.90 17.2
Anchoa mitchilli <0.001 0.005 2.82 12.1
A1, A2, A3, W1, W2 vs. M1, M2 = 23.2 A1, A2, A3, W1, W2 M1, M2
Anchoa mitchilli <0.001 0.029 4.66 18.8
Lucania parva 0.046 0.001 1.71 15.6
Gobiosoma bosc 0.010 1.64 12.2
A4 vs. M1, M2 = 24.4 A4 M1, M2
Lucania parva 0.048 0.001 2.25 18.1
Cyprinodon variegatus 0.165 0.008 14.58 17.2
Leiostomus xanthurus 0.005 29.17 13.2
2005 Winter A1, A3, A4, M2 vs. M1 = 91.7 A1, A3, A4, M2 M1
Cyprinodon variegatus 0.110 3.95 52.8
Fundulus majalis 0.004 0.011 1.55 25.2
Fundulus heteroclitus 0.004 0.81 11.0
A1, A3, A4, M2 vs. W2 = 83.0 A1, A3, A4, M2 W2
Cyprinodon variegatus 0.110 8.21 28.9
Fundulus heteroclitus 0.004 0.219 2.38 27.2
Apeltes quadracus 0.022 6.33 19.0
M1 vs. W2 = 100.0 M1 W2
Fundulus heteroclitus 0.219 N/A 37.0
Lucania parva 0.044 N/A 24.7
Apeltes quadracus 0.022 N/A 20.8
2013 B.P. Boutin and T.E. Targett 81
Table 4, continued.
Mean density
Year Season Mean dissimilarity Group 1 Group 2 δi/SD(δi) Percent
2005 Spring/summer A1, A2, M1, M2 vs. A3, A4 = 23.1 A1, A2, M1, M2 A3, A4
Lucania parva 0.008 0.079 1.40 13.5
Pseudopleuronectes americanus 0.008 4.22 13.2
Fundulus heteroclitus 0.287 0.804 2.03 11.3
A1, A2, M1, M2 vs. W1, W2 = 25.8 A1, A2, M1, M2 W1, W2
Lucania parva 0.008 0.096 1.80 12.7
Bairdiella chrysoura <0.001 0.012 2.67 10.9
Pseudopleuronectes americanus 0.008 4.12 10.8
A3, A4 vs. W1, W2 = 22.8 A3, A4 W1, W2
Fundulus diaphanus 0.024 2.70 15.5
Bairdiella chrysoura < 0.001 0.012 1.89 10.3
Cyprinodon variegatus 0.030 0.127 2.34 9.7
2006 Winter A1 vs. A3, A4, M2 = 85.0 A1 A3, A4, M2
Cyprinodon variegatus 0.102 3.77 52.9
Fundulus heteroclitus 0.022 0.080 2.61 35.3
Lucania parva 0.011 0.58 11.8
A1 vs. M1, W1 = 100.0 A1 M1, W1
Fundulus heteroclitus 0.022 3.54 41.7
Fundulus majalis 0.022 3.54 41.7
Cyprinodon variegatus 0.011 0.71 16.7
A3, A4, M2 vs. M1, W1 = 76.4 A3, A4, M2 M1, W1
Cyprinodon variegatus 0.102 0.011 1.35 36.2
Fundulus majalis 0.022 3.37 36.0
Fundulus heteroclitus 0.080 0.64 16.2
82 Northeastern Naturalist Vol. 20, No. 1
from other estuarine creeks along the east coast of the United States (Able et
al. 2007, Derickson and Price 1973, Rountree and Able 1992, Wagner 1999,
Weinstein 1979). Mummichogs and Atlantic Silversides, which were dominant
components of the spring/summer nursery period shore-zone assemblage, are
also principal species in the shore zone of Delaware Bay (de Sylva et al. 1962)
and the Rehoboth and Indian River bays (Derickson and Price 1973, Price
1998). Rountree and Able (1992) found that these two species were the two
most abundant fish species captured during spring, summer, and autumn in the
shore zone and adjacent subtidal regions of polyhaline tidal creeks in Great
Bay - Little Egg Harbor, NJ. Both species use this habitat for foraging, refuge,
and spawning (Able et al. 2003, Conover and Ross 1982, Raichel et al. 2003,
Richards and Castagna 1970, Shenker and Dean 1979, Wang and Kernehan
1979). However, during winter collections in the present study, Atlantic Silverside
were absent while Sheepshead Minnow and Mummichog constituted the
dominate species collected. This discrepancy between seasonal dominants can
be attributed to both the emigration of Atlantic Silverside out of the shore zone
(Conover and Murawski 1982, Nixon and Oviatt 1973) and the tolerance of
resident fishes like those in the family Cyprinodontidae to fluctuating winter
temperatures (Able et al. 1996).
In addition to the dominant fishes, Blue Crab was also abundant in the
present study, particularly in the spring/summer nursery period. Blue Crabs
use the shores zone of estuarine creeks as juvenile nursery areas and adult
habitat (Orth and van Montfrans 1987, Rountree and Able 1992, Sogard and
Able 1991, Weinstein 1979, Wilson et al. 1990). Blue Crabs, most of which
were juveniles, were more abundant in White Creek (W1 and W2) than at other
locations, similar to findings from associated sampling in subtidal areas with
a 1-m beam trawl (Boutin 2008). These stations were characterized by dense
drift macroalgae along the shoreline. Several studies have noted the importance
of macroalgae as nursery habitat for juvenile Blue Crabs (Epifanio et al.
2003, Sogard and Able 1991).
In contrast to the similarities noted with other shore-zone studies, the
fish and Blue Crab assemblage structure in the shore zone of the tidal creeks
sampled in the present study was quite different than that reported for deeper,
subtidal areas in other Delmarva coastal bays. Bay Anchovy constitutes one of
the most abundant species in the subtidal zone of the Maryland and Delaware
coastal bays (Clark 2004, 2005; Murphy and Secor 2006; Tyler 2005), and
was generally absent from shore-zone collections. During a similar sampling
period as the present study, Clark (2004, 2005) found that Spot and Cynoscion
regalis (Bloch and Schneider) (Weakfish) were the dominant species in the
deep subtidal zone of tidal tributaries in Indian River and Rehoboth bays,
including White Creek. These species were rare or absent from our shorezone
collections. Furthermore, with the exception of Blue Crab, dominant
shore-zone nekton, including Mummichog and Atlantic Silverside, were
generally absent from accompanying subtidal sampling done during the present
study (Boutin 2008) and from other areas of the Maryland and Delaware
2013 B.P. Boutin and T.E. Targett 83
coastal bays (Clark 2004, 2005; Murphy and Secor 2006; Tyler 2005). These
differences may be attributed to the selectivity of the gear type used in the
present study (i.e., seine), biasing the sample towards less mobile resident
species very close to the shoreline. Seine length and design have been shown
to impact estimates of density and community structure (Steele et al. 2006).
Murphy (2005) found that, while most species were encountered during both
seine and trawl collections in the Maryland Coastal Bays, species dominance
was different depending on the gear type used, with generally more littoral
fauna collected in seines.
Species richness and total fish and Blue Crab exhibited distinct annual
trends during the spring/summer nursery period in 2004 and 2005. In 2004,
both metrics declined throughout the nursery period. Although studies in shorezone
and subtidal areas of New England (Nixon and Oviatt 1973), New Jersey
(Rountree and Able 1992), and Virginia (Weinstein and Brooks 1983) have
reported spring peaks in catch-per-unit-effort, all have indicated a secondary,
sometimes larger peak in catch in late summer or early autumn. The absence
of such a secondary peak in 2004 was due to the lack of an influx of species,
such as Atlantic Silverside, Bay Anchovy, and Blue Crab, reported in the previous
studies. It should be noted, however, several of these studies included both
shore-zone and subtidal areas in their assessments of seasonal peaks. In 2005,
there was a peak in species richness and a small peak in total fish and Blue Crab
density in summer. Murphy and Secor (2006) found a similar pattern in the
subtidal zone of the Maryland Coastal Bays; species richness peaked in early
summer during most years sampled. However, studies in New Jersey (Able
et al. 2001, Szedlmayer and Able 1996) and Virginia (Weinstein and Brooks
1983) reported peaks of species richness in late summer and early autumn. The
summer peak in density in the present study, due to high abundances of Mummichog
and Atlantic Silverside, is similar to what was found in the shore zone
of the Rehoboth and Indian River bays by Derickson and Price (1973), although
the peak in the present study was much smaller. Such within-season fluctuations
in species richness and total density can be attributed to annual spawning
cycles and emigration/immigration patterns, as well as seasonal changes in
abiotic habitat conditions (Able et al. 2001, Cowan and Birdsong 1985, Nixon
and Oviatt 1973, Rountree and Able 1992, Szedlmayer and Able 1996). Additionally,
year-to-year fluctuations in these metrics are directly influenced by
year-class strength of dominant species, such as Bay Anchovy, which regularly
exhibit poor year classes in the Delaware Coastal Bays (R. Kernehan, Center
for the Inland Bays, Rehoboth Beach, DE, pers. comm.).
Winter collections indicated a distinct reduction in species richness and density
compared to those during the spring/summer nursery period. Few individuals
were captured, with Sheepshead Minnows and Mummichogs, estuarine residents,
dominating the catch. Numerous authors have documented a seasonal decline in
species richness and density in estuaries along the east coast of the United States
(Derickson and Price 1973, Nixon and Oviatt 1973, Rountree and Able 1992,
Szedlmayer and Able 1996). Derickson and Price (1973) found similar patterns
84 Northeastern Naturalist Vol. 20, No. 1
of decline during sampling in the Rehoboth and Indian River bays. These declines
have been attributed to emigration of transient fauna related to declining
temperatures and food sources (Able et al. 1996, Nixon and Oviatt 1973, Szedlmayer
and Able 1996). Additionally, resident fauna that utilize the shore zone,
including Mummichog, move to refugia during winter (Smith and Able 1994),
further declining densities and/or richness in the shore zone. However, it must
be noted that sampling effort was less in the winter, which may have resulted in
missed species or individuals.
During the spring/summer nursery period in both 2004 and 2005, assemblage
structure differed between tidal creek stations bordering different
embayments (i.e., Miller Creek bordering Little Assawoman Bay versus
White Creek bordering Indian River Bay). These differences appeared to
be driven, at least in part, by the DO range at each tidal creek. While other
abiotic factors such as mean temperature, mean salinity, and mean DO were
also identified as significant correlates to the observed assemblages, only DO
range was consistent from year-to-year. Large fluctuations in DO in shallow
estuarine environments are often the result of photosynthesis and respiration
cycles of phytoplankton and macroalgae (D’Avanzo and Kremer 1994,
Tyler et al. 2009) and can be an indication of anthropogenic eutrophication.
Anthropogenic influence across the study location generally decreased latitudinally
from higher in White Creek (intensive shoreline development and
stabilization) to lower in Miller Creek (bordered by Assawoman Wildlife
Area). Development-induced nutrient loading can significantly affect the
types of fish present in a water body (Caddy 2000, Murphy and Secor 2006,
Price1998). A review of previous studies by Price (1998) indicated increased
nutrient loading, particularly in the northern Delaware Coastal Bays, has
shifted the dominant shoreline species from transient species including Spot
and Atlantic Silverside to more hypoxia-tolerant resident species, such as
Mummichog. This trend was apparent when comparing the shore-zone assemblage
structure at stations in White Creek with those in Miller Creek. The
White Creek shore-zone assemblage was dominated by Mummichog, whereas
the assemblage in Miller Creek contained a higher proportion of hypoxiasensitive
species, including Atlantic Silverside (Smith and Able 2003), which
dominated there. White Creek stations were characterized by dense drift macroalgae,
which can cause frequent hypoxic (<2.0 mg/L O2) to anoxic (<0.2
mg/L O2) conditions (D’Avanzo and Kremer 1994). The dominance of hypoxia-
tolerant resident species and general absence of facultative transient and
estuary-dependent species in White Creek indicates that macroalgae-induced
fluctuations in DO may be creating suboptimal conditions in this creek for
nursery use.
While abiotic factors such as DO range appeared to be influencing
the structuring of distinct assemblages in the spring/summer nursery period,
trends were somewhat less clear for winter collections. Only in winter
2004/2005 were abiotic factors found to be significant correlates to the fish
2013 B.P. Boutin and T.E. Targett 85
and Blue Crab assemblage structure, where DO range was again found to be
a driver. The absence of a consistent annual wintertime abiotic driver is not
surprising as hypoxia, which would cause a large DO range, occurs primarily
in spring and summer (Welsh and Eller 1991). This lack of winter hypoxia was
apparent during both years, as DO was regularly above 6 mg/L. Additionally,
sampling effort in the winter was much less than that in the spring/summer
nursery period. More intensive sampling during winter months may lead to
more firm conclusions as to the relationship between the fish and Blue Crab
assemblage structure and abiotic conditions.
Presence and type of structured habitats can also influence species composition
and assemblage structure. Szedlmayer and Able (1996) found that
the structural heterogeneity of subtidal bottom habitats in a New Jersey
estuary affected habitat-use patterns and species composition of fish and
macroinvertebrates. In the present study, each tidal creek differed in terms
of the dominant bottom type and the presence/absence of structured habitats.
Several species appeared to be associated primarily with locations containing
structure. For example, Rainwater Killifish densities were highest at stations
containing macroalgae (W1 and W2) or woody debris/leaf litter (A3 and A4).
Other species, such as the Sheepshead Minnow, followed a similar trend. Thus,
such small-scale changes in bottom type have the potential to affect assemblage
structure of shore-zone fishes and blue crabs.
Numerous authors have suggested the importance of abiotic conditions in
structuring faunal assemblages in coastal embayments (Able et al. 2001, Love
et al. 2009, Murphy and Secor 2006, Szedlmayer and Able 1996). While salinity
is often identified as a major driver in the structuring of assemblages (Able et
al. 2001, Love et al. 2009), it did not appear to play a major role in the present
study, although a slight salinity gradient was evident across sampling stations.
The range of DO at a particular grouping of stations and, more specifically,
the incidence of hypoxia was found to consistently correlate with assemblage
structures. Tidal creek stations characterized by highly fluctuating DO, such as
those in White Creek, were dominated by resident species (e.g., Mummichog),
which are particularly tolerant of anthropogenic impacts such as eutrophication
and low DO (Price 1998, Stierhof f et al. 2003). These stations generally lacked
high densities of facultative transient and estuary-dependent fauna, while those
stations more stable in DO (e.g., Miller Creek) contained these species. Tidal
creeks are intimately connected to adjacent marsh and upland systems, and
thus, alterations to the natural watershed can have significant impacts to the
nursery function of these habitats. It appears that the localized shore-zone fish
and Blue Crab assemblage in tidal creek systems in the Delaware Coastal Bays,
and perhaps other coastal systems (Bilkovic 2011, Partyka and Peterson 2008),
is affected primarily by creek watershed influences, such as anthropogenic impacts,
and degradation of these habitats may significantly alter the functionality
of these areas as nurseries.
86 Northeastern Naturalist Vol. 20, No. 1
Acknowledgments
We thank the individuals who provided field assistance for this project. We especially
thank M. Rhode, S. Baker, K.L. Miller, D. Tuzzollino, and B. Ciotti. R. Kernehan and
J. Clark provided helpful comments on the manuscript. This research was supported by
grants to T.E. Targett from the Delaware Department of Natural Resources and Environmental
Control (DNREC), Division of Fish and Wildlife, and the US Fish and Wildlife
Service, Federal Aid in Sport Fish Restoration, Wallop-Breaux fund (Project F-56-R-10),
through Delaware DNREC.
Literature Cited
Able, K.W., and M.P. Fahay. 2010. Ecology of Estuarine Fishes: Temperate Waters of
the Western North Atlantic. Johns Hopkins University Press, Baltimore, MD. 566 pp.
Able K.W., D.A. Witting, R.S. McBride, R.A. Rountree, and K.J. Smith. 1996. Fishes
of polyhaline estuarine shores in Great Bay - Little Egg Harbor, New Jersey: A case
study of seasonal and habitat influences. Pp. 335–353, In K.F. Nordstrom and C.T.
Roman (Eds.). Estuarine Shores: Evolution, Environments, and Human Alterations.
John Wiley and Sons, Chichester, UK.
Able, K.W., D.M. Nemerson, R. Bush, and P. Light. 2001. Spatial variation in Delaware
Bay (USA) marsh creek fish assemblages. Estuaries 24(3):441–452.
Able, K.W., S.M. Hagan, and S.A. Brown. 2003. Mechanisms of marsh habitat alteration
due to Phragmites: Response of young-of-the-year Mummichog (Fundulus heteroclitus)
to treatment for Phragmites removal. Estuaries 26(2B):484–494.
Able, K.W., J.H. Balletto, S.M. Hagan, P.R. Jivoff, and K. Strait. 2007. Linkages between
salt marshes and other nekton habitats in Delaware Bay, USA. Reviews in Fisheries
Science 15(1–2):1–61.
Bilkovic, D.M. 2011. Response of tidal creek fish communities to dredging and coastal
development pressures in a shallow-water estuary. Estuaries and Coasts 34:129–147.
Boutin, B.P. 2008. Tidal tributaries and nearshore areas as nursery habitat for juvenile
Sciaenid fishes and other estuarine nekton in Delaware Bay and the Delaware coastal
bays. Ph.D dissertation. University of Delaware, Newark, DE. 17 2 pp.
Bray, J.R., and J.T. Curtis. 1957. An ordination of the upland forest communities of
southern Wisconsin. Ecological Monographs 27(4):326–349.
Caddy, J.F. 2000. Marine catchment basin effects versus impacts of fisheries on semienclosed
seas. ICES Journal of Marine Science 57:628–640.
Chaillou, J.C., S.B. Weisberg, F.W. Kutz, T.E. DeMoss, L. Mangiaracina, R. Magnien,
R. Eskin, J. Maxted, K. Price, and J.K. Summers. 1996. Assessment of the ecological
condition of the Delaware and Maryland coastal bays. US Environmental Protection
Agency, Office of Research and Development, Washington, DC. 118 pp.
Clark, J.H. 2002. A brief fisheries assessment of the Assawoman Canal and nearby sections
of White and Jefferson Creeks including a comparison to a similar assessment
conducted in 1986. Delaware Department of Natural Resources and Environmental
Control, Division of Fish and Wildlife, Dover, DE. 13 pp.
Clark, J.H. 2004. Fish habitat considerations for Delaware’s tidal tributaries. Delaware
Department of Natural Resources and Environmental Control, Division of Fish and
Wildlife, Dover, DE. 50 pp.
2013 B.P. Boutin and T.E. Targett 87
Clark, J.H. 2005. Fish habitat considerations for Delaware’s tidal tributaries. Delaware
Department of Natural Resources and Environmental Control, Division of Fish and
Wildlife, Dover, DE. 55 pp.
Clarke, K.R. 1993. Nonparametric multivariate analyses of changes in community structure.
Australian Journal of Ecology 18(1):117–143.
Clarke, K.R., and M. Ainsworth. 1993. A method of linking multivariate community
structure to environmental variables. Marine Ecology Progress Series 92(3):205–219.
Conover, D.O., and S. Murawski. 1982. Offshore winter migration of the Atlantic Silversides,
Menidia menidia. Fisheries Bulletin 80:145–149.
Conover, D.O., and M.R. Ross. 1982. Patterns in seasonal abundance, growth and biomass
of the Atlantic Silverside, Menidia menidia, in a New-England estuary. Estuaries
5(4):275–286.
Cowan, J.H., and R.S. Birdsong. 1985. Seasonal occurrence of larval and juvenile fishes
in a Virginia Atlantic coast estuary with emphasis on drums (Family Sciaenidae).
Estuaries 8(1):48–59.
D’Avanzo, C., and J.N. Kremer. 1994. Diel oxygen dynamics and anoxic events in an
eutrophic estuary of Waquoit Bay, Massachusetts. Estuaries 17:131–139.
Day, J.W., C.A.S. Hall, W.M. Kemp, and A. Yanez-Arancibia. 1989. Estuarine Ecology.
John Wiley and Sons, New York, NY.
Deegan, L.A. 2002. Lessons learned: The effects of nutrient enrichment on the support of
nekton by seagrass and salt marsh ecosystems. Estuaries 25(4B): 727–742.
Delaware Inland Bays Estuary Program (DIBEP). 1995. A comprehensive conservation
and management plan for Delaware Inland Bays. Delaware Inland Bays Estuary Program,
Rehoboth Beach, DE. 157 pp.
Delaware Population Consortium. 2010. Annual population projections. Delaware Population
Consortium, Dover, DE. 69 pp.
Derickson, W.K., and K.S. Price. 1973. Fishes of shore zone of Rehoboth and Indian
River Bays, Delaware. Transactions of the American Fisheries Society
102(3):552–562.
de Sylva, D.P., F.A. Kalber, Jr., and C.N. Shuster, Jr. 1962. Fishes and ecological conditions
in the shore zone of the Delaware River Estuary, with notes on other species
collected in deeper water. University of Delaware Marine Laboratories Information
Series, Publication #5. University of Delaware, Newark, DE. 164 pp.
Epifanio, C.E., A.I. Dittel, R.A. Rodriguez, and T.E. Targett. 2003. The role of macroalgal
beds as nursery habitat for juvenile Blue Crabs, Callinectes sapidus. Journal of
Shellfish Research 22(3):881–886.
Holland, A.F., D.M. Sanger, C.P. Gawle, S.B. Lerberg, M.S. Santiago, G.H.M. Riekerk,
L.E. Zimmerman, and G.I. Scott. 2004. Linkages between tidal creek ecosystems and
the landscape and demographic attributes of their watersheds. Journal of Experimental
Marine Biology and Ecology 298(2):151–178.
Kjerfve, B. 1986. Comparative oceanography of coastal lagoons. Pp. 63–81, In
D.A.Wolfe (Ed.). Estuarine Variability. Academic Press, New York, NY. 509 pp.
Kjerfve, B., and K.E. Magill. 1989. Geographic and hydrodynamic characteristics of
shallow coastal lagoons. Marine Geology 88(3–4):187–199.
Love, J.W., P. Chigbu, and E.B. May. 2009. Environmental variability affects distributions
of coastal fish species (Maryland). Northeastern Naturalis t 16(2):255–268.
88 Northeastern Naturalist Vol. 20, No. 1
Mariani, S. 2001. Can spatial distribution of ichthyofauna describe marine influence on
coastal lagoons? A central Mediterranean case study. Estuarine Coastal and Shelf
Science 52(2):261–267.
Martin, D.M., T. Morton, T. Dobrzynski, and B. Valentine. 1996. Estuaries on the edge:
The vital link between land and sea. The American Oceans Campaign, Washington,
DC. 297 pp.
Maxted, J.R., R.A. Eskin, S.B. Weisberg, and F.W. Kutz. 1997. The ecological condition
of dead-end canals of the Delaware and Maryland Coastal Bays. Estuaries
20(2):319–327.
Moyle, P.B., and J.J. Cech. 1982. Fishes: An Introduction to Ichthyology. Prentice-Hall,
Englewood Cliffs, NJ. 593 pp.
Murphy, R.F. 2005. Fish assemblage structure in Maryland’s coastal lagoon complex.
M.Sc. Thesis. University of Maryland, College Park, MD. 95 pp.
Murphy, R.F., and D.H. Secor. 2006. Fish and Blue Crab assemblage structure in a US
mid-Atlantic coastal lagoon complex. Estuaries and Coasts 29(6B):1121–1131.
Nixon, S. 1982. Nutrient dynamics, primary production, and fisheries yields of lagoons.
Oceanologica Acta 4:357–371.
Nixon, S.W., and C.A. Oviatt. 1973. Ecology of a New England salt marsh. Ecological
Monographs 43(4):463–498.
National Oceanic and Atmospheric Administration (NOAA). 1990. Estuaries of the
United States: Vital statistics of a natural resource base. NOAA National Ocean Service,
Rockville, MD. 79 pp.
Orth, R.J., and J. van Montfrans. 1987. Utilization of a seagrass meadow and tidal marsh
creek by Blue Crabs, Callinectes sapidus. 1. Seasonal and annual variations in abundance
with emphasis on postsettlement juveniles. Marine Ecology Progress Series
41(3):283–294.
Pacheco, A.L., and G.C. Grant. 1965. Studies of the early life history of Atlantic Menhaden
in estuarine nurseries. Part I. Seasonal occurrence of juvenile menhaden and
other small fishes in a tributary creek of Indian River, Delaware, 1957–58. US Fish
and Wildlife Service Special Scientific Report – Fisheries No. 504. Washington, DC.
32 pp.
Partyka, M.L., and M.S. Peterson. 2008. Habitat quality and salt marsh species assemblages
along an anthropogenic estuarine landscape. Journal of Coastal Research
24(6):1570–1581.
Price, K.S. 1998. A framework for a Delaware inland bays environmental classification.
Environmental Monitoring and Assessment 51(1–2):285–298.
Raichel, D.L., K.W. Able, and J.M. Hartman. 2003. The influence of Phragmites (common
reed) on the distribution, abundance, and potential prey of a resident marsh fish
in the Hackensack Meadowlands, New Jersey. Estuaries 26(2B):511–521.
Richards, C.E., and M. Castagna. 1970. Marine fishes of Virginia’s eastern shore (inlet
and marsh, seaside waters). Chesapeake Science 11(4):235–248.
Rountree, R.A., and K.W. Able. 1992. Fauna of polyhaline subtidal marsh creeks in southern
New Jersey: Composition, abundance, and biomass. Estuaries 15(2):171–185.
Schwartz, F. 1961. Fishes of Chincoteague and Sinepuxent Bays. American Midland
Naturalist 65(2):384–408.
Schwartz, F. 1964. Fishes of Isle of Wight and Assawoman Bays near Ocean City, Maryland.
Chesapeake Science 5(4):172–193.
2013 B.P. Boutin and T.E. Targett 89
Shenker, J.M., and J.M. Dean. 1979. Utilization of an intertidal saltmarsh creek by
larval and juvenile fishes: Abundance, diversity, and temporal variation. Estuaries
2(3):154–163.
Smith, K.J., and K.W. Able. 1994. Salt marsh tide pools as winter refuges for the Mummichog,
Fundulus heteroclitus, in New Jersey. Estuaries 17(1B):226–234.
Smith, K.J., and K.W. Able. 2003. Dissolved oxygen dynamics in salt marsh pools
and its potential impacts on fish assemblages. Marine Ecology Progress Series
258:223–232.
Sogard, S.M., and K.W. Able. 1991. A comparison of Eelgrass, Sea Lettuce macroalgae,
and marsh creeks as habitats for epibenthic fishes and decapods. Estuarine, Coastal,
and Shelf Science 33(5):501–519.
Steele, M.A., S.C. Schroeter, and H.M. Pace. 2006. Experimental evaluation of biases
associated with sampling estuarine fishes with seines. Eastuaries and Coasts
29(68):1172–1184.
Stierhoff, K.L., T.E. Targett, and P.A. Grecay. 2003. Hypoxia tolerance of the Mummichog:
The role of access to the water surface. Journal of Fish Biology 63(3):580–592.
Szedlmayer, S.T., and K.W. Able. 1996. Patterns of seasonal availability and habitat
use by fishes and decapod crustaceans in a southern New Jersey estuary. Estuaries
19(3):697–709.
Timmons, M., and K.S. Price. 1996. The macroalgae and associated fauna of Rehoboth
and Indian River bays, Delaware. Botanica Marina 39(3):231–238.
Tiner, R.W. 2001 . Delaware’s wetlands: Status and recent trends. Cooperative National
Wetlands Inventory Publication. US Fish and Wildlife Service, Northeast Region,
Hadley, MA. 19 pp.
Tyler, R.M. 2005. Dissolved oxygen conditions and composition of the juvenile finfish
community in the Little Assawoman estuary. Delaware Department of Natural Resources
and Environmental Control, Division of Water Resources, Dover, DE.
Tyler, R.M. 2010. Seaweed distribution and abundance in the Inland Bays. Delaware
Department of Natural Resources and Environmental Control, Division of Water
Resources, Dover, DE. 18 pp.
Tyler, R.M., D.C. Brady, and T.E. Targett. 2009. Temporal and spatial dynamics of dielcycling
hypoxia in estuarine tributaries. Estuaries and Coasts 32:123–145.
US Census Bureau. 1995. Population of counties by decennial census: 1900 to 1990.
Available online at http://www.census.gov/population/cencounts/1900-90.txt. Accessed
6 June 2011.
Valdes-Murtha, L.M. 1997. Analysis of critical habitat requirements for restoration and
growth of submerged vascular plants in the Delaware and Maryland coastal bays.
M.Sc. Thesis. University of Delaware, Newark, DE. 240 pp.
Wagner, C.M. 1999. Expression of the estuarine species minimum in littoral fish assemblages
of the lower Chesapeake Bay tributaries. Estuaries 22(2A):304–312.
Wang, J.C.S., and R.J. Kernehan. 1979. Fishes of the Delaware Estuaries: A Guide to the
Early Life Histories. E.A. Communications, Towson, MD. 410 pp.
Weinstein, M.P. 1979. Shallow marsh habitats as primary nurseries for fishes and shellfish,
Cape Fear River, North Carolina. Fishery Bulletin 77:339–357.
Weinstein, M.P., and H.A. Brooks. 1983. Comparative ecology of nekton residing in a
tidal creek and adjacent seagrass meadow: Community composition and structure.
Marine Ecology Progress Series 12(1):15–27.
90 Northeastern Naturalist Vol. 20, No. 1
Welsh, B.L., and F.C. Eller. 1991. Mechanisms controlling summertime oxygen depletion
in western Long Island Sound. Estuaries 14(3):265–278.
Weston, R.F., Inc. 1993. Characterization of the Inland Bays Estuary. Report to the Delaware
Inland Bays National Estuary Program, Dover, DE.
Whitfield, A.K. 1999. Ichthyofaunal assemblages in estuaries: A South African case
study. Reviews in Fish Biology and Fisheries 9:151–186.
Wilson, K.A., K.W. Able, and K.L. Heck. 1990. Habitat use by juvenile Blue Crabs:
A comparison among habitats in southern New Jersey. Bulletin of Marine Science
46(1):105–114.
Yanez-Arancibia, A., A.L.L. Dominguez, and D. Pauly. 1994. Coastal lagoons as fish
habitats. Pp. 363–376, In B. Kjerfve (Ed.). Coastal Lagoon Processes. Elsevier Science
Publishers, Amsterdam, The Netherlands. 598 pp.