Northeastern Naturalist Vol. 21, No. 3
J.A. Cava, J.D. Riddle, and R.P. Thiel
2014
495
2014 NORTHEASTERN NATURALIST 21(3):495–505
Apparent Survival of Woodpeckers and Nuthatches in
Wisconsin
Jenna A. Cava1,*, Jason D. Riddle2, and Richard P. Thiel3
Abstract - Few annual survival and capture-probability estimates exist for sittid and picid
species common in North America. We used a mark–recapture study and robust design
analysis in Program MARK to estimate annual survival rates based on a sample of 51 Sitta
carolinensis (White-breasted Nuthatch), 12 Picoides pubescens (Downy Woodpecker),
and 15 Picoides villosus (Hairy Woodpecker) wintering in central Wisconsin, 2006–2013.
Apparent survival probability was similar between the two woodpecker species (Downy
Woodpecker: p = 0.51, 95% CI = 0.34–0.68; Hairy Woodpecker: p = 0.52, 95% CI = 0.36–
0.68). Apparent annual survival modeled as constant across time was low for both sexes of
White-breasted Nuthatch (0.25 [CI = 0.12–0.44] and 0.28 [CI = 0.14–0.49] for males and
females, respectively), but there was some evidence for annual variation in survival. All
three species showed evidence for a trap-happy response in which recapture probability
was higher than original capture probability, but it was stronger in the White-breasted Nuthatches
than the two woodpecker species. There is little evidence of temporary emigration
for any of the woodpecker taxa we studied. Our results provide baseline demographic data
for these species in Wisconsin and will be useful in planning future trapping studies.
Introduction
Basic demographic data often are lacking for species considered common,
widespread, or not threatened. However, it is important to obtain demographic data
as a baseline for future comparisons and expand our knowledge of these species.
Picoides pubescens L. (Downy Woodpecker), Picoides villosus L. (Hairy Woodpecker),
and Sitta carolinensis (Latham) (White-breasted Nuthatch) are common
species in North America and are currently designated as species of least concern
by the IUCN (Grubb and Pravosudov 2008, Jackson and Ouellet 2002, Jackson et
al. 2002). Research focused on the demographics of these species is scarce (Grubb
and Pravosudov 2008, Jackson and Ouellet 2002, Jackson et al. 2002), and information
is often embedded within articles investigating several species and general
topics (e.g., Karr et al. 1990). Most demographic studies, while valuable, are geographically
limited and provide an incomplete view of survivorship in these widely
distributed species (e.g., Doherty and Grubb 2002, Karr et al. 1990). The Monitoring
Avian Productivity and Survivorship (MAPS) Program provides low-resolution
estimates from regions across North America; however, these estimates may not be
directly comparable to other studies (Michel et al. 2006).
1Department of Biology, University of Wisconsin-Stevens Point, Stevens Point, WI 54481.
2Wildlife Ecology and Management, College of Natural Resources, University of Wisconsin-
Stevens Point, WI 54481. 37167 Deuce Road, Tomah, WI 54660. *Corresponding author
- jennaacava@gmail.com.
Manuscript Editor: Jeremy Kirchman
Northeastern Naturalist
496
J.A. Cava, J.D. Riddle, and R.P. Thiel
2014 Vol. 21, No. 3
Thus far, all studies reporting survivorship for any of these species have
utilized Cormack-Jolly-Seber (CJS)-type models, which allow estimation of
apparent annual survival and capture probabilities (Cormack 1964, DeSante et al.
1998, Doherty and Grubb 2002, Jolly 1965, Karr et al. 1990, Seber 1965). Another
method for estimating these parameters is Pollock’s robust design, which uses additional
closed-capture information (Kendall 2001, Kendall et al. 1997, Pollock
1982). Modified versions of these models allow temporary movement of individuals
from the study site, which accounts for an additional source of variation
in capture probabilities (Kendall and Nichols 1995, Kendall et al. 1997, Pollock
1982). Neither of these methods discerns probabilities of permanent emigration
and mortality, resulting in an estimate of apparent survival that concedes some
degree of uncertainty, as opposed to true survival (Gilroy et al. 2012, Lebreton et
al. 1992). Some researchers have developed methods to reduce bias in survival
estimates by using predicted dispersal rates combined with survival data (Gilroy
et al. 2012), including emigration and mortality data in capture histories (Horton
and Letcher 2008), or increasing the area covered for resighting individuals
(Marshall et al. 2004) to provide more accurate survival estimates. These methods
for obtaining estimates of survivorship require prior knowledge of a population’s
movement patterns that is not available for many species or collection of additional
data that may be impractical given a study’s objectives or resources (Horton
and Letcher 2008). Estimation of temporary movements, capture probabilities,
recapture probabilities, and survival rates via model selection potentially provide
improved demographic and ecological information for understudied species that
scientists may use to identify future research priorities.
Our objectives were (1) to provide apparent survival and capture probabilities
for the Downy Woodpecker, Hairy Woodpecker, and White-breasted Nuthatch in
Wisconsin using the robust design method, and (2) determine the extent of temporary
movement and trap response.
Field-site Description
Our study site was North Bluff, an approximately 259-ha Quercus spp. (oak) and
Populus spp. (aspen) forest located within the southwest corner of Sandhill Wildlife
Area, WI (N44°19'6.1", W90°10'50.6"). The surrounding area is a mix of marsh and
forest patches. The trapping scheme comprised 2 concentric rings of suet-baited
live traps with 13 traps surrounding the base of the bluff and 7 around the top of the
bluff during 2006–2008, and 14 surrounding the base and 9 around the top during
2009–2013. We affixed traps to live tree trunks 1.2 m–1.4 m above the ground and
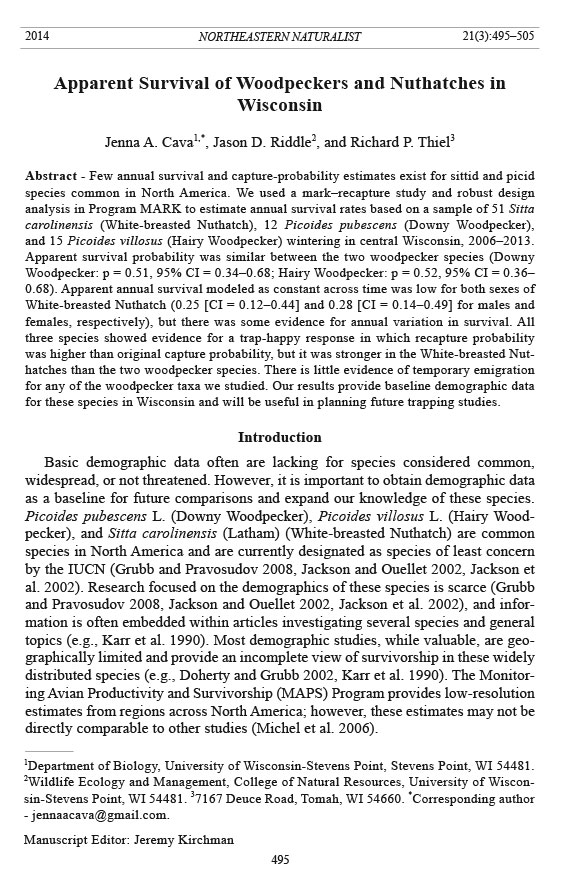
spaced them about 160 m apart along the arc of the concentric rings (Fig. 1).
Methods
We made our traps based on a design by Fiske (1968). Trapping commenced during
late January and ended with the snowmelt in early March each year. We trapped
Saturdays and Sundays depending on weather restrictions and time of snowmelt,
Northeastern Naturalist Vol. 21, No. 3
J.A. Cava, J.D. Riddle, and R.P. Thiel
2014
497
for an average of 6 trapping sessions per year (range = 5–9 sessions). We opened
traps at 06:00 and checked them at 09:00, 12:00, and 15:00. Traps were wired shut
between Saturday at 15:00 and Sunday at 06:00 to prevent loss of bait and wired
open during the week so birds could consume excess bait without capture.
We banded birds with sequentially numbered aluminum US Geological Survey
bands in all years. We determined sex by plumage (Pyle et al. 1987). We captured
51 White-breasted Nuthatches (29 males, 22 females), 12 Downy Woodpeckers
(6 males, 6 females), and 15 Hairy Woodpeckers (8 males, 7 females) during the 8
years of this study (Table 1). All recaptures occurred at traps as opposed to resighting
birds, so that we estimated capture probabilities, not detection probabilities in
our models.
Figure 1. Aerial view of our study site, located within Sandhill Wildlife Area, WI. Traps
21–23 were not used during 2006–2008.
Northeastern Naturalist
498
J.A. Cava, J.D. Riddle, and R.P. Thiel
2014 Vol. 21, No. 3
All statistical analyses were conducted in Program MARK (White and Burnham
1999). We assessed apparent annual survival (ϕ), within-year initial capture (p) and
recapture (c) probabilities, and between-season temporary emigration probability
(γ' and γ'') using the robust design (Kendall et al. 1997, Pollock 1982). The robust
design assumes a closed population during the secondary sampling period, which in
our study was between late January and early March. None of the species we studied
reproduce during this time period, and the limited evidence available on these
and related species suggests little dispersal occurs then (Grubb and Pravosudov
2008, Jackson and Ouellet 2002, Jackson et al. 2002). We did not expect dispersal
of White-breasted Nuthatches to occur during this time period because winter
territories are established during the fall (Butts 1931)), and in Sitta europaea L.
(European Nuthatch) dispersal is rare after an individual’s first summer (Mattysen
and Schmidt 1987). Downy Woodpeckers are known to inhabit their breeding home
range during January–March, which suggests it is unlikely many disperse during
late winter (Kellam 2003).
We compared models that predicted a trap response, which allowed p and c to
differ, to models that predicted no trap response, which held c equal to p. Because
there was no indication that capture or recapture probabilities varied between years,
we held p and c constant over time in all models.
Temporary emigration can be modeled as Markovian or random using gamma-
prime (γ', the probability that an individual will be absent from the study
area if it was absent during the previous primary sampling session) and gammadouble-
prime (γ'', the probability that an individual will be absent from the study
area if it was present during the previous primary sampling session) (Kendall et
al. 1997). For Markovian movement, the probability of an individual being on
the study site depends on whether it was on or off the study site during the previous
sampling session, and both γ'and γ'' may vary in the models. For random
movement, the probability of an individual being on the study site is independent
of its prior location, and γ' and γ'' are set equal to each other in the models.
An absence of emigration can also be modeled by setting both gammas equal to
zero. Results of preliminary analyses showed that we were unable to estimate
Table 1. Hairy Woodpecker, Downy Woodpecker, and White-breasted Nuthatch captures and recaptures
for each species per year; all data were collected at Sandhill Wildlife Area, WI, 2006–2013.
Hairy Woodpecker Downy Woodpecker White-breasted Nuthatch
Captures Recaptures Captures Recaptures Captures Recaptures
2006 0 0 4 0 15 6
2007 7 4 12 9 34 27
2008 7 6 4 4 12 7
2009 15 9 15 12 31 27
2010 17 15 9 9 39 25
2011 11 10 0 0 0 0
2012 6 5 6 4 39 29
2013 12 11 19 19 19 17
Total 75 60 69 57 189 138
Northeastern Naturalist Vol. 21, No. 3
J.A. Cava, J.D. Riddle, and R.P. Thiel
2014
499
temporary emigration as Markovian, so we only considered classical random
emigration and an absence of emigration in our models (Kendall et al. 1997).
Thus, in our models, we either held both γ' and γ'' constant over time (constant
random emigration), or fixed γ at zero (no emigration).
We modeled Downy and Hairy Woodpeckers together because of the similarity
between their ecologies; White-breasted Nuthatches had their own model set. We
constructed the initial woodpecker model set to investigate species and year effects
on annual survival: ϕ was either held constant over time and between species, allowed
to vary over time but constant between species, held constant over time but
allowed to vary between species, or allowed to vary over time and between species.
We then constructed an initial White-breasted Nuthatch model set to test sex and
year effects on annual survival: ϕ was either held constant over time and between
sexes, allowed to vary over time but constant between sexes, held constant over
time but allowed to vary between sexes, or allowed to vary over time and between
sexes. Models in both sets also investigated presence versus absence of a trap response
with p and c always held constant over time and between species or sexes
for woodpeckers or nuthatches, respectively. Finally, we used our models to assess
random emigration versus an absence of temporary emigration, with both γ' and
γ'' always held constant over time and between species or sexes for woodpeckers
or nuthatches, respectively. All possible combinations of the parameters listed for
each model set were included.
Results
Several woodpecker models were unable to estimate all parameters, including
those that allowed γ' and γ'' to vary from zero or allowed survival to vary by year
and species. We removed these models from our analysis to produce a final reduced
set containing 6 models (Table 2). The top model (5W) accounted for double the
AICc weight of the second-best model (13W), and together these had the majority
of support (73%). Both models showed no difference in survival between Downy
Table 2. Woodpecker reduced model set, ordered by AICc weight; all data were collected at Sandhill
Wildlife Area, WI, 2006–2013. ϕ = apparent annual survival, p = initial capture probability, c =
recapture probability, γ' = probability of the individual being off the study area given it was also off
the study area during the previous primary sampling session, and γ'' = probability of the individual
being off the study area given it was on the study area during the previous primary sampling session.
# = number of parameters.
AICc
Model ϕ p c γ' γ'' AICc weight # Deviance
5W Constant Constant Constant 0 0 539.21 0.51 3 475.04
13W Constant * * 0 0 540.85 0.22 2 478.77
6W Species Constant Constant 0 0 541.22 0.19 4 474.92
14W Species * * 0 0 542.83 0.08 3 478.66
7W Year Constant Constant 0 0 549.93 0.00 9 472.50
15W Year * * 0 0 551.55 0.00 8 476.42
*p (initial capture probability) and c (recapture probability) were set equal to each other.
Northeastern Naturalist
500
J.A. Cava, J.D. Riddle, and R.P. Thiel
2014 Vol. 21, No. 3
and Hairy Woodpeckers. Models 6W and 14W estimated each species’ survival
separately and collectively represented the rest of support, suggesting there may be
some difference between the species. Models 7W and 15W allowed survival to vary
by year but held almost none of the support (less than 1%), indicating constant survival
over time. Model-averaged apparent annual survival probability was 0.51 (95% CI
= 0.34–0.68) and 0.52 (95% CI = 0.36–0.68) for Downy and Hairy Woodpeckers,
respectively. Models 5W, 6W, and 7W indicated a trap response, while 13W, 14W, and
15W did not. Model-averaged recapture probability was higher than initial capture
probability when estimated separately, but the confidence interval of p overlapped
the point estimate of c (p = 0.31, 95% CI = 0.21–0.43; c = 0.39, 95% CI = 0.32–
0.46). All models in the woodpecker set indicated no temporary movement from the
study site (γ' = 0 and γ'' = 0, but see below).
All White-breasted Nuthatch models that allowed survival to vary by year or
by year and sex were unable to estimate all survival parameters and we removed
them from further analyses. However, models 3N and 7N, which allowed survival to
vary by year, held the majority of AIC weight (67%) in the initial model set. This
result provided evidence of annual variation in survival, with estimates ranging
from 0.12 (95% CI = 0.02–0.53) to 0.60 (95% CI = 0.25–0.87) for both sexes. We
did not include these models in the reduced model set used for averaging because
the inestimable survival parameters for 2011 and 2012 would have interfered with
the averaging procedure. The final reduced model set contained 8 models (Table 3).
Similar apparent annual survival between the sexes held most of the support, but
there was some evidence of a sex difference (Table 3). Model-averaged apparent
annual survival was 0.25 (95% CI = 0.12–0.44) for males and 0.28 (95% CI =
0.14–0.49) for females. The top four models allowed for trap response while the
Table 3. White-breasted Nuthatch reduced model set, ordered by AICc weight; all data were collected
at Sandhill Wildlife Area, WI, 2006–2013. ϕ = apparent annual survival, p = initial capture probability,
c = recapture probability, γ' = probability of the individual being off the study area given it was
also off the study area during the previous primary sampling session, and γ'' = probability of the individual
being off the study area given it was on the study area during the previous primary sampling
session. # = number of parameters.
AICc
Model ϕ p c γ' γ'' AICc weight # Deviance
5N Constant Constant Constant Zero Zero 667.95 0.40 3 466.41
1N Constant Constant Constant ** ** 668.70 0.28 4 465.07
6N Sex Constant Constant Zero Zero 669.42 0.19 4 465.80
2N Sex Constant Constant ** ** 670.25 0.13 5 464.50
9N Constant * * ** ** 678.78 0.00 3 477.25
10N Sex * * ** ** 680.32 0.00 4 476.69
13N Constant * * Zero Zero 681.91 0.00 2 482.44
14N Sex * * Zero Zero 683.35 0.00 3 481.82
*p (initial capture probability) and c (recapture probability) were set equal to each other.
**Probability of the individual being off the study area if it was off the study area during the previous
primary sampling session set equal to the probability of the individual being off the study area if it
was on the study area during the previous primary sampling session.
Northeastern Naturalist Vol. 21, No. 3
J.A. Cava, J.D. Riddle, and R.P. Thiel
2014
501
rest did not; collectively these top 4 held >99% of the support, indicating that a trap
response occurred. Nuthatches showed a trap-happy response with higher recapture
probability than initial capture probability: p = 0.23, 95% CI = 0.14–0.35; c = 0.44,
95% CI = 0.39–0.50. Models that indicated an absence of emigration from the study
site held slightly more support than models that indicated some temporary random
emigration (Table 3). This finding suggests that there is a small rate of temporary
emigration (model averaged: γ' = 0.10, 95% CI = 0.002–0.898, and γ'' = 0.10, 95%
CI = 0.002–0.898).
Discussion
We found low to moderate annual survival for three species of permanent
resident birds living in central Wisconsin: White-breasted Nuthatch, Downy
Woodpecker, and Hairy Woodpecker. Average annual survival for White-breasted
Nuthatches was only half that of Downy or Hairy Woodpecker survival, resulting
in higher individual turnover. Although we were unable to provide estimates for
each year, the model set indicated that there were yearly differences. High annual
variation and low survival makes this study population susceptible to large fluctuations.
Our model-averaged White-breasted Nuthatch apparent survival estimates
are most similar to those obtained in a fragmented forest landscape in Ohio (0.27 ±
0.06; Doherty and Grubb 2002) and slightly lower than those obtained in Maryland
(0.35 ± 0.01; Karr et al. 1990).
We found similar apparent annual survival between Downy and Hairy
Woodpeckers. Our small sample size may have prevented us from observing a
noteworthy difference in survival between these species, but the current lack of
data in the literature prevents us from substantiating whether or not we are missing
a true difference. Apparent annual survival for these two species was moderate and
consistent. Existing Downy Woodpecker apparent annual survival estimates differ,
with the lowest estimate obtained in Ohio (0.26 ± 0.11; Doherty and Grubb 2002)
and a higher one obtained in Maryland (0.64 ± 0.07; Karr et al. 1990). However,
Doherty and Grubb (2002) observed a positive correlation between annual survival
probability and woodlot size in Ohio, with their model-averaged estimate (0.26 ±
0.11) on the low end of the range of estimates. Apparent survival estimates from
larger woodlots in Ohio were similar to our estimates from Wisconsin, where our
study site was in a section of a large forest. We found multiple apparent survival
estimates for Downy Woodpeckers and White-breasted Nuthatches, but the MAPS
program was the only source we found for Hairy Woodpeckers.
The MAPS program provides the following apparent annual survival estimates
for the north-central region during 1989–2006: White-breasted Nuthatch survival =
0.526 ± 0.138, Downy Woodpecker survival = 0.393 ± 0.054, and Hairy Woodpecker
survival = 0.552 ± 0.114 (Michel et al. 2006). These estimates are higher than
ours for the White-breasted Nuthatch, slightly lower for the Downy Woodpecker,
and similar for the Hairy Woodpecker. There are several potential explanations for
these differences: the MAPS program has a larger spatial scale over which data
were collected, it uses models that have been modified to reduce bias caused by the
Northeastern Naturalist
502
J.A. Cava, J.D. Riddle, and R.P. Thiel
2014 Vol. 21, No. 3
inclusion of transient individuals in the dataset, and it did not consider temporary
movement of individuals (Michel et al. 2006, Nott and DeSante 2000). Wisconsin
is near the eastern edge of the MAPS north-central region, which extends west to
central Montana, south to Nebraska, and north into Alberta and Saskatchewan (Michel
et al. 2006). Annual survival is calculated from data collected across this entire
region (Michel et al. 2006) and probably varies among areas and habitat types and
quality when studied at a finer scale. Inclusion of transient individuals depresses
survival estimates from unadjusted CJS and robust design analyses because these
individuals are uncatchable after they leave the study area (Nott and DeSante
2000, Pradel at al. 1997). Our dataset may have included transient individuals of
each species but their inclusion does not explain all the variation because not all
of our estimates were lower than the MAPS estimates. The MAPS estimates also
may have been impacted by the exclusion of temporary emigration in their models
(Pollock et al. 1990). Our estimates may have been affected by small sample size,
but our results are broadly consistent with results of studies with larger sample
sizes (Doherty and Grubb 2002, Karr et al. 1990). Recapture-sample sizes for these
species are also small in the MAPS north-central region study because, in order
to exclude transients, they calculated survival inference based only on individuals
that were recaptured within their initial year of capture (White-breasted Nuthatch:
8 recaptures of 150 captures, Downy Woodpecker: 58 of 583, Hairy Woodpecker:
13 of 107; Michel et al. 2006).
In our study, recapture probability was higher than initial capture probability for
all 3 species, demonstrating a trap-happy response when attracted with bait. This
is the first study to demonstrate a trap response for any of these species. Failure to
account for a trap-happy response when it exists can impact the estimates of other
important demographic parameters. Studies that provide a single-capture probability
are not directly comparable to our capture parameters (Doherty and Grubb 2002,
Michel et al. 2006). The majority of individuals we captured consistently returned
to traps, although there were several exceptions which may have been transients,
individuals that became trap-shy, or birds whose home-range edge coincided with
the edge of our trapping grid. Despite these exceptions, all capture probabilities
per trapping session were high enough to suggest that we caught most of the birds
available for capture each year.
Downy Woodpeckers, Hairy Woodpeckers, and White-breasted Nuthatches are
permanent residents across their ranges, but detailed movement information is currently
lacking (Grubb and Pravosudov 2008, Jackson and Ouellet 2002, Jackson et
al. 2002). White-breasted Nuthatches are known to engage in irruptive movements
(Grubb and Pravosudov 2008), which may explain their absence on our study site in
the winter of 2011; however, we cannot rule out complete mortality because none of
the individuals on the study site in 2010 returned. Our data and models suggest that
there is low to no temporary emigration occurring, although low sample sizes may
account for a complete lack of temporary emigration observed in the woodpeckers
and the difficulty in estimating it in the White-breasted Nuthatches. Indeed, the
majority of individuals on our study site either (1) stayed on site for several seasons
Northeastern Naturalist Vol. 21, No. 3
J.A. Cava, J.D. Riddle, and R.P. Thiel
2014
503
before disappearance, (2) were present for a single season, but were captured multiple
times within the season, or (3) disappeared from the site after a single capture.
These observations are not the result of temporary movement, but reflect mortality
and permanent emigration.
Estimating true survival requires distinction between the rates of mortality and
permanent emigration in a population (Horton and Letcher 2008, Marshall et al.
2004). Methods that can distinguish these two processes often require collection of
additional data on dispersal and mortality (Gilroy et al. 2012, Horton and Letcher
2008, Marshall et al. 2004). Prior knowledge of permanent emigration rates also can
increase certainty in apparent survival estimates. Apparent survival is the product
of true survival and site fidelity (Lebreton et al. 1992). If the site fidelity rate is
100% (i.e., permanent emigration = 0%), then true survival is equal to the apparent
survival estimate. Therefore apparent survival estimates for populations displaying
little to no permanent emigration should be closer to true survival than apparent survival
estimates for populations with high rates of permanent emigration. We were
unable to find information on the rate of permanent emigration for any of our study
species. Telemetry or more extensive mark–recapture studies will be necessary to
determine the extent of site fidelity in these species.
Our results may be useful in planning future trapping studies for these birds. The
capture probabilities we recorded indicate that baited, mesh-wire traps are effective
for capture of wintering woodpeckers and White-breasted Nuthatches. We also
found that relatively few, short trapping sessions were required to capture nearly
all resident individuals in our study area. This method can be especially helpful in
studies that require unique marks on as many birds as possible, including research
concerning home ranges, behavioral interactions, and dispersal. However, obtaining
large sample sizes will require significant investment in materials and time if
this method is used.
Acknowledgments
We thank Dr. Jeremy Kirchman and two anonymous reviewers for their helpful comments
on this manuscript. We thank Dr. Kenneth Pollock for a helpful review of a previous
version of this manuscript. We also thank past project leaders A. Purdy, B. Sadler, B. Winter,
K. Witkowski, R. Sheldon, E.E. Scherer, and all other student volunteers who assisted in data
collection. We thank the staff at Sandhill Wildlife Area, Babcock, WI, and the Wisconsin
Department of Natural Resources, Madison, WI, for use of their facilities and field site. The
University of Wisconsin-Stevens Point Student Chapter of the Wildlife Society and Student
Government Association provided logistical and financial support. Banding was conducted
under permit number 21040 issued to R.P. Thiel. The University of Wisconsin-Stevens Point
Institutional Animal Care and Use Committee approved trapping, handling, and marking protocols
(protocol number 20011.11.12). We have no conflict of interest to declare.
Literature Cited
Butts, W.K. 1931. A study of the Chickadee and White-breasted Nuthatch by means of
marked individuals. Part III: The White-breasted Nuthatch (Sitta carolinensis cookei).
Bird-Banding 2:59–76.
Northeastern Naturalist
504
J.A. Cava, J.D. Riddle, and R.P. Thiel
2014 Vol. 21, No. 3
Cormack, R.M. 1964. Estimates of survival from the sighting of marked animals. Biometrika
51:429–438.
DeSante, D.F, D.R. O’Grady, K.M. Burton, P. Velez, D. Froehlich, E.E. Feuss, H. Smith,
and E.D. Ruhlen. 1998. The Monitoring Avian Productivity And Survivorship (MAPS)
program sixth and seventh annual report (1995 and 1996). Bird Populations 4:69–122.
Doherty, P.F., and T.C. Grubb. 2002. Survivorship of permanent-resident birds in a fragmented
forested landscape. Ecology 83:844–857.
Fiske, J. 1968. Woodpecker trap. Eastern Bird Banding Association 31:154–155.
Gilroy, J.J., T. Virzi, R.L. Boulton, and J.L. Lockwood. 2012. A new approach to the apparent
survival problem: Estimating true survival from mark–recapture studies. Ecology
93(7):1509–1516.
Grubb, T.C., Jr., and V.V. Pravosudov. 2008. White-breasted Nuthatch (Sitta carolinensis),
In A.Poole (Ed.). The Birds of North America Online. Cornell Lab of Ornithology,
Ithaca, NY. Available online at http://bna.birds.cornell.edu/bna/species/054. Accessed
Accessed 10 March 2013.
Horton, G.E., and B.H. Letcher. 2008. Movement patterns and study area boundaries: Influences
on survival estimation in capture–mark–recapture studies. Oikos 117:1131–1142.
Jackson, J.A., and H.R. Ouellet. 2002. Downy Woodpecker (Picoides pubescens), In A.
Poole (Ed.). The Birds of North America Online. Cornell Lab of Ornithology, Ithaca,
NY. Available online at http://bna.birds.cornell.edu/bna/species/613. Accessed 10
March 2013
Jackson, J.A., H.R. Ouellet, and B.J. Jackson. 2002. Hairy Woodpecker (Picoides villosus).
In A. Poole (Ed.). The Birds of North America Online. Cornell Lab of Ornithology,
Ithaca, NY. Available online at http://bna.birds.cornell.edu/bna/species/702. Accessed
10 March 2013.
Jolly, G.M. 1965. Explicit estimates from capture–recapture data with both death and immigration–
stochastic model. Biometrika 52:225–247.
Karr, J.R., J.D. Nichols, M.K. Klimkiewicz, and J.D. Brawn. 1990. Survival rates of
birds of tropical and temperate forests: Will the dogma survive? American Naturalist
136:277–291.
Kellam, J.S. 2003. Downy Woodpecker pair-bond maintenance in winter: Proximate and
ultimate mechanisms. Ph.D. Thesis. Purdue University, West Lafayette, IN. 196 pp.
Kendall, W.L. 2001. The robust design for capture–recapture studies: Analysis using
program MARK. Pp. 357–360, In R. Field, R.J. Warren, H. Okarma, and P.R. Sievert
(Eds.). Wildlife, Land, and People: Priorities for the 21st Century. The Wildlife Society,
Bethesda, MD. 437 pp.
Kendall, W.L., and J.D. Nichols. 1995. On the use of secondary capture–recapture samples
to estimate temporary emigration and breeding proportions. Journal of Applied Statistics
22:751–762.
Kendall, W.L., J.D. Nichols, and J.E. Hines. 1997. Estimating temporary emigration using
capture–recapture data with Pollock’s robust design. Ecology 78:563–578.
Lebreton, J.D., K.P. Burnham, J. Clobert, and D.R. Anderson. 1992. Modeling survival and
testing biological hypotheses using marked animals: A unified approach with case studies.
Ecological Monographs 62:67–118.
Marshall, M.R., D.R. Diefenbach, L.A. Wood, and R.J. Cooper. 2004. Annual survival estimation
of migratory songbirds confounded by incomplete breeding-site fidelity: Study
designs that may help. Animal Biodiversity and Conservation 27:59–72.
Matthysen, E., and K. Schmidt. 1987. Natal dispersal in the Nuthatch. Ornis Scandinavica
18:313–316.
Northeastern Naturalist Vol. 21, No. 3
J.A. Cava, J.D. Riddle, and R.P. Thiel
2014
505
Michel, N., D.F. DeSante, D.R. Kaschube, and M.P. Nott. 2006. The Monitoring Avian Productivity
And Survivorship (MAPS) Program annual reports, 1989–2003. NBII/MAPS
avian demographics query interface. Available online at http://www.birdpop.org/nbii/
NBIIHome.asp. Accessed December 2006.
Nott, M.P., and D.F. DeSante. 2002. Demographic monitoring and the identification of
transients in mark–recapture models. Pp. 727–736, In J.M. Scott, P.J. Heglund, M.
Morrison, M. Raphael, J. Haufler, and B. Wall (Eds.). Predicting Species Occurrences:
Issues of Scale and Accuracy. Island Press, Covello, CA.
Pollock, K.H. 1982. A capture–recapture design robust to unequal probability of capture.
Journal of Wildlife Management 46:757–760.
Pradel, R., J. Hines, J.D. Lebreton, and J.D. Nichols. 1997. Estimating survival probabilities
and proportions of transients using capture–recapture data. Biometrics 53:60–72.
Pyle, P., S.N.G. Howard, R.P. Yunick, and D.F. DeSante. 1987. Identification Guide to
North American Passerines. State Creek Press, Bolinas, CA. 732 pp.
Seber, G.A.F. 1965. A note on the multiple recapture census. Biometrika 52:249–259.
White, G.C., and K.P. Burnham. 1999. Program MARK: Survival estimation from populations
of marked animals. Bird Study Supplement 46:120–138.