Genetic Variation within and among Remnant Big
Bluestem (Andropogon gerardii, Poaceae) Populations in
the Carolinas
Robert D. Tompkins, Dorset W. Trapnell, J.L. Hamrick, and William C. Stringer
Southeastern Naturalist, Volume 11, Issue 3 (2012): 455–468
Full-text pdf (Accessible only to subscribers.To subscribe click here.)
2012 SOUTHEASTERN NATURALIST 11(3):455–468
Genetic Variation within and among Remnant Big
Bluestem (Andropogon gerardii, Poaceae) Populations in
the Carolinas
Robert D. Tompkins1,*, Dorset W. Trapnell2, J.L. Hamrick2,
and William C. Stringer3
Abstract - Genetic diversity within and among nine Andropogon gerardii (Big Bluestem)
populations from various physiographic regions of North and South Carolina
was assessed. Genetic diversity was high at both the species level and at the population
level. At the species level, percent polymorphic loci (P) was 96.4% (27 of 28 loci), the
number of alleles per polymorphic locus (AP) was 4.07, and genetic diversity (He) was
0.425. Mean within population values were P = 82.6%, AP = 2.68, and He = 0.351. Within
population genetic diversity (He) ranged from 0.190 to 0.466. Allelic richness values per
population ranged from 37 to 71. The proportion of genetic diversity among populations
(Gst) was 0.166. Mean genetic diversity for the 3 larger populations (He = 0.369) and
within the 6 smaller populations (He
= 0.341) did not differ significantly (P = 0.554).
Nei’s unbiased genetic identity between pairs of populations ranged from 0.652 to 0.975.
Mean genetic identity of individual populations with the 8 other populations ranged
from 0.71 to 0.89. A Mantel test showed no significant genetic isolation by geographic
distance (r = 0.065; P = 0.614). While banding patterns for most of the loci were consistent
with disomic inheritance, two loci (PGI3; UGPP1) displayed patterns consistent
with tetrasomic inheritance. Results of this study suggest that Big Bluestem populations
in the Carolinas were once more widespread.
Introduction
The amount and distribution of genetic variation within species is of considerable
interest because of its important evolutionary and conservation implications
(Huenneke 1991). Such studies are critical to understanding the fate of the increasing
number of rare and endangered species. As a consequence of genetic
drift, inbreeding, and restricted gene flow, small, isolated populations should
have less genetic variation compared to larger populations. If gene flow among
populations is low, and genetic drift is the dominant evolutionary factor affecting
populations, genetic differentiation among populations should be high (Huenneke
1991). This expectation has been supported by the findings that small populations
are often more genetically differentiated than larger populations (Demauro 1993;
Fischer and Matthies 1998; Fischer et al. 2000, 2003; Heschel and Paige 1995;
Kery et al. 2000; Leimu et al. 2006; Luijten et al. 2000; Oostermeijer et al. 1994;
Pleasants and Wendel 1989; Van Treuren et al. 1990). Small populations are also
thought to be more prone to extinction than larger populations due to reduced
¹Department of Biology, Belmont Abbey College, Belmont, NC 28012. 2Department of
Plant Biology, University of Georgia, Athens, GA 30602. 3Department of Plant and Environmental
Sciences, Clemson University, Clemson, SC 29634. *Corresponding author
- roberttompkins@bac.edu.
456 Southeastern Naturalist Vol. 11, No. 3
genetic variability and reduced resistance to environmental and demographic
stochasticity (Gilpin and Soule 1986).
Although common in the midwestern US, Andropogon gerardii (Big
Bluestem) is relatively rare in the eastern US (Radford et al. 1968, Tompkins et
al. 2010a). Where it occurs, it is often found in small, fragmented populations
that are thought to consist of clonal units (Chappell 2003). Although never as
expansive as midwestern prairies, eastern Piedmont prairies probably occurred in
isolated patches throughout the pre-settlement landscape (Barden 1997, Davis et
al. 2002). The original range of Big Bluestem and other native prairie species in
the Carolina Piedmont have probably been much reduced due to modern land-use
practices and long-term fire suppression in the landscape (Barden 1997).
Midwestern populations of Big Bluestem are self-incompatible, and possess
a pre-zygotic incompatibility mechanism that results in the failure of the pollen
tube to penetrate the style, which results in low reported seed set of 0.2 to 6.0%
following self-pollination (McKone et al. 1998, Norrmann et al. 1997). Postzygotic
mechanisms are also thought to contribute to the low survivability of
offspring beyond the first growing season (Norrmann et al. 1997).
Reductions in the size and increased spatial isolation of Carolina Big Bluestem
populations in the post-settlement period may have contributed to decreased genetic
variability and increased population divergence as a consequence of genetic drift
and reduced gene flow. Studies of genetic diversity and partitioning of genetic
variation have shown that restricted species are more likely to have reduced genetic
diversity compared to more widespread species (Fischer et al. 2003, Hamrick
and Godt 1989, Karron 1987, Young et al. 1996). Reduced genetic variation may
also indicate reduced fecundity within populations (Kery et al. 2000). In addition
to population size, variation in ploidal levels may account for genetic differentiation
among populations (Soltis and Soltis 2000). Hexaploid (6x) and enneaploid
(9x) cytotypes are reported for populations of Big Bluestem from midwestern studies
(Keeler 1992, 2004; Norrmann et al. 1997), however, ploidy levels for eastern
populations of Big Bluestem are unknown.
We undertook an allozyme analysis to address several questions related to
the levels and partitioning of genetic diversity of Big Bluestem populations in the
Carolinas: 1) What are the levels of genetic diversity within and among Carolina
populations? 2) Is genetic distance among populations a function of the spatial
distance separating them? 3) Is there a relationship between Big Bluestem population
size and genetic diversity within populations? 4) Is there genetic evidence
that the range of this species in the Carolinas was once larger? Findings from this
study should have implications for conservation strategies and may be applicable
to other rare species that occur in small populations.
Materials and Methods
Study species
Andropogon gerardii Vitman (Big Bluestem; Poaceae ) is a tall, native, warmseason
(C4) perennial grass. In the midwestern US, it produces dense clonal
growth with an extensive network of underground rhizomes and roots (Weaver
2012 R.D. Tompkins, D.W. Trapnell, J.L. Hamrick, and W.C. Stringer 457
1963). Its range includes all states east of the Rocky Mountains and it is a major
component of the North American tallgrass prairie (Weaver and Fitzpatrick
1934). At present, Big Bluestem populations are scattered in the Piedmont,
coastal plain, and mountain regions of North Carolina, as well as in upstate South
Carolina (Chappell 2003, Radford et al. 1968, Tompkins et al. 2010a).
Study sites and sampling
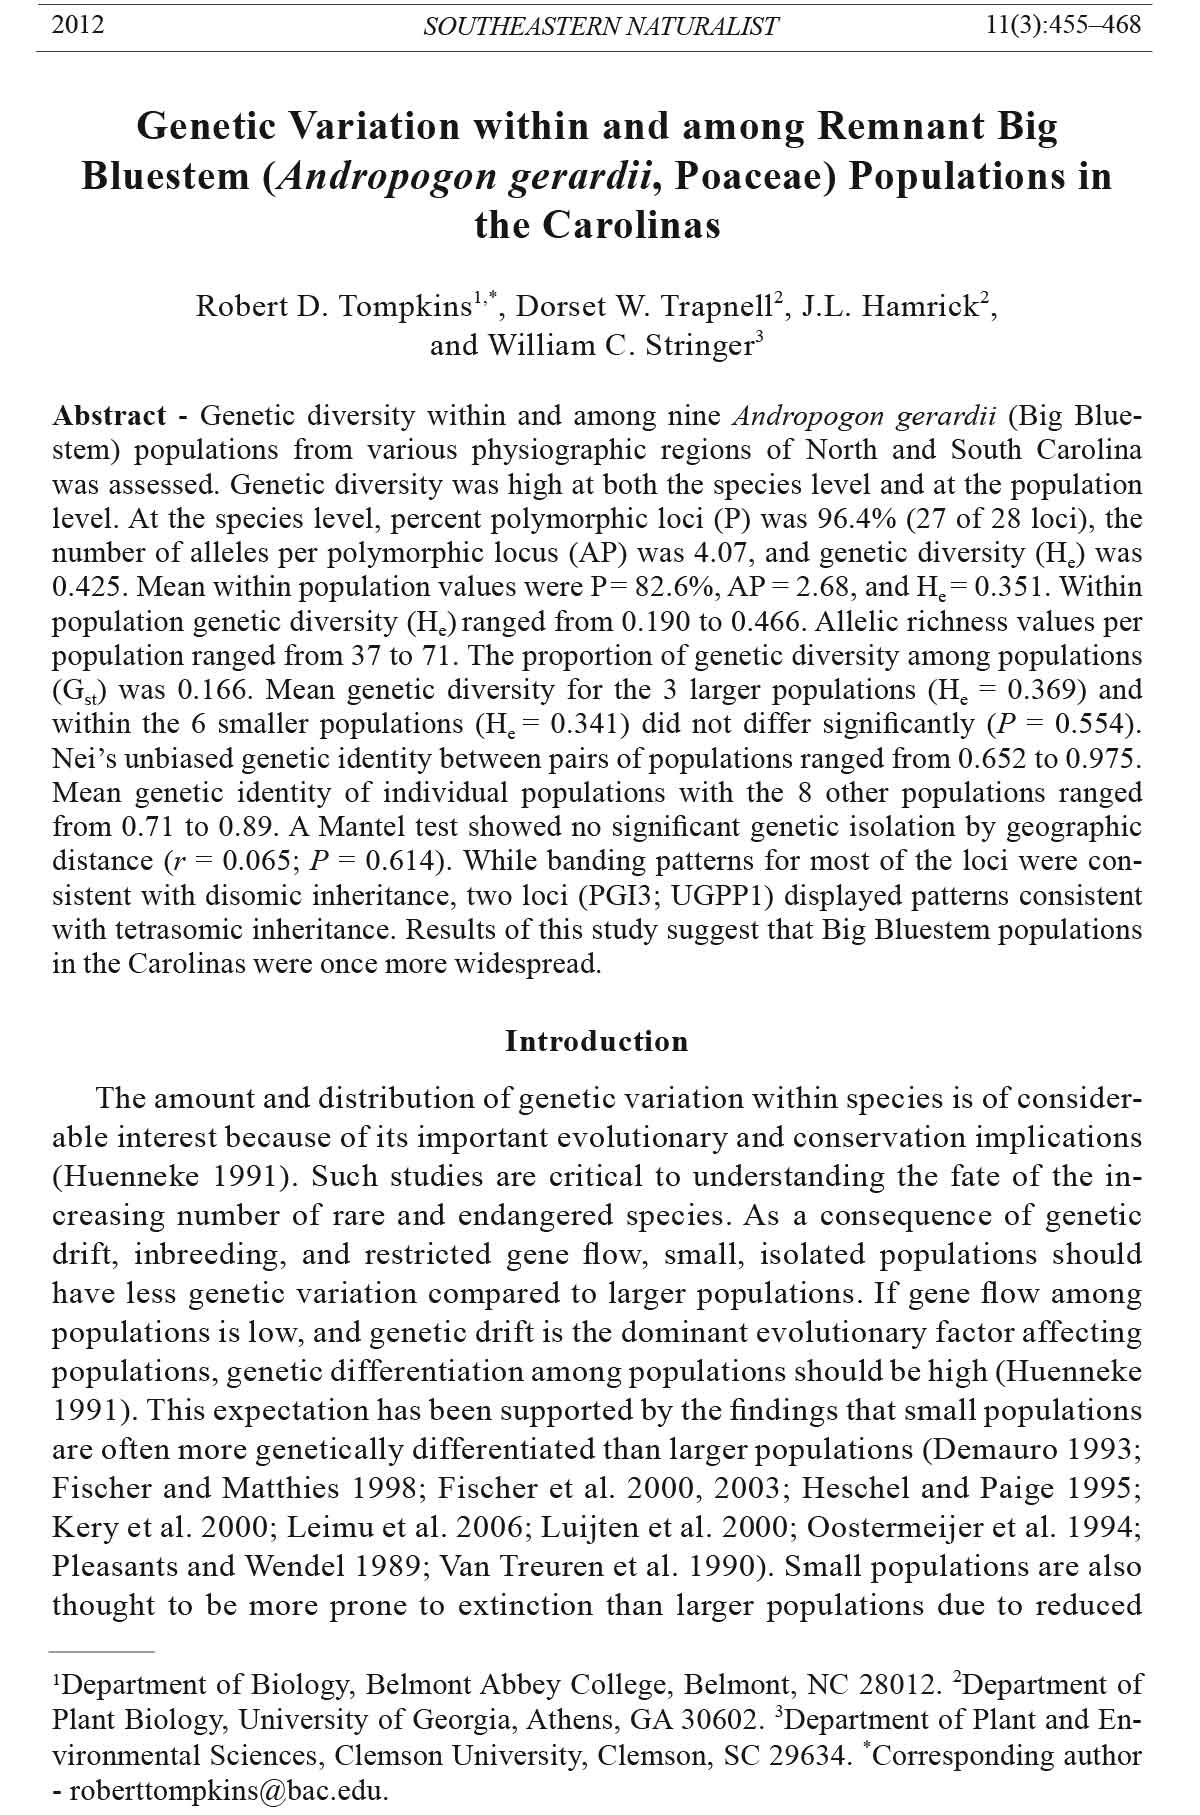
Nine Big Bluestem populations were selected from various physiographic
regions of North and South Carolina (Fig. 1). Three of the largest known populations
in the Carolinas were selected: Suther Prairie (Cabarrus County, NC), Troy
Figure 1. Sampled Big Bluestem populations for North and South Carolina along with
UPGMA phenogram displaying levels of genetic identity between populations. The coeffi
cient of similarity is indicated at the bottom of the phenogram. BB = Bowman Barrier
Road, BC = Buck Creek Serpentine Barren, BJ = BlackJacks Heritage Preserve, C =
Central Site, OS = Orton Site, SP = Suther Prairie, SNfiand II = Sumter National Forest
Sites I and II, and TP = Troy Prairie.
458 Southeastern Naturalist Vol. 11, No. 3
Prairie (Troy, NC), and Buck Creek Serpentine Barren (Clay County, NC) (Fig.1,
Table 1). Six smaller populations were also selected: Rock Hill Blackjacks Heritage
Preserve (York County, SC), Orton Site (Brunswick County, NC), Bowman
Barrier Road (Cabarrus County, NC), Sumter National Forest Sites I and II
(Oconee County, SC), and Central (Pickens County, SC) (Fig.1, Table 1).
Leaf tissue was collected from 24–48 individuals from each population in July
2010 (n = 288; Table 2). Even sampling of individuals was achieved by starting
Table 1. Site descriptions from sampled populations of Big Bluestem. BB = Bowman Barrier Road,
BC = Buck Creek Serpentine Barren, BJ = BlackJacks Heritage Preserve, C = Central Site, OS =
Orton Site, SP = Suther Prairie, SNfiand II = Sumter National Forest Sites I and II, and TP = Troy
Prairie.
Pop. size
Site stem counts Coordinates Parent material Soil features
BB <1000 35.38°N, 80.42°W Alluvium Floodplain; hydric to mesic; pH
5.5
BC >5000 35.08°N, 83.61°W Felsic to mafic Serpentine conditions; high Mg:Ca
ratio; presence of heavy metals;
pH 6.8
BJ <1000 34.90°N, 81.01°W Ferromagnesium Vertic soil; very high levels of Ca
and Mg; pH 6.3
C <1000 34.42°N, 82.47°W Felsic, igneous, Very deep; well drained; strongly
metamorphic acidic
OS <1000 34.07°N, 77.95°W Alluvium Roadside; highly disturbed; pH 6.6
SP >5000 35.45°N, 80.46°W Alluvium Floodplain; hydric to mesic; very
high levels of Ca and Mg; pH 6.1
SNfi<1000 34.76°N, 83.27°W Felsic to igneous Upland; moderate nutrient levels;
pH 5.1
SNFII <1000 34.75°N, 83.27°W Felsic to igneous Upland; moderate nutrient levels;
pH 5.1
TP >5000 35.35°N, 79.87°W Ferromagnesium Upland; moderate nutrients; pH 4.8
Table 2. Genetic variation for the sampled Big Bluestem populations. n = number of samples, P
= the mean percent polymorphic loci, AP = the number of alleles per polymorphic locus, #A =
the total number of alleles per population, AR = the allelic richness, Ae = the effective number of
alleles per locus, Ho = the observed genetic diversity, and He = the expected genetic diversity. SD =
standard deviation. Allelic richness is based on a rarefaction analysis where n = 12 individuals.
Pop. n P (%) AP #A AR Ae Ho (SD) He (SD)
BB 24 96.4 3.04 74 71.3 2.04 0.375 (0.090) 0.466 (0.030)
BC 48 96.4 2.81 64 56.1 1.79 0.420 (0.063) 0.396 (0.034)
BJ 24 87.5 3.57 76 69.9 2.07 0.340 (0.081) 0.454 (0.046)
C 24 89.3 2.60 56 52.4 1.75 0.404 (0.083) 0.374 (0.038)
OS 24 64.3 2.28 42 41.5 1.61 0.353 (0.080) 0.294 (0.044)
SNfi24 53.7 2.20 38 36.6 1.36 0.299 (0.039) 0.190 (0.044)
SNFII 24 66.7 2.11 41 40.2 1.52 0.366 (0.058) 0.272 (0.043)
SP 48 92.9 2.85 63 54.8 1.67 0.363 (0.060) 0.360 (0.034)
TP 48 96.4 2.67 64 54.6 1.65 0.393 (0.058) 0.352 (0.034)
Mean 32 82.6 2.68 57.6 53.0 1.72 0.368 0.351
Species level 96.4 4.07 111 1.87 0.425
2012 R.D. Tompkins, D.W. Trapnell, J.L. Hamrick, and W.C. Stringer 459
at one end of each population and moving laterally across the short axis of the
population until the entire population was sampled. Samples were kept chilled
during transport to the University of Georgia.
Enzyme extraction and electrophoresis
Within 48 hours of collection, samples (≈40 mg of leaf tissue) were crushed
in chilled mortars with a pestle, a pinch of sea sand, and an enzyme extraction
buffer (Wendel and Parks 1982). Extracts were absorbed on 4- x 6-mm
wicks of Whatman 3-mm chromatography paper and were stored in microtest
plates at -70 ºC until used for electrophoresis. Wicks were placed in horizontal
10% starch (Starch Art® hydrolyzed potato starch) gels and electrophoresis
performed. Fifteen enzyme stains in four buffer systems resolved 28 putative
allozyme loci. Enzymes stained and loci identified (in parentheses) for
each buffer system were as follows: 1) buffer system 4, aconitase (ACO1,
ACO2), 6-phosphogluconate dehydrogenase (6-PGD1, 6-PGD2), and shikimic
dehydrogenase (SKDH1, SKDH2); 2) buffer system 8-, aspartate aminotransferase
(AAT1, AAT2), fluorescent esterase (FE1, FE2, FE4), triosephosphate
isomerase (TPI1, TPI2); 3) buffer system 11, isocitrate dehydrogenase (IDH1),
malate dehydrogenase (MDH1, MDH2), UTP-glucose-1-phosphate (UGPP1,
UGPP2); 4) buffer system 6, alcohol dehydrogenase (ADH2), diaphorase
(DIA1, DIA2), menadione reductase (MNR5), peroxidase (PER2), phosphoglucoisomerase
(PGI1, PGI2, PGI3), and phosphoglucomutase (PGM1, PGM2).
All buffer and stain recipes were adapted from Soltis et al. (1983) except AAT,
DIA, and MNR (Cheliak and Pitel 1984), and UGPP (Manchenko 1994). Buffer
system 8- is a modification of buffer system 8 of Soltis et al. (1983). Banding
patterns were consistent with Mendelian inheritance patterns expected for each
enzyme system (Weeden and Wendel 1989).
Data analysis
Genetic diversity measures were estimated using a computer program,
LYNSPROG, designed by M.D. Loveless and A.F. Schnabel. Measures of genetic
diversity were: percent polymorphic loci (P) mean number of alleles per
polymorphic locus (AP), effective number of alleles per locus (Ae = 1/Σpi
2), and
genetic diversity (He = 1- Σpi
2, or the proportion of loci heterozygous per individual
under Hardy-Weinberg expectations; Nei 1972). Species level values for
these parameters were calculated by pooling data from all populations. Population
level values were calculated for each population and then averaged across all
populations. Observed heterozygosity (Ho) was compared with Hardy-Weinberg
expected heterozygosity (He) for each polymorphic locus in each population
by calculating Wright’s fixation indices (i.e., Fis, inbreeding coefficient; Wright
1922, 1951).
Nei’s (1972) genetic distance statistics were calculated for each locus (monomorphic
and polymorphic). Genetic identity values were calculated for all
possible pairs of populations. An unweighted pair group method with arithmetic
mean (UPGMA) phenogram of genetic identities was generated using NTSys-PC
ver. 2.11j (Rohlf 2003).
460 Southeastern Naturalist Vol. 11, No. 3
Pairwise Gst values were obtained for all possible pairs of populations using
only polymorphic loci with FSTAT (Goudet 2001). A Mantel test of correspondence
between these pairwise Gst values and geographic distances for each pair
of populations was performed (Smouse et al. 1986) using NTSys-PC ver. 2.11j
(Rohlf 2003).
Because the number of alleles observed for a population is dependent on
sample size (i.e., smaller samples should have fewer alleles), allelic richness
was assessed using FSTAT (Goudet 2001). Allelic richness is an estimate of the
number of alleles independent of sample size. FSTAT employs Hurlbert’s (1971)
rarefaction index modified for population genetics (El Mousadik and Petit 1996,
Petit et al. 1998). For the rarefaction analysis, only polymorphic loci were used,
and Big Bluestem populations were treated as consisting of 24 alleles; only 12
individuals could be genotyped for population (OS). Five loci (FE1, FE2, FE4,
PER2, and TPI2) were removed because data were missing for some populations.
A t-test was performed to determine if there were significant differences in P, AP,
Ae and He between large (n = 3) and small populations (n = 6) using SAS v. 9.1
(SAS Institute 2002), with a significance level of P < 0.05.
Results
Twenty-eight allozyme loci were resolved for the 9 populations, 27 of which
were polymorphic (Table 3). Although Big Bluestem is a polyploid species,
banding patterns were consistent with disomic inheritance with the exception of
PGI3 and UGPP1, for which banding patterns indicated tetrasomic inheritance.
Disomic inheritance is expected for allopolyploid species since each of the parental
chromosomes pair at meiosis (Weeden and Wendel 1989). However, we
did not observe the allozyme patterns expected of allopolyploids (e.g., fixed
heterozygosity or interlocus heterodimers for dimeric loci), suggesting that
gene silencing has occurred at a large scale for these Big Bluestem. Except for
the two loci mentioned above, we also did not see patterns of allozyme expression
that characterize tetrasomic inheritance by autopolyploids (e.g., >2 alleles
segregating per locus, excessive levels of heterozygosity, or evidence for genedosage
effects). For PGI3 and UGPP1, we observed >2 alleles per individual,
excessive apparent heterozygosity, and evidence for gene-dosage effects. High
quality allozyme gels, such as were available for Big Bluestem, permit accurate
inferences of allele dosage of partial heterozygotes (aaab, aabb, abbb) since allele
copy number is consistently reflected in band intensity (Tanksley and Orton
1983, Trapnell et al. 2011,Weeden and Wendel 1989). Genetic diversity was high
at both the pooled species-wide level and at the mean population level. At the
species level, the percentage of polymorphic loci (P) was 96.4%, the number of
alleles per polymorphic locus (AP) was 4.07, the effective number of alleles (Ae)
was 1.87, and genetic diversity (He) was 0.425 (Table 2).
Within populations, the means and ranges of the genetic diversity parameters
were P = 82.6% (53.7%–96.4%), AP = 2.68 (2.1–3.57), Ae = 1.72 (1.36–2.07), and
He = 0.351 (0.190–0.466) (Table 2). Overall, BJ and BB had the highest levels of
genetic diversity, and SNfiand SNFII had the least. Population BJ had 11 private
2012 R.D. Tompkins, D.W. Trapnell, J.L. Hamrick, and W.C. Stringer 461
alleles (i.e., alleles that occur in a single population), while both SP and TP each
had three. In comparing the observed number of alleles per population with the
rarefaction number, the highest number of alleles occurred in BJ (76) and BB
(74), both small populations, and the fewest occurred in SNfi(38) and SNFII
(41), also small populations (Table 2). After rarefaction, the number of alleles/
population ranged from 37–71, with SNfiand SNFII having the fewest alleles
and BB and BJ having the most. The 3 large populations ranked 3rd, 4th, and 5th
for both #A and AR (Table 2).
For the 3 large populations (BC, SP, TP), P = 95.2%, AP = 2.78, Ae = 1.70,
He = 0.369. For the 6 small populations (BB, BJ, C, OS, SNfiand II), P = 76.3%,
AP = 2.63, Ae = 1.72, and He= 0.341. There were no significant differences in P,
AP, Ae and He values between large and small populations (Table 4).
All sampled populations contained high levels of genotypic diversity and indicated
that the populations have undergone little clonal spreading. Only SNFI,
Table 3. Statistics of genetic diversity for loci from the sampled Big Bluestem populations. A
= number of alleles at each locus, Ht = total genetic diversity in all populations, Hs = withinpopulation
genetic diversity, Gst = total among-population genetic diversity, Fis = deviation from
Hardy-Weinberg.
Locus A Ht Hs Gst Fis
ADH2 4 0.244 0.218 0.107 0.065
PGI1 2 0.495 0.453 0.086 -0.177
PGI2 3 0.404 0.330 0.181 -0.194
PGI3 5 0.512 0.407 0.206 -0.431
MNR5 4 0.248 0.214 0.137 -0.120
6P1 4 0.488 0.442 0.094 -0.064
6P2 3 0.292 0.258 0.115 -0.012
ACO1 3 0.543 0.467 0.140 -0.193
ACO2 5 0.480 0.329 0.314 -0.016
SKDH1 1 0.000 0.000 0.000 0.000
SKDH2 7 0.717 0.627 0.125 0.134
DIA1 4 0.555 0.446 0.197 -0.345
DIA2 4 0.558 0.333 0.402 0.098
PER2 3 0.367 0.341 0.071 -0.324
PGM1 4 0.162 0.098 0.398 -0.141
PGM2 5 0.474 0.405 0.146 0.476
AAT1 4 0.317 0.230 0.274 0.226
AAT2 5 0.403 0.331 0.179 0.067
FE1 4 0.519 0.411 0.208 -0.165
FE2 4 0.477 0.421 0.118 -0.088
FE4 4 0.597 0.425 0.288 -0.010
TPI1 5 0.625 0.566 0.095 -0.413
TPI2 5 0.517 0.505 0.024 -0.721
IDH1 5 0.311 0.287 0.078 -0.229
MDH1 3 0.406 0.354 0.129 -0.429
MDH2 2 0.165 0.151 0.087 0.181
UGPP1 5 0.439 0.420 0.043 0.091
UGPP2 4 0.575 0.438 0.238 0.038
Mean 3.96 0.440 0.367 0.166 -0.070
462 Southeastern Naturalist Vol. 11, No. 3
SNFII, and TP showed any evidence of clonality. Population SNfi(n = 24) had
14 genotypes, 2 that were shared by 2 ramets and 1 that was shared by 9 ramets.
SNFII (n = 24) had 22 genotypes, 1 of which was shared by 2 ramets.
Genetic differentiation among populations (Gst) was 0.166, indicating that
83% of the genetic variation is found within populations (Table 3). The Mantel
test showed no significant isolation by geographical distance (r = 0.065, P =
0.614). Of the 172 χ2 tests for departure from Hardy-Weinberg expectations, 63
(37%) were significant. Based on chance alone, one would expect 9 (5%) to be
significantly different from Hardy-Weinberg expectations. The mean Fis value
(-0.070) indicated a slight overall excess of heterozygosity across loci for the
populations (Table 3).
Nei’s unbiased genetic identity between pairs of populations ranged from
0.652 (BJ and SNFI) to 0.975 (BC and SP; Table 5). Population BJ had the lowest
mean genetic identity with other populations (0.71), while SP had the highest
(0.89) (Table 5). With the exception of some clustering of populations (e.g., BB,
SP, and TP), the UPGMA phenogram did not indicate a strong relationship between
geographic location and genetic identity (Fig. 1).
Discussion
Although fragmented populations of rare plant species often have low levels
of genetic diversity, our analysis indicated high levels of genetic variation within
the Big Bluestem populations. Overall genetic diversity for these nine populations
was higher than that reported for most plant species. Godt and Hamrick
(1998) reported an overall mean genetic diversity (He) of 0.146 for plant species,
and He = 0.191 for 161 grass species. The higher levels of genetic diversity
found within these populations are consistent with the vegetative growth pattern
Table 5. Nei’s genetic identity values for sampled Big Bluestem populations.
BB BC BJ C OS SNfiSNFII SP TP Mean
BB 0.000 0.944 0.754 0.900 0.834 0.828 0.876 0.928 0.906 0.87
BC 0.000 0.728 0.925 0.897 0.866 0.904 0.975 0.924 0.89
BJ 0.000 0.703 0.780 0.652 0.672 0.714 0.724 0.71
C 0.000 0.891 0.883 0.906 0.915 0.885 0.87
OS 0.000 0.820 0.856 0.908 0.880 0.85
SNfi0.000 0.889 0.887 0.867 0.83
SNFII 0.000 0.921 0.900 0.89
SP 0.000 0.947 0.89
TP 0.000 0.87
Table 4. Percent polymorphic loci (P), mean levels of genetic diversity (He), total number of effective
alleles per locus (Ae), and the number of alleles per polymorphic locus (AP) for small vs.
large populations of Big Bluestem.
n P (%) He Ae AP
Small populations 6 76.3 0.341 1.72 2.63
Large populations 3 95.2 0.369 1.70 2.78
2012 R.D. Tompkins, D.W. Trapnell, J.L. Hamrick, and W.C. Stringer 463
and long generational time found in other perennials (Godt and Hamrick 1998,
Luijten et al. 2000). Even the smaller populations had high levels of genetic
diversity and did not differ significantly from the large populations. It has been
postulated that long-lived species are less likely to lose genetic variation within
populations because individuals have more time to pass on alleles (Pleasants
and Wendel 1989). Keeler (2004) estimated the generation time for an eastern
Colorado population of Big Bluestem as 50–100 years. It is possible that some
genotypes within these Carolina populations represent early founding genotypes.
Thus, the maintenance of genetic variation, despite severe fragmentation and
generally small population sizes, is probably attributable to the clonal life history
of Big Bluestem and its outcrossing breeding system.
Polyploidy could also be a source of the high levels of genetic diversity
observed in the Big Bluestem populations. Although the ploidy levels of these
eastern populations are not known, we observed two allozyme loci (PGI3 and
UGPP1) that had banding patterns consistent with autopolyploids. It has been
a common observation that polyploid species tend to maintain higher levels of
allozyme variation (He and #A) than closely related diploid taxa (Hamrick et al.
1979, Soltis and Soltis 1993). It is interesting to note, however, that only two of
the 27 polymorphic loci of Big Bluestem displayed polyploid inheritance patterns,
indicating that there may have been extensive gene silencing (Soltis and
Soltis 1993) subsequent to the polyploidization event. Gene silencing results
from the fixation of null alleles at one of the duplicated loci (Li 1980), which
causes disomic expression at that locus.
The high levels of genotypic diversity found in these Carolina populations
is consistent with the findings of Keeler et al. (2002) in their study of genetic
structure within populations at Konza Prairie, KS. They found 31.8 genotypes per
100-m2 area and reported a mean clone size of 3.2 m2. Our results also suggest
that populations were not comprised of large widespread clones as was expected,
but most likely consist of numerous small clonal units. Clonal units less than 1 m2 were
detected for two of the sampled populations. The lack of evidence of clonality
within 6 of the populations was most likely attributable to the even sampling of
populations and the spatial distances between sampled plants.
Chappell (2003) found much lower levels of genetic diversity in SNfiand
another small population that we did not sample. However, Chappell’s study
included a much smaller sample size per population (n = 7), and used random amplifi
ed polymorphic DNA (RAPD) analysis to assess diversity within and among
the 2 populations.
The moderate level of genetic diversity found among the 9 populations in this
study was also consistent with Big Bluestem populations elsewhere (Gustafson et
al. 1999, Keeler 1992, Selbo and Snow 2005). Both Gustafson et al. (1999) and
Selbo and Snow (2005) reported slightly lower proportions of among-population
genetic variation in Arkansas (16%) and Ohio (11%), respectively, than we observed
in the Carolinas (17%). Other outcrossing perennial grasses have also
been reported to have similar Gst values (5–15%) (Godt and Hamrick 1998; Huff
1997; Huff et al. 1993, 1998).
464 Southeastern Naturalist Vol. 11, No. 3
The absence of significant isolation by distance and the moderately low Gst
value suggest that, historically, moderate levels of gene flow occurred among
these populations. Although the pre-settlement range of Big Bluestem in the
Carolinas is unknown, the relatively low genetic differentiation among populations,
despite their current disjunct condition, indicates that populations were
once more continuous. In another isozyme study, Matthews and Howard (1999)
also found that 14 populations of the prairie-relict Schweinitz’s sunflower (Helianthus
schweinitzii) from the Carolinas were genetically similar and suggested
that the geographical range of Schweinitz’s Sunflower was once larger. Their
results, along with the findings in this study, provide evidence that prairie species
were likely more widespread in the pre-settlement period in the Carolinas as has
been suggested (Barden 1997).
Of the populations sampled, SP had the highest mean similarity (0.89) with
the other populations. This may be related to the fact that SP is among the best
examples of a remnant Piedmont prairie ecosystem and has the largest known Big
Bluestem population in the Carolinas. It is also centrally located in the Piedmont
region in relation to many of the other sampled populations and is thought to
be a pre-settlement remnant (Fig. 1; Tompkins et al. 2010b). Population BJ was
the most genetically distinct population, with the lowest mean genetic similarity
(0.71) with the other eight populations while possessing some of the highest
genetic diversity values and a large number of private alleles. The reason for its
genetic dissimilarity from the other populations is unclear, particularly since it is
located in the Piedmont not far from SP.
The ability of species like Big Bluestem to reproduce primarily via vegetative
reproduction has probably allowed the Carolina populations to persist longer
than they would by sexual reproduction alone. Thus, despite what has most likely
been drastic reductions in both the number and size of Big Bluestem populations
in the post-settlement period, surviving populations have persisted as fragmented
units while maintaining relatively high levels of genetic diversity. Keeler et al.
(2002) suggested that the small-scale genetic variation within the Konza Prairie
population in Kansas indicated a high frequency of sexual reproduction. However,
despite the high genotypic diversity found in this study, small populations
of Big Bluestem in the Carolinas may have potentially lower rates of fertile seed
production due to a lack of compatible mates. Chappell (2003) reported low
within-population seed set (0–1%) from four small, isolated South Carolina populations.
In addition, in an outcrossing reciprocity study with individuals from 5
of the 9 populations sampled in this study, both seed set and germination values
were lower in small selfed and outcrossed populations (Tompkins et al. 2011).
Keeler’s (2004) eastern Colorado study also documented low recruitment (1%)
over a four-year period in study plots similar in size to the smaller populations in
this study.
Although variation in ploidal levels may also explain reduced fecundity in
Carolina populations of Big Bluestem, Norrmann and colleagues (1997) reported
that 6x and 9x Big Bluestem cytotypes are inter-fertile in midwestern populations.
However, irregular meiosis in the enneaploids led to defective gametes.
2012 R.D. Tompkins, D.W. Trapnell, J.L. Hamrick, and W.C. Stringer 465
Keeler (2004) also found that hexaploids had a higher frequency of viable seeds
than enneaploids. Flow cytometric examinations are needed to determine ploidal
levels of the Carolina populations of Big Bluestem to better understand the genetic
structure and reproductive potential within those populations.
Thus, despite relatively high levels of genetic diversity, the smaller Carolina
populations may be less likely to re-colonize by sexual reproduction in current
sites or to colonize suitable nearby habitats. As a result, some local Big
Bluestem populations may be below the necessary threshold size for natural
recovery without the introduction of additional genotypes to augment outcrossing
(Young et al. 1996). Further study is needed to better understand the
genetic structure of Big Bluestem populations in the Carolinas. In addition to
protecting known Big Bluestem sites from further fragmentation, conservation
management plans for smaller populations should include the augmentation
of genotypic diversity by the introduction of genetic material from other local
populations to enhance genetic diversity and the potential for increased viable
seed production within those populations.
Acknowledgments
The authors thank the US Forest Service for providing grant support for this study.
We also acknowledge the following individuals and agencies that provided permission to
visit sites and to collect specimens from their properties: the Suther family, Rick Harris,
George Bowman, the South Carolina Department of Natural Resources, and the US Forest
Service.
Literature Cited
Barden, L.S. 1997. Historic prairies in the Piedmont of North and South Carolina, USA.
Natural Areas Journal 17:149–152.
Chappell, J. 2003. Lack of caryopsis production in remnant Big Bluestem (Andropogon
gerardii) populations located in upstate South Carolina. M.Sc. Thesis. Clemson University,
Clemson, SC.
Cheliak, W.M., and J.A. Pitel. 1984. Techniques for starch gel electrophoresis of enzymes
from forest tree species. Petawawa National Forestry Institute, Information
Report P1-X-42. Canadian Forestry Service. Chalk River, ON, Canada. Pp. 1–49.
Davis, J.E., Jr., C. McRae, B.L. Estep, L.S. Barden, and J.F. Matthews. 2002. Vascular
flora of Piedmont prairies: Evidence from several prairie remnants. Castanea
67:1–12.
Demauro, M.M. 1993. Relationship of breeding system to rarity in the Lakeside Daisy
(Hymenoxys acaulis var. glabra). Conservation Biology 7:542–550.
El Mousadik, A., and R.J. Petit. 1996. High level of genetic differentiation for allelic
richness among populations of the Argan Tree (Argania spinosa (L.) Skeels) endemic
to Morocco. Theoretical Applied Genetics 92:832–839.
Fischer, M., and D. Matthies. 1998. Effects of population size on performance in the rare
plant Gentianella germanica. Journal of Ecology 86:195–204.
Fischer, M., R. Husi, D. Prati, M. Peintinger, M. van Kleunen, and B. Schmid. 2000. RAPD
variation among and within small and large populations of the rare clonal plant Ranunculus
reptans (Ranunculaceae). American Journal of Botany 87:1128–1137.
466 Southeastern Naturalist Vol. 11, No. 3
Fischer, M., M. Hock, and M. Paschke. 2003. Low genetic variation reduces crosscompatibility
and offspring fitness in populations of a narrow endemic plant with a
self-incompatibility system. Conservation Genetics 4:325–336.
Gilpin, M.E., and M.E. Soule. 1986. Minimum viable populations: Processes of species
extinction. Pp. 19–34, In M.E. Soule (Ed.). Conservation Biology: The Science of
Scarcity and Diversity. Sinauer Associates, Sunderland, UK.
Godt, M.J.W., and J.L. Hamrick. 1998. Allozyme diversity in grasses. Pp. 11–29, In G.P.
Cheplick (Ed.). Population Biology of Grasses. Cambridge University Press, Cambridge,
UK.
Goudet, J. 2001. FSTAT, a program to estimate and test gene diversities and fixation
indices (version 2.9.3). Available online at http://www.unil.ch/izea/softwares/fstat.
html. Accessed January 2012.
Gustafson, D.J., D.J. Gibson, and D.L. Nickrent. 1999. Random amplified polymorphic
DNA variation among remnant Big Bluestem (Andropogon gerardii Vitman) populations
from Arkansas’ Grand Prairie. Molecular Ecology 8:1693–1701.
Hamrick, J.L., and M. J.W. Godt. 1989. Allozyme diversity in plant species. Pp. 43–63,
In A.H.D. Brown, M.T. Clegg, A.L. Kahler, and B.S. Weir (Eds.). Plant Population
Genetics, Breeding, and Germplasm Resources. Sinauer, Sunderland, MA.
Hamrick, J.L., Y.B. Linhart, and J.B. Mitton. 1979. Relationships between life-history
characteristics and electrophoretically detectable genetic variation in plants. Annual
Review of Ecology and Systematics 10:173–200.
Heschel, M.S., and K.N. Paige. 1995. Inbreeding depression, environmental stress, and
population size variation in Scarlet Gilia (Ipomopsis aggregata). Conservation Biology
9:126–133.
Huenneke, L.F. 1991. Ecological implications of genetic variation in plant populations.
Pp. 31– 44, In D.A. Falk and K.E. Holsinger (Eds.). Genetics and Conservation of
Rare Plants. Oxford University Press, Oxford, UK.
Huff, D.R. 1997. RAPD characterization of heterogeneous perennial ryegrass cultivars.
Crop Science 37:557–564.
Huff, D.R., R. Peakall, and P.E. Smouse. 1993. RAPD variation within and among natural
populations of outcrossing Buffalograss (Buchloe dactyloides (Nutt.) Engelm.).
Theoretical and Applied Genetics 86:927–934.
Huff, D.R., J.A. Quinn, B. Higgins, and A.J. Palazzo. 1998. Random amplified polymorphic
DNA (RAPD) variation among native Little Bluestem (Schizachyrium scoparium
(Michx.) Nash) populations from sites of high and low fertility in forest and grassland
biomes. Molecular Ecology 7:1591–1597.
Hulbert, S.H. 1971. The nonconcept of species diversity: A critique and alternative parameters.
Ecology 52:577–586.
Karron, J.D. 1987. A comparison of levels of genetic polymorphism and self-compatibility
in geographically restricted and widespread plant congeners. Evolutionary Ecology
1:47–58.
Keeler, K.H. 1992. Local polyploidy variation in the native prairie grass Andropogon
gerardii. American Journal of Botany 79:1229–1232.
Keeler, K.H. 2004. Impact of intraspecific polyploidy in Andropogon gerardii (Poaceae)
populations. American Midland Naturalist 152:63–74.
Keeler, K.H., C.F. Williams, and L.S. Vescio. 2002. Clone size of Andropogon gerardii
Vitman (Big Bluestem) at Konza Prairie, Kansas. American Midland Naturalist
147:295–304.
Kery, M., D. Matthies, and H. Spillmann. 2000. Reduced fecundity and offspring performance
in small populations of the declining grassland plants Primula veris and
Gentiana lutea. Journal of Ecology 88:17–30.
2012 R.D. Tompkins, D.W. Trapnell, J.L. Hamrick, and W.C. Stringer 467
Leimu, R., P. Mutikainen, J. Koricheva, and M. Fischer. 2006. How general are positive
relationships between plant population size, fitness, and genetic variation? Journal of
Ecology 94:942– 952.
Li, W.H. 1980. Rate of gene silencing at duplicate loci: A theoretical study and interpretation
of data from tetraploid fishes. Genetics 95:237–258.
Luijten, S.H., A. Dierick, L. Gerard, B. Oostermeijer, L.E.L. Raijmann, and H.C.M. Dens
Nijs. 2000. Population size, genetic variation, and reproductive success in a rapidly
declining, self-incompatible perennial (Arnica montana) in the Netherlands. Conservation
Biology14:1776–1787.
Manchenko, G.P. 1994. Handbook of Detection of Enzymes on Electrophoretic Gels.
CRC Press, Ann Arbor, MI.
Matthews, C.R., and J.H. Howard. 1999. Genetic variation in the federally endangered
Schweinitz’s Sunflower, Helianthus schweinitzii T. & G. (Asteraceae). Castanea
64:231–242.
McKone, M.J., C.P. Lund, and J.M. O’Brien. 1998. Reproductive biology of two
dominant prairie grasses (Andropogon gerardii and Sorghastrum nutans, Poaceae):
Male-biased sex allocation in wind-pollinated plants? American Journal of Botany
85:776–783.
Nei, M. 1972. Genetic distance between populations. American Naturalist 106:283–292.
Norrmann, G.A., C.L. Quarin, and K.H. Keeler. 1997. Evolutionary implications of meiotic
chromosome behavior, reproductive biology, and hybridization in 6x and 9x cytotypes
of Andropogon gerardii (Poaceae). American Journal of Botany 84:201–207.
Oostermeijer, J.G. B., M.W. van Eijck, and J.C.M. den Nijs. 1994. Offspring fitness in
relation to population size and genetic variation in the rare perennial plant species
Gentiana pneumonanthe (Gentianaceae). Oecologia 97:289–296.
Petit, R.J., A. El Mousadik, and O. Pons. 1998. Identifying populations for conservation
on the basis of genetic markers. Conservation Biology 12:844–855.
Pleasants, J.M., and J.F. Wendel. 1989. Genetic diversity in a clonal narrow endemic,
Erythronium propullans, and in its widespread progenitor, Erythronium albidum.
American Journal of Botany 76:1136–1151.
Radford, A.E., H.E. Ahles, and C.R. Bell. 1968. Manual of the Vascular Flora of the
Carolinas. University of North Carolina Press, Chapel Hill, NC.
Rohlf, F.J. 2003. Numerical taxonomy and multivariate analysis system version 2.11j.
Exeter Software, Setauket, NY.
SAS Institute. 2002. SAS User’s Guide: Statistics. Version 9.1. SAS Institute, Cary, NC.
Selbo, S.M., and A.A. Snow. 2005. Flowering phenology and genetic similarity among
local and recently introduced populations of Andropogon gerardii in Ohio. Restoration
Ecology 13:441–447.
Smouse, P.E, J.C. Long, and R.R. Sokal. 1986. Multiple regression and correlation extensions
of the Mantel test of matrix correspondence. Systematic Zoology 35:627–632.
Soltis, D.E., and P.S. Soltis. 1993. Molecular data and the dynamic nature of polyplody.
Critical Reviews in Plant Sciences 12:243–273.
Soltis, P.S., and D.E. Soltis. 2000. The role of genetic and genomic attributes in the
success of polyploids. Proceedings of the National Academy of Sciences of the USA
97:7051–7057.
Soltis, D.E., C.H. Haufler, D.C. Darrow, and G.J. Gastony. 1983. Starch gel electrophoresis
of ferns: A compilation of grinding buffers, gel and electrode buffers, and staining
schedules. American Fern Journal 73:9–27.
Tanksley, S.D., and T.J. Orten (Eds.). 1983. Isozymes in Plant Genetics and Breeding.
Elsevier, Amsterdam, The Netherlands. Part 1, p. 516 and Part 2, p. 472.
468 Southeastern Naturalist Vol. 11, No. 3
Tompkins, R.D., W.C. Stringer, K.H. Richardson, E.A. Mikhailova and W.C. Bridges, Jr.
2010a. Big Bluestem (Andropogon gerardii; Poaceae) communities in the Carolinas:
Composition and ecological factors. Rhodora 112:378–395.
Tompkins, R.D., C.M. Luckenbaugh, W.C. Stringer, K.H. Richardson, E.A. Mikhailova
and W.C. Bridges, Jr. 2010b. Suther Prairie: Vascular flora, species richness, and
edaphic factors. Castanea 75:232–244.
Tompkins, R.D., W.C. Stringer, and W.C. Bridges, Jr. 2011. An outcrossing reciprocity
study between remnant Big Bluestem (Andropogon gerardii) populations in the Carolinas.
Ecological Restoration 29:339–345.
Trapnell, D.W., J.L. Hamrick, K.C. Parker, K.W. Braungart, and T.C. Glenn. 2011. Evaluating
the utility of microsatellites for investigations of autopolyploid taxa. Journal of
Heredity 102:473–478.
Van Treuren, R., R. Bijlsma, W. Van Delden, and N.J. Ouborg. 1990. The significance of
genetic erosion in the process of extinction. I. Genetic differentiation in Salvia pratensis
and Scabiosa columbaria in relation to population size. Heredity 66:181–189.
Weaver, J.E. 1963. The wonderful prairie sod. Journal of Range Management 16:165–171.
Weaver, J.E., and T.J. Fitzpatrick. 1934. The prairie. Ecological Monographs 4:109–295.
Weeden, N.F., and J.F. Wendel. 1989. Genetics of plant isozymes. Pp. 46–72, In D.E. Soltis
and P.S. Soltis (Eds.). Isozymes in Plant Biology. Dioscorides Press, Portland, OR.
Wendel, J.F., and C.R. Parks. 1982. Genetic control of isozyme variation in Camellia
japonica L. Journal of Heredity 73:197–204.
Wright, S. 1922. Coefficients of inbreeding and relationship. American Naturalist
56:330–338.
Wright, S. 1951. The genetical structure of populations. Annals of Eugenics 15:323–354.
Young, A., T. Boyle, and T. Brown. 1996. The population genetic consequences of habitat
fragmentation for plants. Trends in Ecology and Evolution 11:413–418.


 The Southeastern Naturalist is a peer-reviewed journal that covers all aspects of natural history within the southeastern United States. We welcome research articles, summary review papers, and observational notes.