Southeastern Naturalist
117
B.M. Heres, S.M. Welch, and J.L. Waldron
22001188 SOUTHEASTERN NATURALIST 1V7o(1l.) :1171,7 N–1o2. 91
The Effect of Mast Availability on Crotalus adamanteus
(Eastern Diamondback Rattlesnake) Ambush-site Selection
Berlynna M. Heres1,2,*, Shane M. Welch3, and Jayme L. Waldron3
Abstract - Seasonal shifts in vegetation-masting events may alter resource availability and
influence habitat selection. Crotalus adamanteus (Eastern Damondback Rattlesnake; hereafter,
EDB) is an imperiled, ambush predator endemic to southeastern pine savannas and
woodlands of the US. Eastern Diamondback Rattlesnakes prey on small mammals that feed
on hard and soft mast (e.g., nuts and fruits). In this study, we hypothesized that intra-seasonal
shifts in masting vegetation would cause intra-season shifts in ambush-site selection in
EDBs as the result of a bottom-up trophic effect. We quantified EDB ambush-site selection
using radio-telemetry data and vegetation analysis within a naturalized study site. When
we encountered EDBs in ambush posture, we quantified vegetation structure at the selected
location and at 2 random locations. We measured understory and overstory structure and
masting characteristics within each vegetation plot. Over the June–August study period,
we quantified vegetation structure at 35 ambush sites and 70 paired random locations. We
used conditional logistic regression to model ambush-site selection. We constructed 5 a
priori models to examine ambush-site selection, with soft-mast presence, hard-mast presence,
and canopy cover as predictors. The top models supported our hypothesis, indicating
a significant association with soft-mast–producing vegetation during times when soft mast
was present. Hard-mast presence was also an important predictor of EDB ambush sites.
The results of this study indicate that EDB foraging-site selection reflects mast availability,
which may be an indication of a bottom-up trophic effect. We should consider mast presence
and absence in efforts to manage EDB populations and their prey.
Introduction
Habitat selection is the choice by organisms to occupy one space verses another.
Selection depends on the costs and benefits between available resources and the
risk of predation (Balcombe and Closs 2016, Brown 1992, Pyke 1978). Shifts in
resource availability can lead to broad changes in habitat use over a season; for
example, Beasley et al. (2007) found that Procyon lotor (L.) (Raccoon) selected
agricultural lands during a time when corn was mature and a viable food source.
Shifts in habitat selection may take place within the broader home range used by a
species, or may lead to emigration. A detailed understanding of resources available
across a landscape can improve understanding of habitat selection of species at a
higher trophic level.
Masting species are primary producers, broadly defined as reproductively mature
plants that produce hard or soft seeds or fruits. Masting plants provide a food
1Department of Wildlife, Fisheries, and Conservation Biology, University of Maine, Orono,
ME 04469. 2Current address - West Virginia Division of Natural Resources, Romney, WV
26757. 3Department of Biological Sciences, Marshall University, Huntington, WV 25755.
*Corresponding author - berlynnah@gmail.com.
Manuscript Editor: Kristen Cecala
Southeastern Naturalist
B.M. Heres, S.M. Welch, and J.L. Waldron
2018 Vol. 17, No. 1
118
source to numerous species, and key nutrients to granivores, organisms who primarily
feed on grains (Greenberg and Levey 2009, Ostfeld et al. 1996, Wolff 1996).
Mast provides nutrients to primary consumers, which in turn provide nutrients to
organisms higher in trophic level. Resource selection by mast-consuming primary
consumers has been linked to the productivity of masting plants (Bogdziewicz et
al. 2016, Gashwiler 1979, Harder et al. 2014, Stephens and Anderson 2014). For
example, Peromyscus leucopus Rafinesque (White-footed Mouse), select Quercus
(oak) habitat when acorn crops are present (Gilles and McShea 1992). When hardmasting
plants are not productive, soft mast, such as berries, provides nutrients to
primary consumers (Ostfeld et al. 1996). Although nutrient availability is not the
only reason for habitat selection, it is likely that primary consumers select different
habitat as a result of changing mast availability (Castleberry et al. 2002, Ostfeld and
Keesing 2000).
Mast-producing plants in the southeastern Coastal Plain of the US provide food
resources to many granivorous species. Mast production is species-specific, and
availability can vary annually (Silvertown 1980). Within the southeastern Coastal
Plain, soft mast, such as Vaccinium spp. (blueberries) and Rubus spp. (blackberries)
ripen from late May to mid-July (Greenberg and Levey 2009). Hard mast,
such as Carya spp. (hickories) and Juglans spp. (walnuts), produce nuts from late
July until late autumn. Oaks produce acorns (hard mast) later in the summer beginning
in August (Greenberg and Levey 2009). In the southeastern Coastal Plain,
the seasonal diet of many granivorous mammals including, White-footed Mouse,
Sigmodon hispidus Say and Ord (Cotton Rat), and Sciurus niger L. (Fox Squirrel)
reflects resource availability. Granivores, in turn, comprise a large component of
the available prey base for birds of prey, predatory mesomammals, and snakes.
Crotalus adamanteus Palisot de Beauvois (Eastern Diamondback Rattlesnake;
hereafter, EDB) are large bodied, slow growing, ambush predators found in the
southeastern Coastal Plains of the US. Eastern Diamondback Rattlesnakes primarily
prey on small-mammal species, most of which are largely granivorous. Although
there is little information on the percent diet composition of EDBs, multiple Crotalus
species have a diet composition of over 90% small-mammal prey items, and
EDBs are likely similar (Dugan and Hayes 2012, Ernst and Ernst 2003). The species
exhibits high site-fidelity, returning to the same areas to forage or seek refuge,
(Waldron et al. 2008), and follows predictable, seasonally based habitat selection
(Waldron et al. 2006a, 2008, 2013).
Specifically, EDBs exhibit 3 behaviorally distinct seasons—foraging, reproduction,
and hibernation (Waldron et al. 2006a). The EDB foraging season extends
from spring to mid-summer, following spring emergence. During this time, EDBs
continually search for ideal ambush locations, in which to catch prey. The end of
summer and onset of fall marks the reproductive season, a time when EDBs put
more energy into mating behavior such as searching and courting behavior seen in
males, and parturition in females, either through production of eggs, or by continued
feeding, to build reserves for future reproduction (Waldron et al. 2006a, 2006b;
2013). During colder months between November and March, EDBs select habitats
Southeastern Naturalist
119
B.M. Heres, S.M. Welch, and J.L. Waldron
2018 Vol. 17, No. 1
that provide refugia, expending little energy and rarely eating. EDBs restore and
maintain body condition in the foraging season, a time when snakes select habitat
based on high prey-availability to acquire energy for reproduction in the fall and
hibernation in the winter (Waldron et al. 2006a).
Although seasonal EDB habitat selection has been examined, intra-seasonal
movement patterns in relation to ambush-site selection remain unstudied (Bonnet
et al.1999; Waldron et al. 2006b, 2013). Studies which expand on EDB life history,
e.g., habitat selection, are intrinsically valuable and are important for management
and conservation of the species. Our goals were to (1) improve knowledge
of EDB intra-seasonal habitat selection with an emphasis on foraging strategy, and
(2) examine ambush-site selection in relation to mast availability. In this study, we
quantified EDB ambush-site selection using radio telemetry and vegetation data
within a naturalized study site. We expected that masting vegetation would be an
important component of foraging-site selection, given that most EDB prey items
are granivores. We hypothesized that intra-seasonal, temporal shifts in masting
vegetation would cause intra-season shifts in ambush-site selection in EDBs, which
is indicative of a bottom-up trophic effect.
Field-Site Description
We conducted this study on a privately owned property in Colleton County, SC.
This site was part of the Ashepoo, Combahee, and South Edisto (ACE) Basin Conservation
program and was managed for Colinus virginianus (L.) (Bobwhite Quail)
with prescribed fire and timber harvests (Fill et al. 2015). It consisted of 4600 ha
of mixed pine and hardwood as well as lowland hardwood stands. This site contained
high-integrity stands of Pinus palustris Mill. (Longleaf Pine) interspersed
with Quercus laevis Walter (Turkey Oak) and Carya glabra (Mill.) Sweet (Pignut
Hickory), an open-canopy understory of Pteridium aquilinum (L.) Kuhn (Bracken
Fern), and various species of fire-tolerant grasses and forbs.
Methods
Using procedures outlined by Waldron et al. (2008), we captured 5 adult EDBs
and surgically implanted transmitters (SI-2, 11–13 g, Holohil Systems, Carp, ON,
Canada) . To minimize stress, we attached a temporary transmitter to the rattle of
1 additional EDB that was underweight, but of similar length. We radiotelemeterically
monitored EDBs (4 females, 2 males) 3 times weekly (June–August 2015)
using a Telonics TR-4 radio receiver and a Yagi antenna (Telonics, Inc., Mesa,
AZ). We visually identified the snakes and recorded their location using a GPS
device with 5-m spatial accuracy, (Trimble Juno, Sunnyvale, CA). All snakes
were mature adults, as shown by both size and previous copulation observations
(Waldron et al. 2013).
We followed a modified methodology described by Reinert, et al. (1984) to collect
vegetation density and composition data at all EDB ambush sites and paired
random sites between 1 June and 16 August, 2015. We assumed that a location was
Southeastern Naturalist
B.M. Heres, S.M. Welch, and J.L. Waldron
2018 Vol. 17, No. 1
120
a foraging or ambush site if we observed EDBs in ambush posture, i.e., posture
tightly coiled, neck in s-shaped position, head slightly upturned. We located snakes
in ambush position, recorded coordinates, and returned to collect vegetation data
after the snake moved more than 40 m from the ambush site. If the rattlesnake was
still present within 24 h of the original observation, or within 40 m of the original
point, we waited an additional 48 h before returning to collect vegetation data. We
collected vegetation data at the ambush site within 1 week of observing snakes in
ambush posture to ensure that changes in masting presence over time would not
affect our results.
We used a modified James and Shugart (1970) vegetation plot to quantify vegetation
and masting characteristics of ambush sites. We recorded canopy vegetation
and groundcover vegetation at each plot. We divided canopy into 2 groups:—conifers
and hardwoods—and categorized canopy and groundcover species by presence
or absence of mast.
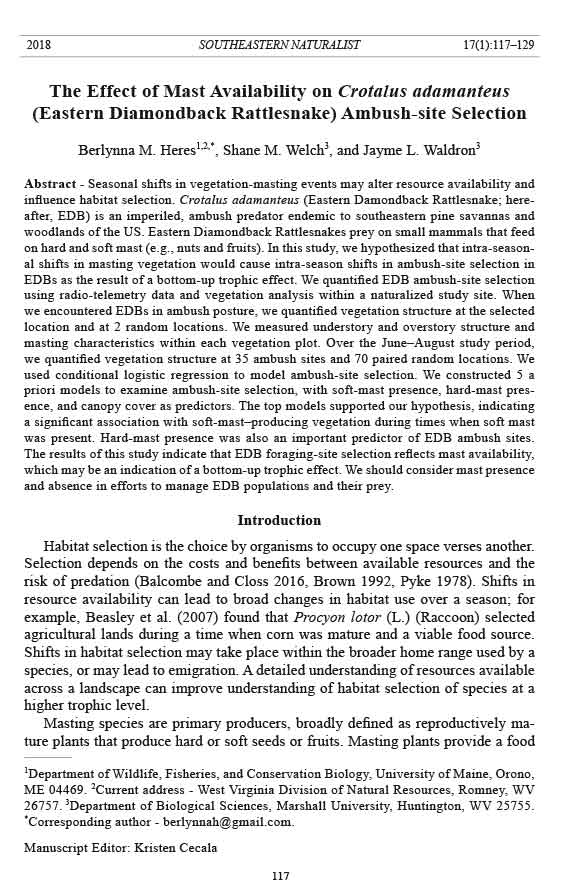
We estimated groundcover density by laying out 2 perpendicular transects, creating
a circular 11.28-m radius plot (Fig. 1). We sampled vegetation along a random
azimuth and along that azimuth’s cardinal directions, totaling 34 points. Of the 34
points, we collected 22 along the major azimuth (transect A) and 12 from the 6-m
point along the minor azimuth (transect B) going to the end of the transect. We collected
only 12 points along transect B to minimize over-sampling toward the center
of the plot.
We quantified groundcover density by the number of plants present at each point
along the 34-point transect. Groundcover masting species do not represent a pulse
of fruit production because most groundcover plants do not use the predator satiation
method of seed dispersal (Inman and Pelton 2002). Lagomorphs, Peromyscus
spp. (mice), and other rattlesnake prey consume the fruit produced by groundcover
plants. Within the 2 categories, masting and non-masting groundcover, we divided
Figure 1.Vegetation plot used at
each ambush site, 11.28-m radius,
composed of 2 transects: Transect
A, 22 m and Transect B, two 6-m
lengths.
Southeastern Naturalist
121
B.M. Heres, S.M. Welch, and J.L. Waldron
2018 Vol. 17, No. 1
examined the parameters shown in Table 1, including abbreviations. Examples of
common masting-groundcover include blueberries, blackberries, and legumes. We
defined soft-mast understory species (percent understory) as any shrub-sized plant
that exceeded breast height (1.35 m) but whose trunk did not exceed 8 cm diameter
at breast height (DBH) (James and Shugart 1970).
We measured DBH and identified all trees that exceeded 8 cm DBH within the
circumference created by the 2 transects (Fig. 1). We measured presence or absence
of mast on all trees and estimated total mast presence with a visual count. We determined
if cones were spent (opened, devoid of seeds) or productive (tightly closed),
to exclude cones from previous years in the analysis. Additionally, we measured
DBH of all snags and logs present within the circular plot if the DBH was ≥ 8 cm.
We estimated canopy cover by using an ocular tube at the center of transects as
well as at the midway point of the transects in the all 4 directions, totaling 5 points,
which we then recorded as a percentage.
We sampled 3 vegetation plots at each ambush site. One plot was located at
the ambush site (i.e., where the snake was observed in ambush posture). The second
plot was located 40 m away from the ambush site along a random azimuth.
The third plot was located 300 m from the ambush site along a different random
azimuth. The 40-m plot represented habitat that was available for foraging at the
time the snake selected the ambush site. We chose 40 m to represent habitat likely
to be encountered while foraging within the span of a day because rattlesnakes
within the study site move an average of 34 m a day (B. O’Hanlon, Marshall University,
Huntington, WV, unpubl.data; J.L. Waldron, pers. observ.). The 300-m
plot represented a random location that was less accessible for foraging-site selection
as compared to the 40-m random plot (i.e., we assumed the 300-m plot to
be outside daily range but within home-range movements). If the random plot was
located over half-way into a large body of water, (i.e., river or deep marsh), we
selected a new random azimuth.
We performed statistical analyses in SAS (SAS Institute, Cary NC). We ran
correlation analysis (PROC CORR) to examine collinearity and excluded correlated
parameters (r ≥ 0.70). To retain the power necessary for analysis, we selected
Table 1. Parameters used to examine EDB ambush-site selection in relation to masting vegetation.
Category Parameter Definition
Canopy
Percent canopy cover (PCC) Canopy-cover density at 5 points on transect
expressed as a percentage.
Hard-mast basal area (HMBA) Basal area (BA; m2 per ha) of midstory trees with
the capacity of masting e.g., Carya spp.
Understory
Soft-mast Groundcover (SMG) All woody plants along transect, e.g., Rubus,
expressed as a percentage
Percent understory (PU) All shrubs along transect, e.g., Myrica cerifera,
expressed as a percentage
Southeastern Naturalist
B.M. Heres, S.M. Welch, and J.L. Waldron
2018 Vol. 17, No. 1
122
parameters that included all vegetation with the capacity to produce mast as well
as non-masting species (Table 1), rather than limiting analyses only to vegetation
with observable mast present. We used conditional logistic regression in PROC
GLIMMIX to compare ambush versus random locations. We accounted for the lack
of independence among observations from the same snake and number of ambush
encounters of each snake by treating individual snakes as a random effect. We used
Akaike’s information criterion corrected for small sample size (AICC) for model selection,
retaining models with ΔAICC ≤ 2.00 for inference (Burnham and Anderson
2002). We calculated weighted-average parameter estimates based on AICC weights
with unconditional standard error. We used model-specific (β) beta estimates to
examine covariate effects. We assessed goodness-of-fit by performing Pearson’s
chi-squared test on the global candidate models. Comparison at 2 scales, 40 m and
300 m ,lacked the power needed to show trends, so we chose to focus on the overall
trend in use vs availability. Therefore, we combined data from the 2 random plots
and compared them to the primary ambush-plot.
We examined EDB ambush-site selection using 5 candidate models that included
predictors of hard and soft mast, specifically, hardwood trees that produce
hard mast (i.e., hard-mast basal area), and understory vegetation that are the source
of soft mast (i.e., the soft mast groundcover and percent understory parameters)
(Table 2). We analyzed the candidate models within 2 time-frames: soft-mast presence
and hard-mast presence. The soft-mast presence time-frame encompassed the
date we recorded soft mast (e.g., blackberries and blueberries) in a vegetation plot,
between 4 June 2015 and 16 July 2015 (Fig. 2). The hard-mast presence time-frame
encompassed the date that we recorded presence of hard mast (e.g., oak acorns, and
hickory nuts) between 16 July 2015 and 12 August 2015. We used this methodology
to examine intra-seasonal ambush-site selection. We lacked the necessary power
to run soft and hard mast as an interaction in candidate models. We purposefully
excluded pine mast because it was present throughout the entire study, and would
therefore have had a constant effect on ambush-site selection.
Results
Over the study period (June–August), we quantified vegetation structure at 35
ambush sites and at 70 paired random locations. Within the analysis of hard-mast
Table 2. Candidate models used to examine EDB ambush-site selection at 2 temporal scales of hardand
soft-mast availability.
Model name Model parameters
Global (Soft-mast groundcover + percent understory +hard-mast basal area +
percent canopy cover)
Soft-mast Groundcover (Soft mast groundcover)
Total Soft Mast Understory (Soft-mast groundcover + percent understory)
Hard Mast Basal Area (Hard-mast basal area)
Canopy and Hard Mast (Percent canopy cover + hard-mast basal area)
Southeastern Naturalist
123
B.M. Heres, S.M. Welch, and J.L. Waldron
2018 Vol. 17, No. 1
presence, we employed 2 models for inference (Table 3). The top model included
the soft-mast groundcover model as the sole predictor of ambush-site selection.
The soft-mast–groundcover parameter accounted for 46% of model weights, but
we failed to detect a significant association between soft-mast groundcover and
ambush-site selection (β = -1.8599 ± 2.0975, P = 0.3821; Table 4). The 2nd-ranking
model included hard-mast basal area as a predictor of EDB ambush-site selection.
The hard-mast basal area model accounted for 30% of model weights, but we failed
Figure 2. Presence and absence of hard and soft mast at the study sit, over the 2015 field
season. The Y-axis represents either presence or absence of hard or soft mast, the X-axis
represents dates surveyed, and points represent ambush sites observed.
Table 3. Logistic regression models, ranked per statistical support, examining EDB ambush-site selection
when soft or hard mast is absent or present. Models ranked using AICc model selection. k =
number of estimated parameters, AICc = Akaike information criterion for small samples, ΔAICc = the
relative difference between the best model and each other model in the set, and wi = Akaike weight.
Rank Model name Model parameters k AICc ΔAICc wi
Hard mast present
1 Soft-mast groundcover SMG 2 49.33 0.00 0.46
2 Hard-mast basal area HMBA 2 50.19 0.86 0.30
3 Total soft-mast understory SMG + PU 3 51.72 2.39 0.14
4 Canopy and hard mast HMBA + PCC 3 52.46 3.13 0.10
5 Global SMG + PU + HMBA + PCC 5 56.79 7.46 0.01
Soft mast present
1 Total soft-mast understory SMG + PU 3 75.68 0.00 0.51
2 Global SMG + PU + HMBA + PCC 5 76.40 0.72 0.35
3 Soft-mass groundcover SMG 2 78.25 2.57 0.14
4 Canopy and hard mast HMBA + PCC 3 89.88 14.20 0.00
5 Hard-mast basal area HMBA 2 92.02 16.34 0.00
Southeastern Naturalist
B.M. Heres, S.M. Welch, and J.L. Waldron
2018 Vol. 17, No. 1
124
to detect a significant association between ambush-site selection and hard-mast
basal area. The fit statistic of the global model indicated good model fit (Pearson’s
χ2/df = 0.98).
Within the soft-mast present analysis (Table 3), we employed 2 models for
inference. The top-ranking model (total soft-mast understory; Table 3) included
soft-mast groundcover and percent understory as predictors. The total soft-mast
understory model accounted for 50% of model weights. Both soft-mast groundcover
and percent understory were positively associated with ambush-site selection
when soft mast was present (soft mast groundcover: β = 8.343 ± 2.682, P = 0.0028;
percent understory: β = 6.670 ± 3.090, P = 0.0348; Table 4). The global model was
also supported and accounted for 35% of model weights. The global model indicated
that ambush sites were positively associated with soft-mast groundcover and
percent understory parameters (soft-mast groundcover: β = 8.681 ± 2.763, P =
0.0026; percent understory: β = 7.1004 ± 3.2042, P = 0.0305). We failed to detect
significant effects in the remaining global model parameters: hard-mast basal area
(β = -0.0901 ± 0.0568, P = 0.1182) and percent canopy cover (β = 1.7722 ± 1.0951,
P = 0.1109). The fit statistic of the global model indicated good model fit (Pearson’s
χ2/ df = 0.90).
Table 4. Parameter estimates and 95% confidence intervals (CI) for the top-ranking models of each
model set.
Lower Upper
Parameter Estimate SE 95% Cl 95% Cl P> [t]
Hard mast present
Soft-mast groundcover modelA
Intercept -0.2945 0.5541 -2.0580 1.4689 0.6319
SMG -1.8599 2.0975 -6.1379 2.4180 0.3821
Total soft mast understory modelB
Intercept -0.2786 0.6304 -2.2847 1.7275 0.6885
SMG -1.8774 2.1238 -6.2146 2.4599 0.3837
PU -0.1349 2.5426 -5.3277 5.0578 0.9580
Soft mast present
Total soft-mast understory modelC
Intercept -3.1262 0.7830 -5.3000 -0.9523 0.0162
SMG 8.3430 2.6816 2.9825 13.7035 0.0028
PU 6.6695 3.0899 0.4929 12.8462 0.0348
Global modelD
Intercept -3.7400 0.9202 -6.2949 -1.1850 0.0153
SMG 8.6807 2.7631 3.1536 14.2078 0.0026
PU 7.1004 3.2042 0.6909 13.5098 0.0305
HMBA -0.09009 0.0568 -0.2038 0.02361 0.1182
PCC 1.7722 1.0951 -0.4185 3.9628 0.1109
AIntercept df = 3, variable df = 31
BIntercept df = 4, variable df = 45
CIntercept df = 4, variable df = 62
DIntercept df = 4, variable df = 60
Southeastern Naturalist
125
B.M. Heres, S.M. Welch, and J.L. Waldron
2018 Vol. 17, No. 1
Discussion
The results of this study supported our hypothesis that intra-seasonal shifts
in masting vegetation influence intra-seasonal EDB ambush-site selection and
suggest a potential bottom-up trophic effect within 1 trophic layer. We detected
a strong preference for soft-mast groundcover and percent understory at ambush
sites. Both soft-mast groundcover and percent-understory parameters had a positive
association with ambush sites when soft-masting fruits were present (Table 4).
Groundcover and understory plants observed during the study included blueberries,
blackberries, Callicarpa americana L. (American Beautyberry), Morella cerifera
Small (Wax Myrtle), Rhus spp. (sumac), Vitis rotundifolia Michx. (Muscadine
Grape), Gelsemium sempervirens J. St.-Hill (Yellow Jessamine), and Asimina
spp. (pawpaw) During the study period, blueberries, blackberries, and Muscadine
Grapes produced soft mast, which was likely a source of food for EDB prey.
When hard mast was present, we expected to see a higher model weight within
the hard-mast basal area, and the canopy and hard-mast models because they contained
the hard-mast basal-area parameter. The hard-mast basal-area parameter
primarily contained tree species that produced hard mast. During the hard-mast
present time-period (mid-July to mid-August), acorns and hickory nuts were mature
and available to granivores. Hard-mast basal area was an important predictor of
ambush sites in both the hard-mast present and soft-mast absent datasets, accounting
for 30% and 33% of model weights, respectively. We detected a shift in support
from the soft-mast–themed model to the hard mast themed model; however, association
between hard mast present and ambush-site selection was not significant.
Our failure to detect significant associations within the hard-mast–present dataset
might be explained by the timing in which hard mast became available to
granivores, as well as a potential temporal lag between availability of a food source
and use. At our field site, hickories and walnuts produced nuts in mid-July and
oak species produced acorns in early August. By August, some of the telemetered
snakes exhibited reproductive behavior, e.g., courting, copulation (B.M. Heres,
pers. observ.). When oaks began masting, foraging behavior became limited due to
activities related to reproduction; thus, we were unable to make inferences about
the importance of the proximity of masting hardwoods in ambush-site selection.
Another possible explanation for our failure to detect significant associations
between hard mast and ambush-site selection could be temperature. Average temperatures
over the study period were 32 ºC ± 1 ºC, but could reach up to 38 ºC (B.M.
Heres, pers. observ.; NOAA 2015). The use of shade likely factored into ambushsite
selection due to the EDB’s thermoregulatory requirements, which often affect
rattlesnake-habitat selection (Brown et al.1982, Harvey and Weatherhead 2010,
Moore and Gillingham 2006,). Overheating and desiccation are consequences of
failing to find an appropriate ambush site, so the use of shade is important but not
the focus of our study. Thermoregulation may deprioritize the need to select ambush
sites with abundant prey.
The palatability of hard mast to granivores likely affected the hard-mast present
dataset. Although pine cones and hickory nuts are often eaten green (B.M. Heres,
Southeastern Naturalist
B.M. Heres, S.M. Welch, and J.L. Waldron
2018 Vol. 17, No. 1
126
pers. observ.; Moller 1983, Smith 1970), Quercus rubra L. (Red Oak) acorns have
a high tannin-content, and remain unpalatable to granivores (Shimada and Saitoh
2006). The high tannin content in Red Oak acorns helps the seed keep longer, and
due to their initial un-palatability, they are more often cached (Shimada and Saitoh
2006). The effect of tannins on granivore hoarding and feeding behavior is uncertain
and somewhat controversial (Shimada and Saitoh 2006, Xiao et al. 2009), but
the leading hypothesis is that high-tannin–containing acorns, such as those of Red
Oaks, are cached more often than those from Quercus alba L. (White Oak) acorns
(Xiao et al. 2009). The vast majority of oaks at the study site were species in the
Red Oak group (105 red, 4 white), which could have affected EDB ambush-site selection
if granivores were spending less time near the food source because the food
was moved to a cache rather than immediately consumed. Research at other sites
with a higher number of White Oaks may improve likelihood of EDB site selection
near hard-masting species such as oaks.
Our study examined intra-seasonal shifts in habitat selection by a predator. This
sensitivity to changes in resource availability is indicative of a bottom-up trophic
effect, starting with the primary producer (masting vegetation) and ending with the
secondary predator (EDB) (Burghardt and Schmitz 2015). Our study examined only
1 season, but larger changes can occur over multiple seasons. For example, an influx
of mast, or masting pulse, causes an increase in rodent densities, which in turn,
causes an increase in rodent-predator densities, as seen in studies with accipiters
and mice (Schmidt and Ostfeld 2003). Fifty-five mammal species and 67 bird species
have been reported to respond to masting events (Bogdziewicz et al. 2016). No
studies have linked snake densities to mast pulses, despite the importance of mast
to snake prey, although Madsen and Shine (2000) observed a link between snake
populations, rodent populations, and dry and wet seasons in Australia. Beaupre
(2008) determined that years of high and low food-intake results in an increase
in snake-body condition and prioritized reproduction. The 2015 season was not a
masting pulse for any vegetation at our field site, therefore, long-term research is
required to describe the importance of oak-masting pulses on snake ambush-site
selection. We suspect that long-term studies will reveal a bottom-up effect on populations
of small mammals at the site, and should therefore, affect the population and
body condition of rattlesnakes in the years that follow (Ostfeld and Holt 2004).
Past research examining snake foraging-site selection by chemical secretions of
prey species and conspecifics has revealed many of the priorities observed in the
ambush-site selection process of rattlesnakes (Chiszar et al.1990, Clark 2007, Roth
et al. 1999, Theodoratus and Chiszar 2000). We do not suggest that EDBs select
ambush sites in response to vegetation mast; however, our results indicate that vegetation
composition is important for ambush-site selection, in part, because mast
presence influences prey behavior and habitat selection (Bogdziewicz et al. 2016,
Gashwiler 1979). Eastern Diamondback Rattlesnake’s prey select habitat with
masting vegetation, and then EDBs use chemical cues to select sites near where
the prey is most often found, but camouflage and thermoregulatory needs are also
factors in site selection (Clark 2007).
Southeastern Naturalist
127
B.M. Heres, S.M. Welch, and J.L. Waldron
2018 Vol. 17, No. 1
The EDB’s sensitivity to shifts in prey availability show intra-seasonal shifts
in habitat selection. This sensitivity is indicative of a rapid response to shifts in
other trophic levels. Using vegetation analysis to quantify microhabitat selection
provides an informative look at foraging-habitat selection within a use-availability
framework. Eastern Diamondback Rattlesnake ambush-site selection can provide
valuable information about habitat needs during the foraging season. Analysis of
vegetation composition and mast availability can aid our understanding of predatorhabitat
selection between and within seasons, which can improve land-management
practices and further connect predatory species to lower trophic levels.
Acknowledgments
We thank D. Boucher, J. Cooley, and T. Houze for assisting with field research, and A.
Axel, T. Pauley, and D. Weaver for providing experience and editorial advice. We are grateful
to T. Norton for aid in snake surgery. We appreciate L. Crouch for providing access to
our study site.Funding was provided by NASA Space-Grant Consortium, the Marine Corps
Recruit Depot Parris Island, and Marshall University Department of Biological Sciences.
Support was provided by Nemours Wildlife Foundation.
Literature Cited
Balcombe, S.R., and G.P. Closs. 2016. Patchiness in food resources drives fish abundances
in emergent macrophytes under field and experimental conditions. Hydrobiologia
781:127–142.
Beasley, J., T. Devault, M. Retamosa, and O. Rhodes. 2007. A hierarchical analysis of
habitat selection by Raccoons in Northern Indiana. The Journal of Wildlife Management
71:1125–1133.
Beaupre, S. 2008. Annual variation in time–energy allocation by Timber Rattlesnakes (Crotalus
horridus) in relation to food acquisition. Pp. 111–122, In W. Hayes, K. Beamand,
M. Cardwell, and S. Bush (Eds.). The Biology of Rattlesnakes. Loma Linda University
Press, Loma Linda, CA. 606 pp.
Bogdziewicz, M., R. Zwolak, and E. Crone. 2016. How do vertebrates respond to mast
seeding? Oikos 125:300–307.
Bonnet, X., G. Naulleau, and R. Shine. 1999. The dangers of leaving home: Dispersal and
mortality in snakes. Biological Conservation 89:39–50.
Brown, J. 1992. Patch use under predation risk: I. Models and predictions. Annales Zoologici
Fennici 29:301–309.
Brown, W., D. Pyle, K. Greene, and J. Friedlaender. 1982. Movements and temperature
relationships of Timber Rattlesnakes (Crotalus horridus) in northeastern New York.
Journal of Herpetology 16:151–161.
Burghardt, K., and O. Schmitz. 2015. Influence of plant defenses and nutrients on trophic
control of ecosystems. Pp. 203–232, In T. Hanley and K. La Pierre (Eds.). Trophic Ecology:
Bottom-up and Top-down Interactions Across Aquatic and Terrestrial Systems.
Cambridge University Press, Cambridge, UK. 426 pp.
Burnham, K., and D. Anderson. 2002. Model Selection and Multimodel Inference: A Practical
Information-theoretic Approach. Springer-Verlag, New York, NY. 488 pp.
Castleberry, N., S. Castleberry, W. Ford, P. Wood, and M. Mengak. 2002. Allegheny Woodrat
(Neotoma magister) food habits in the central Appalachians. American Midland
Naturalist 147:80–92.
Southeastern Naturalist
B.M. Heres, S.M. Welch, and J.L. Waldron
2018 Vol. 17, No. 1
128
Chiszar, D., T. Melcer, R. Lee, C. Radcliffe, and D. Duvall. 1990. Chemical cues used by
Prairie Rattlesnakes (Crotalus viridis) to follow trails of rodent prey. Journal of Chemical
Ecology 16:79.
Clark, R. 2007. Public information for solitary foragers: Timber Rattlesnakes use conspecific
chemical cues to select ambush sites. Behavioral Ecology 18:487–490.
Dugan, E., and W. Hayes. 2012. Diet and feeding ecology of the Red Diamond Rattlesnake,
Crotalus ruber (Serpentes:Viperidae). Herpetologica 68:203–217.
Ernst, C.H., and E.M. Ernst. 2003. Snakes of the United States and Canada. Smithsonian
Books, Washington, DC. 680 pp.
Fill, J., J. Waldron, S. Welch, J. Gibbons, S. Bennett, and T. Mousseau. 2015. Using multiscale
spatial models to assess potential surrogate habitat for an imperiled reptile. PLOS
ONE 10:e0123307
Gashwiler, J. 1979. Deer Mouse reproduction and its relationship to the tree-seed crop. The
American Midland Naturalist 102:95–104.
Gilles, A., and W. McShea. 1992. A comparison of traps and fluorescent powder to describe
foraging for mast by Peromyscus leucopus. Journal of Mammalogy 73:218–222.
Greenberg, C., and D. Levey. 2009. Long-term monitoring of fleshy fruit and hard-mast
production and seasonal bird distribution at the Savannah River Site, South Carolina.
USDA Forest Service, Savannah River, New Ellenton, SC.
Harder, J., J. Kotheimer, and I. Hamilton. 2014. A regional study of diversity and abundance
of small mammals in Ohio. Northeastern Naturalist 21:210–233.
Harvey, D., and P. Weatherhead. 2010. Habitat selection as the mechanism for thermoregulation
in a northern population of Massasauga Rattlesnakes (Sistrurus catenatus).
EcoScience 17:411–419.
Inman, R., and M. Pelton. 2002. Energetic production by soft- and hard-mast foods of
American Black Bears in the Smoky Mountains. Ursus 13:57–68.
James, F., and H. Shugart. 1970. A quantitative method of habitat description. Audubon
Field Notes 24.
Madsen, T., and R. Shine. 2000. Silver spoons and snake-body sizes: Prey availability early
in life influences long-term growth rates of free-ranging pythons. Journal of Animal
Ecology 69:952–958.
Moller, H. 1983. Foods and foraging behaviour of Red (Sciurus vulgaris) and Grey (Sciurus
carolinensis) Squirrels. Mammal Review 13:81–98.
Moore, J., and J. Gillingham. 2006. Spatial ecology and multi-scale habitat selection by a
threatened rattlesnake: The Eastern Massasauga (Sistrurus catenatus catenatus). Copeia
4:742–751.
National Oceanic and Atmospheric Administration (NOAA). 2015. National Weather
Service Forecast Office. Available online at http://www.weather.gov. Accessed August
2015.
Ostfeld, R., and R. Holt. 2004. Are predators good for your health? Evaluating evidence
for top-down regulation of zoonotic-disease reservoirs. Frontiers in Ecology and the
Environment 2:13–20.
Ostfeld, R.S., and F. Keesing. 2000. Pulsed resources and community dynamics of consumers
in terrestrial ecosystems. Trends in Ecology and Evolution 15:232–237.
Ostfeld, R., C. Jones, and J. Wolff. 1996. Of mice and mast: Ecological connections in
eastern deciduous forests. Bioscience 46:323–330.
Pyke, G. 1978. Optimal foraging in hummingbirds: Testing the marginal value theorem.
American Zoologist 18:739–752.
Reinert, H., D. Cundall, and L. Bushar. 1984. Foraging behavior of the Timber Rattlesnake,
Crotalus horridus. Copeia 1984:976–981.
Southeastern Naturalist
129
B.M. Heres, S.M. Welch, and J.L. Waldron
2018 Vol. 17, No. 1
Roth, E., P. May, and T. Farrell. 1999. Pigmy Rattlesnakes use frog-derived chemical cues
to select foraging sites. Copeia 3:772–774.
Schmidt, K., and R. Ostfeld. 2003. Songbird populations in fluctuating environments:
Predator responses to pulsed resources. Ecology 84:406–415.
Shimada, T., and T. Saitoh. 2006. Re-evaluation of the relationship between rodent populations
and acorn masting: A review from the aspect of nutrients and defensive chemicals
in acorns. Population Ecology 48:341–352.
Silvertown, J. 1980. The evolutionary ecology of mast seeding in trees. Biological Journal
of the Linnaean Society 14:235–250.
Smith, C. 1970. The coevolution of Pine Squirrels (Tamiasciurus) and conifers. Ecological
Monographs 40:349–371.
Stephens, R., and E. Anderson. 2014. Habitat associations and assemblages of small mammals
in natural plant communities of Wisconsin. Journal of Mammalogy 95:404–420.
Theodoratus, D., and D. Chiszar. 2000. Habitat selection and prey odor in the foraging behavior
of Western Rattlesnakes (Crotalus viridus). Behaviour 137:119–135.
Waldron, J., S. Bennett, S. Welch, M. Dorcas, J. Lanham, and W. Kalinowsky. 2006a. Habitat
specificity and home-range size as attributes of species vulnerability to extinction: A
case study using sympatric rattlesnakes. Animal Conservation 9:414–420.
Waldron, J., J. Lanham, and S. Bennett. 2006b. Using behaviorally based seasons to investigate
Canebrake Rattlesnake (Crotalus horridus) movement patterns and habitat selection.
Herpetologica 62:389–398.
Waldron, J., S. Welch, and S. Bennett. 2008. Vegetation structure and the habitat specificity
of a declining North American reptile: A remnant of former landscapes. Biological
Conservation 141:2477–2482.
Waldron, J., S. Welch, S. Bennett, W. Kalinowsky, and T. Mousseau. 2013. Life-history
constraints contribute to the vulnerability of a declining North American rattlesnake.
Biological Conservation 159:530–538.
Wolff, J. 1996. Population fluctuations of mast-eating rodents are correlated with production
of acorns. Journal of Mammalogy 77:850–856.
Xiao, Z., X. Gao, M. Jiang, and Z. Zhang. 2009. Behavioral adaptation of Pallas’s squirrels
to germination schedule and tannins in acorns. Behavioral Ecology 20:1050–1055.


 The Southeastern Naturalist is a peer-reviewed journal that covers all aspects of natural history within the southeastern United States. We welcome research articles, summary review papers, and observational notes.