2011 SOUTHEASTERN NATURALIST 10(3):459–476
Short-term Assessment of Morphological Change on Five
Lower Mississippi River Islands
James E. Moore1,2,3,*, Scott B. Franklin2,4, Daniel Larsen5,
and Jack W. Grubaugh2,6
Abstract - To examine short-term morphological changes and variables controlling this
change, we conducted a study on five lower Mississippi River islands in 2007 and 2008.
The southernmost island was located 25 km north of Memphis, TN, and the northernmost
island was located 105 km north of Memphis. We surveyed elevations along six transects
for each of the five islands to examine morphological changes between years and measured
river velocity and backscatter intensity (sediment load) at the head, middle, toe,
zee, and fore sides of the islands. We predicted the impacts of flooding on island geomorphology
would be greatest at the head (upstream edge) and fore (thalweg) side. In
addition, we predicted the morphology of islands present in the main channel in the 1890s
would differ in morphology from contemporary islands. Results indicated morphological
change during the study period but only in width. Islands showed general lateral migration,
with one side aggrading while the other side eroded. Changes in morphological
characteristics were consistent with intensity of river flow around the islands, with the
highest velocity and sediment load observed near the island head and to a lesser degree
the thalweg side of islands. In reference to islands present in the late 1890s, contemporary
islands appear to be more elongated and have a greater surface slope. Since these islands
provide beneficial habitat for flora and fauna, it is crucial to understand the dynamic nature
of these landscape features.
Introduction
The Mississippi River is one of the world’s major river systems in size, habitat
diversity, and biological productivity, and is also one of the largest regulated rivers.
The lower Mississippi River (LMR) has undergone extensive modifications
for navigation and flood management (Hudson et al. 2008, Wasklewicz et al.
2004a). Research on this section of the Mississippi River has focused on channel
processes and form; however, little work has focused on riverine islands.
Islands are easily identifiable, with water surrounding them for a majority of the
year (Lekarczyk and Wasklewicz 2003, Osterkamp 1998). For our study, islands
were considered to be in-channel land features surrounded by water at least nine
months out of the year, with permanence not being a concern. Because of their
1Department of Biological Sciences, University of Memphis, 3700 Walker Avenue, Memphis,
TN 38152. 2Edward J. Meeman Field Station, University of Memphis, Millington,
TN 38058. 3Current address - Department of Biology, Christian Brothers University,
Memphis, TN, 38104. 4School of Biological Sciences, The University of Northern Colorado,
Greeley, CO 80639. 5Department of Earth Sciences, The University of Memphis,
201 Johnson Hall, Memphis, TN 38152. 6Department of Biological Sciences, The University
of Tennessee at Martin, Martin, TN 38238. *Corresponding author - jmoore25@
cbu.edu.
460 Southeastern Naturalist Vol. 10, No. 3
placement within the main channel, these islands can be impacted by the smallest
change in hydrology (Osterkamp 1998). Changes in the islands reflect variations
in erosional and depositional processes, which are ultimately affected by natural
processes and variables (flow velocity, water depth, sediment size and content)
as well as river control structures and vegetative cover, which is tightly linked
with flood intensity and duration of inundation. As such, a closer examination of
changes in morphometry (i.e., elevation and bank slopes) of riverine islands can
provide insight into river dynamics (Lane et al. 1998). Furthermore, evaluation
of island morphometry over relatively short durations (months to years) may
illustrate how these crucial habitats, and their associated floral and faunal communities,
may be altered.
Vegetative communities inhabiting islands along the LMR support many
migratory waterfowl for food and cover, and provide critical habitat for the
endangered Sterna antillarum (Lesson) (Least Tern; Smith and Renken 1991).
The vegetative communities on these islands, similar to their floodplain counterparts,
are intimately linked with hydrologic patterns. Periodic floods of varying
frequency, duration, and erosive capability affect vegetation by: creating new
land areas, changing bank stability, and ultimately forcing a gradient of flood
intensities as elevation on the island increases (Hupp and Osterkamp 1996).
Personal observations (J.E. Moore; over four years) on the islands indicate
that where dense monotypic stands of Salix nigra Marsh (Black Willow), Salix
interior Rowlee (Sandbar Willow), and Populus deltoides Bartram ex Marsh
(Cottonwood) are found, islands seem to persist and are less affected by low-to
moderate-magnitude events. Historical surveys of depositional islands in the
LMR show that once vegetated, they can become part of the mainland within 20
years, retarding the movement of water during floods and causing rapid sediment
deposition along their landward margin (Shull 1944).
In the LMR, there are two major types of islands. The first is created via chute
cut-off (Osterkamp 1998), either formed by deflected flow around woody flood
debris (Maser and Sedell 1994) or, more recently, wing dams; the second is created
from an increase in bed roughness that leads to sediment building through time to
form a mid-channel bar (island) (Osterkamp 1998). In both cases, aggradational
and degradational processes are event driven, with more severe floods resulting
in greater aggradation or degradation (Shull 1922, 1944). Thus, islands remain
dynamic, developing and disappearing over time if sparsely vegetated (Collins
and Knox 2003, Gurnell and Petts 2002, Lekarczyk and Wasklewicz 2003). Some
sections of the Mississippi River have shown a net loss in the number of islands
over historic time (Theiling 1998), while other sections have increased in island
number (Collins and Knox 2003). The main factors determining island formation
or loss are flow intensity, sediment movement, duration of flow (Collins
and Knox 2003, Nanson and Croke 1992), and vegetation characteristics; all of
these have changed along the Mississippi River over time (Nielson et al. 1984,
Shull 1944). Osterkamp (1998) suggests that the morphology of the island may
be indicative of processes by which they were formed (e.g., a teardrop shape is
typical of snag islands). Island degradation should occur where flow intensity and
2011 J.E. Moore, S.B. Franklin, D. Larsen, and J.W. Grubaugh 461
scouring effects are highest, i.e., head (upstream) portions and sides facing the
main channel (fore), and aggradation should occur at the toe (downstream) and
backwater sides (zee), resulting in downstream movement of islands over time
(Lekarczyk and Wasklewicz 2003, Osterkamp 1998); however, anthropogenic
modifications to the LMR may affect such relationships.
The objective of this project was to examine five islands over a two-year
period to determine how Mississippi River island morphology changes over
short time periods and to determine which measured factors correlate with island
change. We hypothesized that island morphology (assessed by measuring multiple
topographic transects) would change significantly within a two-year period
following a dry year (2007) and a flood year (2008). More specifically, we hypothesized
that fore (thalweg) sides would be more affected than zee (backwater;
away from main channel) sides due to differential scouring effects and that island
heads would be more affected than island toes. Finally, we also hypothesized that
the morphology of islands present in the main channel in the 1890s would differ
from contemporary islands.
Study Sites
The study area covers a portion of the LMR from river mile (rm) 754 to rm 804
and comprises ≈8.0% of the LMR channel length (Table 1, Fig. 1). This reach is
characterized by numerous wing dams and bank revetments (Hudson et al. 2008,
Wasklewicz et al. 2004a). Five islands were chosen to assess morphological
changes for a two-year period (2007–2008). The criteria for choosing islands included:
1) a separation from shore for at least nine months of a year, 2) a location
not along a major bend in the river, and 3) logistic ability to access the island by
boat. All islands were at least forty years old according to aerial photography and
Table 1. Island location, approximate area, % bare sand, % woody cover, maximum elevation for
2007 and 2008, and length/width ratio at high water. The final row gives the range of values (with
means in parentheses) from 10 randomly selected islands found in the 1890 Mississippi River Commission
navigational charts within the study area (Mississippi River Commission 1890).
Length/
Transect 1 Approximate % bare % woody Max width ratio
Island lat/long sample area (m2) sand cover elev. (m) total island
Densford Bar 35°23'16.3"N, 138,000 >90.0 1.5 10 6.28
90°04'14.6"W
Dean Island 35°25'54.9"N, 550,000 5.0 60.0 11 4.80
90°00'28.0"W
Sunrise Towhead 35°36'55.4"N, 25,000 30.0 44.0 8 5.29
89°54'11.5"W
Keyes Point 35°43'39.6"N, 84,000 34.6 29.9 8 5.80
89°54'22.5"W
Wardlow Bar 35°51'00.3"N, 83,400 46.7 24.0 11 7.08
89°43'34.1"W
1890 Islands (n = 10) 5250–1,950,000 3.0–95.0 5.0–75.0 3.1–6.1 2.75–7.5
(429,075) (4.6) (3.9)
462 Southeastern Naturalist Vol. 10, No. 3
river mapping data. The southernmost island (Densford Bar) was located at rm
754, and the northernmost island (Wardlow Bar) was located at rm 804. Dean Island
(rm 758), Sunrise Towhead (rm 778), and Keyes Point (rm 790), along with
Figure 1. Lower Mississippi River map showing research islands and gages in relation to
river mile with latitude/longitude coordinates for each island.
2011 J.E. Moore, S.B. Franklin, D. Larsen, and J.W. Grubaugh 463
Densford Bar and Wardlow Bar, were disconnected from the mainland during
low-moderate flow and were only connected to the mainland during extremely
low flow (<-5 m stage at Osceola, AR; Fig. 1). Each island differed in % bare
sand, % woody cover, and maximum elevation (Table 1).
Methods
Stage and discharge
The Mississippi River possesses an extensive network of gages that have been
recording river stage since the late 1800s (Wasklewicz et al. 2004b). For this
study, we used only the Osceola gage (gage 152), located near Osceola, AR at rm
783.5 with an elevation of 63.8 m (209.43 ft), for river-stage data and estimating
flood recurrence intervals. Gage data are uploaded daily from this gage, and
each daily recording is an average of three readings taken for that particular day
(8-hour intervals). River discharge is also reported based on readings from two
gages north and south of the study islands. The Hickman, KY gage is located at
rm 922 and has an elevation of 80.7 m (264.7 ft), whereas the Memphis, TN gage
is located at rm 734.4 and has an elevation of 56.1 m (183.9 ft).
Hydrology assessment
Elevations of five river gages (including the Osceola river gage) were used
to “zero” island elevation with river stage and provide an accurate estimate of
hydrological impacts on each island. Elevations of each gage were used in a regression
equation to obtain the slope of the river, a simple technique that allowed
us to determine a zero-point elevation for each island so hydrologic data would
match island elevation. To determine potential flow impacts (velocity and sediment
load) near each island, we used a Teledyne Workhorse Rio Grande acoustic
doppler current profiler (ADCP), which is an accurate rapid-sampling currentprofi
ling system designed to operate from a moving boat.
The acoustic doppler was employed to determine river flow velocity and
backscatter intensity (used to gain an understanding of how much sediment was
being carried at different locations around the islands) during high (>7.6 m) river
stage events in 2008. Three flow transects were established at each island: one
at the head, one in the middle (thalweg side), and one at the toe (Fig. 2a). These
measurements were recorded near the water-sediment interface at distances of
1 to 5 m away from island sides (when the boat could not float over the top, as
in middle sections) or island center to understand how flow velocity and sediment
load differed on fore and zee sides and on head, middle, and toe sections
of islands. Each measurement is a result of multiple acoustic soundings (pings)
sent through the water column by the doppler. The doppler receiver resolves the
reflected signals into multiple depth cells, each 5 cm in increment (high resolution),
that are used to calculate an average velocity for that particular depth cell.
Our recorded measurements were from the bottom depth cell (i.e., channel bed,
bottom 5 cm of water column) at 1 to 5 m distance from the island (i.e., five
measurements per transect). The velocity data from the bottom depth cells are
used as a proxy for bedding-plane shear stress at the sediment-water interface to
464 Southeastern Naturalist Vol. 10, No. 3
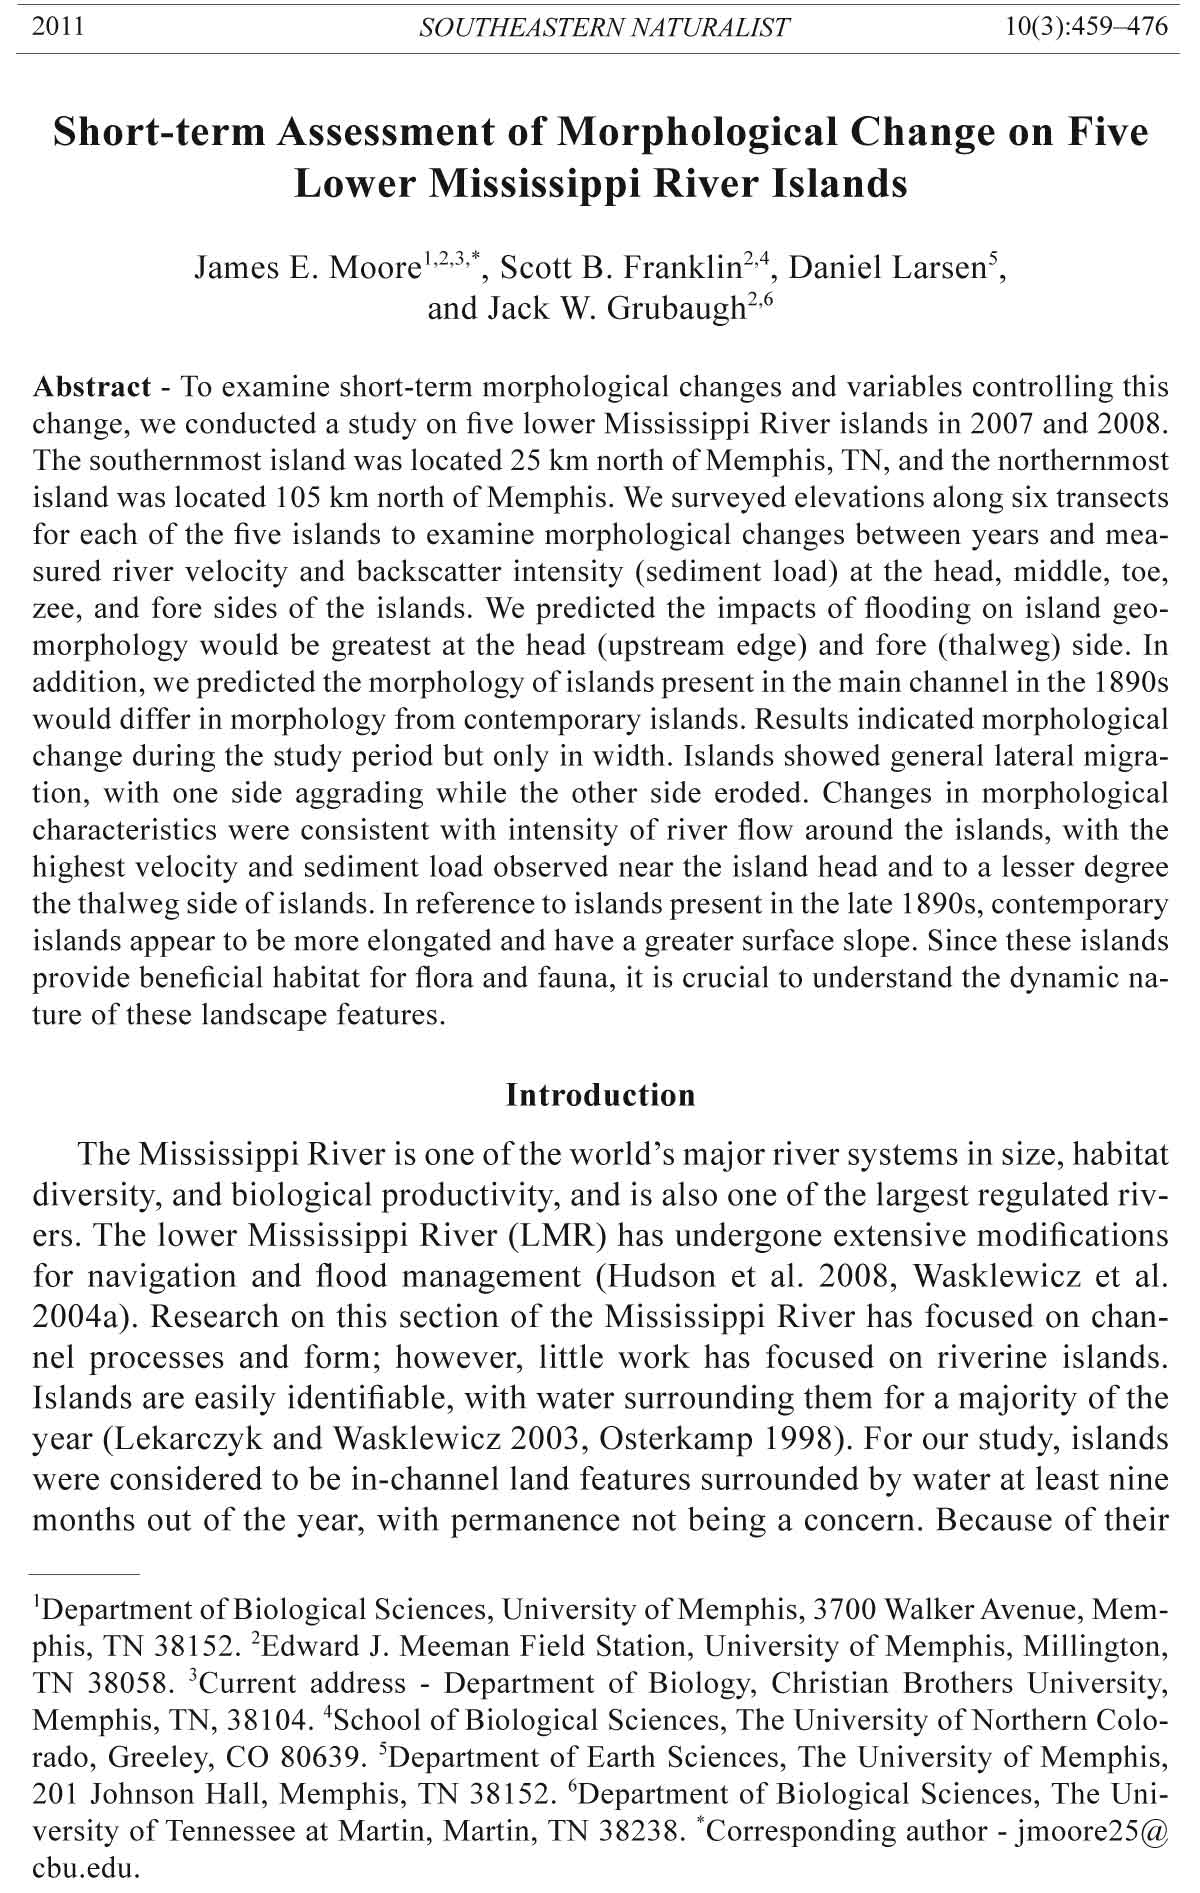
Figure 2. Aerial photos
of Densford Bar during
(a) a high stage
event (2010) and (b) a
low-stage event (2004).
Morophological terms
applied to islands are
show in (a). The sampling
scheme used to
collect flow velocity
and sediment backscatter
data using the ADCP
doppler is also shown.
Approximate island
area at low flow is also
illustrated.
2011 J.E. Moore, S.B. Franklin, D. Larsen, and J.W. Grubaugh 465
assess the potential for sediment movement at a given transect. The backscatter
signal allows for the interpretation of sediment transport and provides an estimate
of suspended sediment concentration; however, there is a poor understanding of
the sensitivity of the doppler to backscatter particle size (Kostaschuk et al. 2004).
Islands were sampled consistently during high-stage events, but only four (Densford
Bar, Dean Island, Sunrise Towhead, and Keyes Point) of the five islands
were sampled due to logistics and time constraints.
Morphological change
Six elevation transects were completed on each island extending from the water’s
edge on the fore side (main channel side) to that on the zee side (backwater;
away from main channel) and crossing the island perpendicular to overall flow.
A permanent stake was positioned at the highest elevation point of the island
encountered in each transect (typically near the center of the transect). Elevations
were determined using a David White® autolaser 300 and LD-12 detector
(David White, Germantown, WI) attached to a surveyor’s pole. Measurements
were taken at topographical deviations along transects from center stakes to
water’s edge on both sides of the islands (Fig. 2b) and transformed to 1-m resolution
(used in a companion study that examined plant community composition in
response to variable frequency and intensity of floods) (Moore et al., in press).
Transect length was used as a proxy to assess morphological change of each island.
Changes in transect length, after correction for deviation from zero water
level at each island, indicate changes in width and length of islands. Relative
changes in transect length are used to standardize comparison of island morphology.
Bare sand and percent woody vegetation cover along with length/width ratio
were quantified using Google Earth images (10 January 2007) (Moore 2011).
In an effort to compare contemporary island geomorphology with 1890 island
morphology, we randomly selected ten of the 13 islands mapped in 1890
that were similar in area to our islands and within the same river section (none
of the islands from this study were present in 1890) from the navigation charts
developed in 1890 by the Mississippi River Commission (Mississippi River
Commission 1890). These topographical maps exhibit 1.5-m (5-ft) contour intervals
and are easily comparable to our data, i.e., 1-m intervals. The scales of the
aerial photos, however, differed by a scale factor of four; 1:1524 m (1:5000 ft)
for contemporary islands and 1:6096 m (1:20,000 ft) for historical islands.
Data analysis
Maximum transect length on fore and zee sides between years were compared.
Data were analyzed using paired t-tests and general linear models (GLMs) using
SAS v.9.1.3 (SAS 2000). A Cochran-Armitage trend test was used to determine
if island elevation increased or decreased for the two-year study period (i.e.,
positive trend statistic = elevation increase, negative trend statistic = elevation
decrease).To assess differences in flow velocity and sediment load on different
sides and areas (head, middle, and toe) of the islands, we used multiple analysis
of variance (MANOVA). We also assessed angle of grade (slope) to confirm
466 Southeastern Naturalist Vol. 10, No. 3
differences on fore and zee sides and between years. We used a simple rise/
run technique in which we divided the elevation by transect length. Slope data
were arcsine transformed and analyzed using a GLM ANOVA. To compare 1890
and contemporary islands, we compared basic metrics on island elevation, area,
length/width ratio, and slope.
Results
Hydrology assessment
River stage in 2007 was on average lower than the twenty-year mean (Fig. 3a).
In 2007, the Mississippi River had 93 days of flow less than 0 m on the Osceola
gage (i.e., stage was negative) and only 10 days of flow greater than 7.62 m
(25 ft). Stage patterns in 2008 were on average higher than the twenty-year mean
and showed 59 days of flow with a negative stage and 81 days of flow greater
than 7.62 m (Fig. 3a). Discharge data were also higher in 2008 compared to
2007 (Fig. 4a, b), with 2008 showing the sixth highest discharge in twenty years
(Fig. 3b). 2008 peak flow had a modest recurrence time of 5.25 years, while 2007
had a recurrence time of 1.31 yrs (Fig. 4c). Doppler flow velocity showed no
statistical differences in regards to individual island, area of the island, or side;
however, head portions and fore sides appeared to have slightly higher velocities
(Fig. 5a, b). Also, suspended sediment concentration showed no statistically signifi
cant differences in area of the island, or side; however, head portions and fore
sides again appeared to have slightly higher sediment movement (Fig. 5c, d).
Morphological change
Historical islands averaged gentler slopes (mean slope = 0.07) with a maximum
slope of 0.23 (Table 1). Contemporary islands had greater elevation gradients
and, to a lesser extent, length/width ratios than their historic counterparts. Thus,
contemporary islands appear to have greater relief and are longer than historical
islands (Table 1). Transect length, however, showed significant interactions
for transect x side (P = 0.01). Zee sides had significantly longer transects than
fore sides (mean zee = 120 m; mean fore = 94 m) (Fig. 6). The greatest relative
changes in transect length occurred toward the head of the islands on fore sides
and on both the head and toe of islands on zee sides, but zee sides were not
noticeably more affected than fore sides (Fig. 7). Densford Bar and Sunrise Towhead
showed the greatest mean difference in transect length from 2007 to 2008
(Fig. 8). For all islands, a gain on one side meant a loss on the other, but such
dynamics were island- and transect-dependent; e.g., fore sides showed greater
positive differences compared to zee sides, with Densford Bar, Dean Island, and
Keyes Point increasing in overall transect length (Fig. 6).
Figure 3 (opposite page). (a) Daily Stage data for 2007, 2008, and the twenty-year average
(m). Asterisks indicate dates doppler data were collected (15 Feb 2008, 28 April
2008). (b) Annual peak discharge for Hickman, KY and Memphis, TN gages for twentyyear
period (1987–2008). Boxes represent peak discharge events for 2007 and 2008
respectively for the two gages.
2011 J.E. Moore, S.B. Franklin, D. Larsen, and J.W. Grubaugh 467
468 Southeastern Naturalist Vol. 10, No. 3
2011 J.E. Moore, S.B. Franklin, D. Larsen, and J.W. Grubaugh 469
No significant correlation between transect length and slope was observed
(not shown). On average, fore sides had greater slopes than zee sides (Fig. 9)
(mean fore slope = 0.34, mean zee slope = 0.26).
Figure 4 (opposite page, top). Discharge (m3/s) vs. River Stage (m) for Hickman, KY, and
Memphis, TN, gages in (a) 2007 and (b) 2008; labels indicate days near sampling period
for which discharge data were collected by US Army Corp of Engineers. (c) Recurrence
time for peak stages; + indicates 2007 peak discharge with a recurrence interval of 1.31
yrs., asterisk indicates 2008 peak discharge with a recurrence interval of 5.25 yrs. Y-axis
stage values are log scaled.
Figure 5 (opposite page, bottom). Mean (a) velocity (m/s) for head, middle, and toe areas
of islands; (b) velocity (m/s) for fore and zee sides; (c) backscatter (dB) for north, middle,
and toe areas of islands; and (d) backscatter for fore and zee sides. Error bars represent
(± 1 standard error).
Figure 6 (above). Transect (from island head [i.e., transect 6] to toe [i.e., transect 1]) length
by island for five islands in the Mississippi River. Wide bars represent 2007 lengths, whereas
thin bars represent 2008 lengths. Positive values represent fore side and negative values
represent zee side. Thin bars longer than wide bars = aggrading transects.
470 Southeastern Naturalist Vol. 10, No. 3
2011 J.E. Moore, S.B. Franklin, D. Larsen, and J.W. Grubaugh 471
Figure 7 (opposite page, top). Mean relative change in transect (from island head [6] to
toe [1]) length for five islands in the Mississippi River. Positive represents fore side and
negative represents zee side.
Figure 8 (opposite page, bottom). Mean difference in overall transect length for each of
five Mississippi River islands combining fore and zee sides. Error bars represent (± 1 SE).
Figure 9 (above). Mean side slopes of five Mississippi River Islands for 2007 and 2008:
(a) fore sides and (b) zee sides.
472 Southeastern Naturalist Vol. 10, No. 3
No statistically significant changes in island elevation were witnessed from
2007 to 2008 (F = 0.59; P = 0.44). A Cochran-Armitage trend test was used to
determine the direction of change (increasing or decreasing) in elevation from
2007 to 2008 and showed that all islands collectively were decreasing in elevation
(Trend test statistic = -4.31), especially at lower elevations. However, independently,
peak-elevation increases of three islands were not statistically significant:
Densford Bar (9.79 to 10.21 m), Sunrise Towhead (6.51 to 7.28 m), and Wardlow
Bar (8.53 to 10.3 m). Dean Island and Keyes Point decreased, also insignificantly,
in elevation from 10.93 to 10.11 m and from 8.19 to 7.32 m, respectively. Overall,
morphological changes ranged from minor, on Dean Island, to substantial changes
on all transects on Densford Bar (Fig. 6).
Discussion
We documented the short-term changes in morphology of five islands in the
Mississippi River from 2007 (a low-water year) to 2008 (a high-water year). As
hypothesized, island morphology changed significantly, but only in width (i.e.,
transect length). While there were elevational changes, the observed changes
in peak elevation were not statistically significant. This result is not surprising
given that flooding events were of relatively low magnitude in 2008 and did not
affect upper island elevations. Biologically, however, the elevation change on the
lower parts of the islands had dramatic impacts on vegetation. The three islands
that increased in elevation (Densford Bar, Sunrise Towhead, and Wardlow Bar)
experienced a minimum of 42 cm aggradation during this study period, which
could be detrimental to perennial plant species now buried under recent sedimentation.
However, these results are not consistent with % woody vegetation cover.
Based on contemporary low-water images, Densford Bar had the highest % bare
sand of any island and is only sparsely vegetated (≈1.5% woody vegetation; Table
1), but gained elevation. In contrast, Sunrise Towhead had the second highest
% woody cover (44.0%) and showed a gain in elevation (aggradation). Previous
studies have suggested that high % woody vegetation cover on islands leads to
greater sediment retention (see Shull 1922, 1944); however, contemporary lowwater
images suggest that other factors are important for sediment retention on
islands (i.e., distance to mainland, distance from major turn in river, dike field
proximity, etc.).
To test possible correlative factors affecting island morphology, we assessed
proximity to nearest wing dam field and distance to the mainland with aerial
photos. No apparent correlation with proximity to wing dams was observed; however,
one striking similarity of islands that gained elevation was their respective
distance to the mainland. Based on contemporary low-water images, Densford
Bar was approximately 167 m from the mainland, Sunrise Towhead was 50 m,
and Wardlow Bar 129 m. The two islands that degraded were Dean Island (344
m away) and Keyes Point (229 m away). We speculate that close proximity to the
mainland reduces flow and ultimately affects sediment retention as high water
moves over the floodplain. Kesel et al. (1974) found that sediment thickness and
texture decreased rapidly away from the main channel following the 1973 flood
2011 J.E. Moore, S.B. Franklin, D. Larsen, and J.W. Grubaugh 473
in the Mississippi River Valley. It is likely that islands close to the mainland are
indeed extensions of the nearby floodplain and receive floodplain-like deposits.
Overbank sedimentation has shown similar responses in other portions of the Mississippi
River. Kesel et al. (1974) found sediment deposition as much as 53 cm
thick on natural levees following the 1973 event, and Gruelich et al. (2007) found
15 cm of sediment deposition in a low-lying area of Sunrise Towhead (different
area from this study). European rivers showed similar trends, but differed signifi-
cantly in terms of catchment area; therefore, comparisons are difficult (Walling and
He 1998). One other factor that deserves scrutiny is the grain size of the sediment
that comprises these islands. Personal observations (J.E. Moore) indicate that sand
is the dominant substrate, at least in the upper 30 cm of soil. Below 30 cm, there appears
to be a silty/clay layer that is likely the result of slow receding waters laiden
with sediment from previous floods. Thus, more intense floods may be needed to
move larger sediment, such as the upper sandy layer, away from islands.
Morphological changes were island specific, but overall patterns occurred.
Although factors controlling fore-side versus zee-side sedimentation and erosion
are complex, the islands all showed that aggradation on one side was balanced
by erosion on the other. In an extreme case, the entire mass of Keyes Point island
shifted toward shore (in this case, away from the main channel), which is supported
by higher sediment load in the water column at the closest distance to the
islands (Fig. 5c, d).
In addition, the river velocity and sediment transport at the heads of islands
and, to a lesser extent, fore sides appeared greater than at the toe or zee sides,
suggesting increased intensity of flooding and sediment movement in these areas.
Although not statistically significant (due to a small sample size and only moderate
flow), the difference may be ecologically relevant (see below). For example,
the greatest relative changes in transect length occurred at the head end of the
islands. In addition, the velocity data corroborate observations of greater slope
angles on fore sides. Such dynamics might be expected to lead to a shift downstream
for islands, as in bar migration (Osterkamp 1998), but our islands only
shifted laterally. The pattern suggests a shift in flow intensity from one side to the
other (lateral movement), but a constant structure (spur dike or wing dam) that
holds the island in transverse place. While our data are notably of short duration,
this concept deserves further scrutiny with more data. Island changes in transect
lengths were similar for fore and zee sides, suggesting island-specific shifting.
However, contemporary islands were notably longer than historical (1890) islands
as would be expected from accumulation of finer sediments on downstream
margins (Cobb 1999).
The observed changes in island morphology relative to historic data may be
the result of anthropogenic changes in the Mississippi River. Flood stage for a
given discharge event has increased 2–4 m over the past century (Criss and Shock
2001). In modified river systems, such as the Mississippi, it has been shown that
the most severe effects of human modification were in stretches that include
cut-offs, spur dikes, and levees (Belt 1975, Pinter et al. 2000, Remo et al. 2009,
Stevens et al. 1975), all of which were found in our study reach. Cut-offs lead to
474 Southeastern Naturalist Vol. 10, No. 3
increased slope, increased power, and a widening and deepening of the channel.
Cobb (1999) observed a degradation of river thalweg between rm 630 and 780,
a reach encompassing our study area. At the same time, dike systems lead to a
localized flattening of channel slope, increased channel roughness, vertical accretion
of bars (and subsequently islands), increased main channel volume, and
stage reductions at low discharge. For nearly the entire lower Mississippi River
(rm 315–954), an overall decrease in sandbar area was observed from 1948 to
1988 (Cobb 1999).
The lack of elevation change during the two-year study is not surprising.
Islands tend to build in height (rapid deposition) until they reach the floodplain
level (Kellerhall 1976), at which time deposition will decrease. Aerial photographs
indicate this is the case for at least two of the islands (Sunrise Towhead
and Wardlow Bar). If islands build to the level of the floodplain and the thalweg
has incised as described above (Cobb 1999), i.e., lowering the location of the
thalweg relative to floodplain height, then contemporary islands should have
greater relief and steeper slopes than 1890 islands. Thus, a threshold exists and
once reached influences the rate of island morphological change. Our data compared
to islands in 1890 corroborate this major change in island morphology.
Because islands may serve as important landscape elements for biodiversity,
understanding their dynamics is important. It is obvious that a major flood event
leads to significant changes in island morphology, but the change seems to be
a shift rather than overall loss. Herbaceous plant richness decreased drastically
when examining the total species pool on all five islands (77 to 34 species) and
average island species pool (30 to 17 species) from 2007 to 2008 (Moore et al.
2011). Thus, islands do serve as dynamic but continuous morphological structures
in the riparian landscape that provide open areas for pioneer plant and
animal taxa.
For example, Least Terns are highly impacted by increases in river stage
that decrease available nesting site area; thus, only higher elevation islands
may provide useful nesting grounds for this endangered species (Dugger et
al. 2002). Likewise, a strong relation exists between vegetation and fluvial
dynamics (Cooperman and Brewer 2005), with the two main driving variables
of vegetation being the flood/flow pulse and sediment dynamics (Steiger et
al. 2005). Thus, the study of island morphological dynamics related to their
ecological services as habitat is of management concern and is an important
direction for future research. Equal importance should also be placed on the effects
of lateral “movement” of islands within the main channel.
Acknowledgments
The authors wish to thank Jerry Garrett from the USGS for permitting the use of the
ACDP and for also helping with the interpretation of data. Michael Thron of the US
Army Corps of Engineers provided discharge data. We also thank the Meeman Biological
Field station and Darrell Van Vickle for logistic support and boat travel. This manuscript
was also greatly improved by the comments of Dr. Jerry Miller and two anonymous
reviewers.
2011 J.E. Moore, S.B. Franklin, D. Larsen, and J.W. Grubaugh 475
Literature Cited
Belt, C.B. 1975. The 1973 flood and man’s constriction of the Mississippi River. Science
189:681–684.
Cobb, S.P. 1999. Biological Assessment: Interior Population of the Least Tern, Sterna
antillarum, Regulating Works Project, Upper Mississippi River (River Miles 0–195)
and Mississippi River and Tributaries project, Channel Improvement Feature, Lower
Mississippi River (River Miles 0–954.5, AHP). US Army Corps of Engineers Mississippi
Valley Division, Mississippi River Commission, Vicksburg, MS.
Collins, M.J., and J.C. Knox. 2003. Historical changes in Upper Mississippi River water
areas and Islands. Journal of the American Water Resources Association 39:487–500.
Cooperman, M.S., and C.A. Brewer. 2005. Relationship between plant distribution
patterns and the process of river island formation. Journal of Freshwater Ecology
20:487–501.
Criss, R.E., and E.L. Shock. 2001. Flood enhancement through flood control. Geology
29:875–878.
Dugger, K.M., M.R. Ryan, D.L. Galat, R.B. Renken, and J.W. Smith. 2002. Reproductive
success of the interior Least Tern (Sterna antillarum) in relation to hydrology on the
Lower Mississippi River. River Research and Applications 18:97–105.
Gruelich, S., S.B. Franklin, T. Wasklewicz, and J.W. Grubaugh. 2007. Hydrogeomorphology
and forest composition of sunrise towhead island in the Lower Mississippi
River. Southeastern Naturalist 6:217–234.
Gurnell, A.M., and G.E. Petts. 2002. Island-dominated landscapes of large floodplain
rivers: A European perspective. Freshwater Biology 47:581–600.
Hudson, P.F., H. Middelkoop, and E. Stouthamer. 2008. Flood management along the
lower Mississippi and Rhine rivers (The Netherlands) and the continuum of geomorphic
adjustment. Geomorphology 101:209–236.
Hupp, C.R., and W.R. Osterkamp. 1996. Riparian vegetation and fluvial geomorphic
processes. Geomorphology 14:277–295.
Kellerhall, R. 1976. Stable channels and gravel-paved beds. American Society of Civil
Engineers Proceedings, Journal of Waterways and Harbors 93:63–84.
Kesel, R.H., K.C. Dunne, R.C. McDonald, and K.R. Allison. 1974. Lateral erosion and
overbank deposition of the Mississippi River in Lousiana caused by 1973 flooding.
Geology 2:461–464.
Kostaschuk, R., J. Best, P. Villard, J. Peakall, and M. Franklin. 2004. Measuring flow
velocity and sediment transport with an acoustic doppler current profiler. Geomorphology
68:25–37.
Lane, S.N. 1998. The use of digital terrain modeling in the understanding of dynamic
river channel systems. Pp. 311–341, In S.N. Lane, J.H. Chandler, and K.S. Richards
(Eds.). Landform Monitoring, Modeling, and Analysis. Wiley, Chichester, UK.
Lekarczyk, M.T., and T.A. Wasklewicz. 2003. Island morphometry: 55 years of change
on the northern lower Mississippi. M.Sc. Thesis. The University of Memphis, Memphis,
TN, 36pp.
Maser, C., and J.R. Sedell. 1994. From the Forest to the Sea: The Ecology of Wood in
Streams, Rivers, Estuaries, and Oceans. St. Lucie Press, Delray Beach, FL.
Mississippi River Commission. 1890. Surveys of the Mississippi River. Available online
at http://alabamamaps.ua.edu/historicalmaps/MississippiRiver/index.html. Accessed
3 January 2011.
476 Southeastern Naturalist Vol. 10, No. 3
Moore, J.E. 2011. Using Mississippi River islands to understand plant community dynamics.
Ph.D. Dissertation. The University of Memphis, Memphis, TN.
Moore, J.E., S.B. Franklin, and J.W. Grubaugh. 2011. Herbaceous plant community responses
to fluctuations in hydrology: Using Mississippi River islands as models for
plant community assembly. Journal of the Torrey Botanical Society 38:175–189.
Nanson, G.C., and J.C. Croke. 1992. A genetic classification of floodplains. Geomorphology
4:459–486.
Nielsen, D.N., R.G. Rada, and M.M. Smart. 1984. Sediments of the Upper Mississippi
River: Their sources, distribution, and characteristics. Pp. 67–98, In J.G. Wiener, R.V.
Anderson, and D.R. McConville (Eds.). Contaminants in the Upper Mississippi River.
Butterworth Publishers, Stoneham, MA.
Osterkamp, W.R. 1998. Processes of fluvial island formation, with examples from Plum
Creek, Colorado and Snake River, Idaho. Wetlands 18:530–545.
Pinter, N., R. Thomas, and J.H. Wlosinski. 2000. Regional impacts of levee construction
and channelization, middle Mississippi River, USA. Pp. 351–361, In J. Masalek, W.
Ed Watt, Evzen Zeman, and Friedhelm Sieker (Eds.). Flood Issues in Contemporary
Water Management. Kluwer Academic Publishers, Boston, MA.
Remo, J.W.F, N. Pinter, and R. Heine. 2009. The use of retro- and scenario-modeling to
assess effects of 100+ years of river engineering and land-cover change on Middle and
Lower Mississippi River flood stages. Journal of Hydrology 376:403–416.
SAS 2000. SAS/STAT User’s Guide, Version 8.1. SAS Institute, Inc., Cary, NC.
Shull, C.A. 1922. The formation of a new island in the Mississippi River. Ecology
3:202–206.
Shull, C.A. 1944. Observations of general vegetational changes on a River Island in the
Mississippi River. American Midland Naturalist 32:771–776.
Smith, J.W., and R.B. Renken. 1991. Least Tern nesting habitat in the Mississippi River
Valley adjacent to Missouri. Journal of Field Ornithology 62:497–504.
Steiger, J., E. Tabacci, S. Dufour, D. Corenblit, and J.L. Peiry. 2005. Hydrogeomrphologic
processes affecting riparian habitat within alluvial channel-floodplain river systems:
A review for the temperate zone. River Research and Applications 21:719–737.
Stevens, M.A., D.B. Simons, and S.A. Schumm. 1975. Man-induced changes of middle
Mississippi River. American Society of Civil Engineers, Journal of the Waterways,
Harbors, and Coastal Engineering Division 101:119–133.
Theiling, C. 1998. River geomorphology and floodplain habitats. Pp. 4-1–4-21, In R.L.
Delaney, K. Lubinski, and C. Theiling (Eds.). Ecological Status and Trends of the Upper
Mississippi River System 1998. A Report of the Long Term Resource Monitoring
Program, US Geological Survey, LaCrosse, WI.
Walling, D.E., and Q. He. 1998. The spatial variability of overbank sedimentation on
river floodplains. Geomorphology 24:209–223.
Wasklewicz, T.A., P.S. Liu, and S. Anderson. 2004a. Geomorphic context of channel
locational probabilities along the Lower Mississippi River, USA. Geomorphology
63:145–158.
Wasklewicz, T.A., J.W. Grubaugh, S.B. Franklin, and S. Greulich. 2004b. 20th-century
stage trends along the Mississippi River. Physical Geography 25:208–224.


 The Southeastern Naturalist is a peer-reviewed journal that covers all aspects of natural history within the southeastern United States. We welcome research articles, summary review papers, and observational notes.