Application of GIS Techniques for Developing a
Fish Index of Biotic Integrity for an Ecoregion with Low
Species Richness
Ernie F. Hain, Stacy A.C. Nelson, Bryn H. Tracy, and Halil I. Cakir
Southeastern Naturalist, Volume 11, Issue 4 (2012): 711–732
Full-text pdf (Accessible only to subscribers. To subscribe click here.)
2012 SOUTHEASTERN NATURALIST 11(4):711–732
Application of GIS Techniques for Developing a
Fish Index of Biotic Integrity for an Ecoregion with Low
Species Richness
Ernie F. Hain1,*, Stacy A.C. Nelson1, Bryn H. Tracy2, and Halil I. Cakir3
Abstract - We describe a process for developing an index of biotic integrity (IBI) for
resident fish communities in an ecoregion that exhibits low natural species richness. From
1990 to 2006, fish community samples were collected by the North Carolina Division
of Water Quality (NCDWQ) at 36 sample sites in the Cape Fear, Lumber, and Yadkin
river basins within the Sandhills region of North Carolina. The NCDWQ does not currently
have an IBI capable of distinguishing significant differences between reference
and non-reference streams. To develop a more robust method of measuring responses
to anthropogenic disturbance, we delineated contributing watersheds for each of the 36
sample sites using a geographic information system, hydrologic modeling, and 20-footresolution
digital elevation models derived from light-detection and ranging data. The
2001 National Land Cover Database (NLCD) and in situ habitat data were used to determine
various land-use/land-cover and hydrologic variables within each watershed.
These variables were then used to select the sites with absolute minimal anthropogenic
impacts. We used the Kruskal-Wallis test to identify 11 fish-community metrics, 2 chemical
metrics, and 9 individual species that were significantly different between reference
and non-reference sites. Of the final 15 metrics, only 3 exhibited higher values in reference
streams. Our results demonstrate that the abundance and richness of the Sandhills
fish fauna are greater in areas more highly impacted by anthropogenic activities. By
automating the process by which reference sites are chosen, we were able to produce a
multi-metric IBI that reflects the varying levels of anthropogenic impacts on wadeable
streams in the Sandhills.
Introduction
Land conversions by urbanization may degrade water quality and fish habitat
by increasing the amount of impervious surfaces, storm water runoff, excess
sediment, and environmental pollutants that drain into waterways (Jennings and
Jarnagin 2002, Paul and Meyer 2001, Wang et al. 2001). Increasing developmental
pressures within the Sandhills region of North Carolina may conflict with
the ability of the state’s water quality agency (North Carolina Division of Water
Quality [NCDWQ]) to determine baseline reference conditions for the geographically
unique waters of this area. The development of effective biological
classification criteria and the use of geospatial tools, such as geographic information
systems (GIS) and remote sensing, can play a vital role in developing more
efficient monitoring tools that account for escalating levels of development, and
1Center for Geospatial Sciences, Department of Forestry and Environmental Resources,
North Carolina State University, Raleigh, NC. 2North Carolina Division of Water Quality,
Raleigh, NC. 3US Environmental Protection Agency, Research Triangle Park, NC. *Corresponding
author - ernie_hain@ncsu.edu.
712 Southeastern Naturalist Vol. 11, No. 4
their associated impacts on aquatic ecosystem health (Schueler 1994, Schueler
and Clayton 1997).
In recent decades, government agencies and volunteer organizations have
developed integrative approaches to efficiently monitor the health of flowing
waters (Heiskary et al. 1994, Kerr et al. 1994, Obrecht et al. 1998). Traditionally,
in situ chemical and benthic macroinvertebrate monitoring have been the primary
method of water-quality and aquatic-systems assessment (US EPA 1996, 1999).
These methods have successfully identified local impairments to water bodies
over short periods of time, although they are limited in providing a “wholesystems
approach” in the assessment of environmental conditions over a larger
spatial and temporal scale. Fish indices of biotic integrity (IBI) have emerged as
a prominent tool for monitoring long-term stream ecosystem health (Bozzetti and
Schulz 2004, Karr and Chu 1997, Zampella and Bunnell 1998).
Fish IBIs were developed as an innovative approach to assess the diminishing
capability of freshwater systems to support stable biotic communities (Karr
1981). Since then, many state regulatory agencies have adopted this biological
assessment tool, and have found significant correlations between fish community
composition and habitat quality (Pirhalla 2004, Zampella and Bunnell 1998).
The primary objective of a fish index of biotic integrity is to determine what
fish-community characteristics respond to anthropogenic impacts in a given
ecoregion (Bozzetti and Schulz 2004). To determine the biologic consequences
of human actions, a baseline that estimates minimal human impact is established,
using natural, least-disturbed, or best-attainable conditions (Karr and Chu 1997,
Stoddard et al. 2006). The development of a fish IBI takes into account resident
fish populations and assemblages by assessing the numbers and types of fish in
comparison to populations within reference streams.
In addition to fish communities, the concept of an IBI has been used to assess
ecological conditions based on invertebrates, birds, and zooplankton (Kerans
and Karr 1994, Lougheed and Chow-Fraser 2002, O’Connell et al. 2000). The
original fish IBI proposed by Karr (1981) incorporated species composition
and richness as well as ecological factors such as trophic status and disease to
discriminate between disturbed and non-disturbed sites. This concept has been
expanded in some studies to include behavioral and physiological factors such as
migration, habitat usage, and nest placement (O’Connell et al. 2000). In addition
to assessing water quality, IBI’s based on fish or other taxa have been successfully
used in predicting community assemblages and explaining ecological processes
(Hawkins et al. 2000,Wallace et al. 1996).
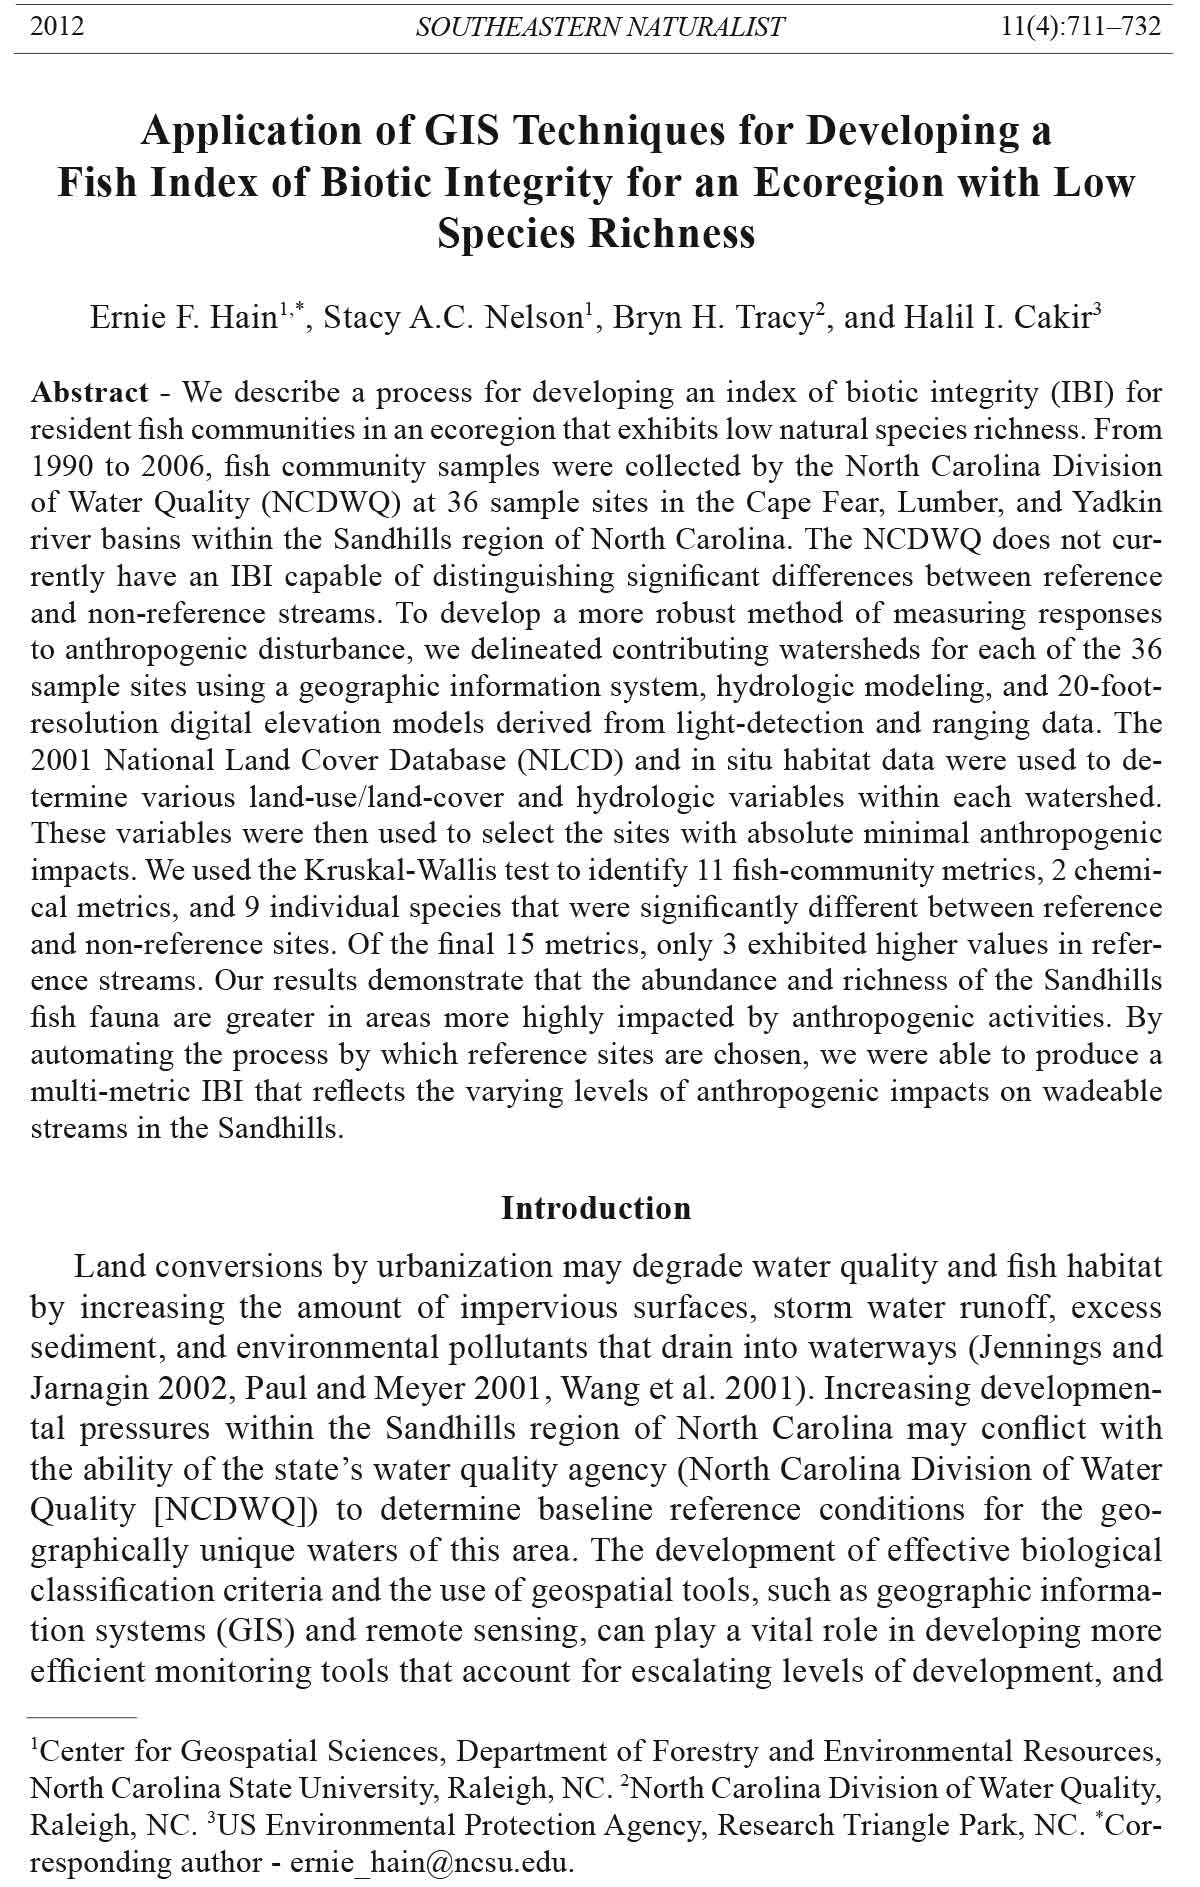
Ambient water quality and benthic macroinvertebrate sampling by the
NCDWQ within the Sandhills region (Fig. 1) suggest excellent water-quality
conditions, although the fish assemblage quality has not been rated. Several
intolerant fish species are endemic to the Sandhills, including Etheostoma
mariae Fowler (Pinewoods Darter) and Semotilus lumbee Snelson and Suttkus
(Sandhills Chub) (NCDENR 2002, 2004). Any change in fish assemblages
could suggest anthropogenic alterations in habitat, water quality, or species
composition.
2012 E.F. Hain, S.A.C. Nelson, B.H. Tracy, and H.I. Cakir 713
Streams in the Sandhills have low gradients, mild climates, and receive
consistent flow throughout the year due to sandy soils, ground water storage,
and aquifer additions (Griffith et al. 2002, Winner and Coble 1996). Partly due
to these characteristics, fish species richness in headwater reaches is similar to
reaches lower in the watershed (Paller 1994). Even though fish fauna richness
is lower in the Sandhills than in nearby ecoregions, richness is longitudinally
homogenous throughout individual watersheds, thus enhancing the importance
of headwater habitats (Paller 1994). Paller et al. (1996) developed a fish IBI
in the South Carolina Coastal Plain and Sandhills that was able to discriminate
between reference and non-reference sites using 6 community-metric categories.
While the South Carolina IBI was more precise than a benthic macroinvertebrate
multi-metric index for the same region, identification of disturbed sites was most
accurate when both taxonomic groups were used (Paller 2001).
The objectives of this study were to develop an automated process in a GIS
that distinguishes reference from non-reference sites, and to use this model to
produce an effective fish IBI for the Sandhills region. For each site, our GIS
model produced a database containing land use, in-stream habitat variables,
physical characteristics, and hydrologic features collected with remote sensing
and GIS technologies, and identified sites as either reference or non-reference.
The database was then analyzed to determine which community metrics were
Figure 1. North Carolina and Sandhills Level IV ecoregions as designated by US EPA
(Griffith et al. 2002).
714 Southeastern Naturalist Vol. 11, No. 4
significantly different (P < 0.05) between reference and non-reference sites, and
create a scoring technique whereby sampled sites were rated as either poor, fair,
good-fair, good, or excellent. These results allow NCDWQ and other resource
managers to assess the health of stream fish communities and thereby enhance
aquatic conservation for a unique ecoregion.
Methods
Study area
The North Carolina Sandhills (sometimes spelled Sand Hills), designated as an
US EPA Level IV ecoregion, contains portions of 9 counties across 3 river basins:
Cape Fear, Lumber, and Yadkin-Pee Dee (Fig. 1). The Sandhills region is considered
a transition zone between the Coastal Plain and Piedmont with a landscape
characterized by rolling, sandy hills with dense hydrologic drainage networks.
Geologically, the Sandhills ecoregion is composed of dry, sandy ridge tops (Jacqmain
et al. 1999). Soils typically consist of thick, droughty, and low-nutrient,
Cretaceous-aged marine sands (Griffith et al. 2002). This ecoregion is home to
sprawling urban areas such as Fayetteville and Southern Pines, as well as the Fort
Bragg Army Base. The forested areas have been drastically reduced as a result
of logging and clearing, and fire suppression has altered the community properties
(Landers et al. 1995). Remaining forests are primarily a mixed-pine matrix of
Pinus palustris Mill (Longleaf Pine), P. taeda L. (Loblolly Pine), and P. echinata
Mill (Shortleaf Pine), although the entire region was once dominated by Longleaf
Pine. Hardwood Quercus (oak) forests are also found in the Sandhills, especially in
more fertile and moist soils (Skeen et al. 1993, Ware et al. 1993).
Formerly considered rare, two fish species in the area, Etheostoma mariae
(Pinewoods Darter) and Semotilus lumbee (Sandhills Chub), are now classified
as data deficient (DD) by the International Union for Conservation and Natural
Resources (IUCN 2011). Many of the first-, second-, and even some of the
third-order streams are impounded in their headwaters to form reservoirs for
municipalities, golf courses, and resort communities. The permanently flowing
moderate to swift waters are usually clear, but darkly stained, with white
quartz sand and gravel bottoms. Large coarse woody debris and log jams often
block the channel, and submerged woody debris is also common. Aquatic
macrophytes and macroalgae may be abundant in sun-lit areas (e.g., at bridge
crossings and road and utility line right-of-ways) and include Nuphar luteum
(L.) Sm. (Spatterdock), Potamogeton (pondweed), Orontium aquaticum L.
(Golden Club), Sparganium (bur-reed), Vallisneria (eel grass), Cyperaceae
(sedges), Sagittaria (arrowhead), and Batrachospermum (red alga).
Data collection
The Biological Assessment Unit (BAU) of the NCDWQ sampled each of the
state’s 17 river basins on a 5-year rotation to support the Planning Section’s
Basinwide Water Quality Management Plans (NCDENR 2006a). The Cape Fear
River basin was sampled in 1998 and 2003, the Lumber River basin was sampled
in 2001 and 2006, and the Yadkin River basin was sampled in 2001 and
2012 E.F. Hain, S.A.C. Nelson, B.H. Tracy, and H.I. Cakir 715
2006. Additional sampling by the BAU was conducted as early as 1990. The
stream fish community assessment program only sampled streams that were
wadeable from shoreline to shoreline for a distance of 182 m. A 4-person team
collected all fish at each of 36 individual sites using the 2-pass depletion technique
with 2 backpack electrofishing units and 2 persons netting. The first pass
was conducted upstream. After allowing the water to clear, the second pass was
conducted downstream. The first 50 specimens of each species were identified,
measured, inspected for disease or deformities, and released (after the first 50,
specimens of each species were enumerated and released). Specimens not easily
identified in the field were preserved in 10% formalin and transported to the
BAU laboratory in Raleigh, NC. Fish samples were analyzed by numbers,
species, family, feeding type, and tolerance values. Feeding type and tolerance
values were provided by the NCDWQ (Table 1; NCDENR 2006a). Total number
of individuals per species, number of species, number of families, and
number of individuals within each family were calculated and cross-referenced
with feeding type and tolerance values (NCDENR 2006a).
The BAU has developed a habitat assessment index for North Carolina streams
that is used at each site. This index is used to evaluate the physical habitat of the
visible watershed on a scale from 1–100, where higher numbers indicate higher
habitat quality. The habitat assessment index is calibrated per physiographic
region (Mountains, Piedmont, Sandhills, and Coastal Plains). In the Sandhills,
it uses 7 habitat characteristics for evaluation. These characteristics include
channel modification, amount of in-stream habitat, substrate type, pool variety,
bank stability, light penetration, and riparian zone width (NCDENR 2006b).
Scores greater than 65 generally represent moderate to high-quality habitat sites,
whereas scores less than 65 generally represent low to poor quality habitat sites
(NCDWQ, unpubl. data).
Water-quality analyses were conducted at the time of each fish-community
sample. Measurements included water temperature, specific conductance, pH,
stream flow, water clarity, and dissolved oxygen. All field meters were calibrated
daily before use and as needed at sites (NCDENR 2003). Each site was georeferenced
at the most downstream point of the sample reach, and digital images were
captured at various points within the reach.
Seven criteria were used by BAU’s wadeable stream fish-community assessment
program to assess whether a site met reference conditions (Table 2). These
criteria included the habitat assessment index score, presence of wastewater
treatment plant discharge facilities, land cover, and riparian and channel characteristics.
To qualify as a reference site, the site had to satisfy all 7 criteria in the
order listed (Table 2). Reference sites represented the least-impacted streams and
the overall biological condition of the fish communities that co uld be attained.
Data management and analyses
The 2001 National Land Cover Dataset (NLCD) land-use/land-cover data were
downloaded from the Multi-Resolution Land Characteristics Consortium (MRLC
2012). This dataset provided land-cover and land-use classifications based on a
716 Southeastern Naturalist Vol. 11, No. 4
Table 1. Phylogenetic listing of the freshwater fishes in the Sandhills of North Carolina, including
pollution tolerance ratings and trophic guilds of adults (NCDENR 2006a). Frequencies of occurrence
(Freq.) were calculated from study sample sites. Species with an occurrence frequency of
“N/A” are known to occur in the Sandhills, but were not collect ed at any sample sites.
Pollution Feeding
Family/species Common name Freq. tolerance type
Petromyzontidae
Petromyzon marinus L. Sea Lamprey N/A Intermediate Parasitic
Amiidae
Amia calva L. Bowfin 0.03 Tolerant Piscivore
Anguillidae
Anguilla rostrata Lesueur American Eel 0.72 Intermediate Piscivore
Clupeidae
Dorosoma cepedianum Lesueur Gizzard Shad N/A Intermediate Omnivore
Cyprinidae
Clinostomus funduloides Girard Rosyside Dace 0.03 Intermediate Insectivore
Cyprinella analostana Girard Satinfin Shiner 0.00 Tolerant Insectivore
Cyprinella sp. cf. zanema Thinlip Chub N/A Intolerant Insectivore
Luxilus albeolus Jordan White Shiner 0.03 Intermediate Insectivore
Nocomis leptocephalus Girard Bluehead Chub 0.28 Intermediate Omnivore
Notemigonus crysoleucas Mitchill Golden Shiner 0.17 Tolerant Omnivore
Notropis altipinnis Cope Highfin Shiner 0.14 Intermediate Insectivore
Notropis amoenus Abbott Comely Shiner 0.00 Intermediate Insectivore
Notropis chalybaeus Cope Ironcolor Shiner N/A Intolerant Insectivore
Notropis chiliticus Cope Redlip Shiner 0.03 Intermediate Insectivore
Notropis cummingsae Myers Dusky Shiner 0.67 Intermediate Insectivore
Notropis hudsonius Clinton Spottail Shiner 0.00 Intermediate Omnivore
Notropis maculatus Hay Taillight Shiner N/A Intolerant Insectivore
Notropis petersoni Fowler Coastal Shiner 0.19 Intermediate Insectivore
Notropis scepticus Jordan & Gilbert Sandbar Shiner 0.00 Intermediate Insectivore
Semotilus atromaculatus Mitchill Creek Chub 0.14 Tolerant Insectivore
Semotilus lumbee Snelson & Suttkus Sandhills Chub 0.28 Intolerant Insectivore
Catostomidae
Erimyzon oblongus Mitchill Creek Chubsucker 0.61 Intermediate Omnivore
Erimyzon sucetta Lacepède Lake Chubsucker N/A Intermediate Insectivore
Minytrema melanops Rafinesque Spotted Sucker 0.42 Intermediate Insectivore
Moxostoma collapsum Cope Notchlip Redhorse 0.00 Intermediate Insectivore
Ictaluridae
Ameiurus brunneus Jordan Snail Bullhead 0.03 Intermediate Insectivore
Ameiurus natalis Lesueur Yellow Bullhead 0.47 Tolerant Omnivore
Ameiurus nebulosus Lesueur Brown Bullhead 0.00 Tolerant Omnivore
Ameiurus platycephalus Girard Flat Bullhead 0.33 Tolerant Insectivore
Noturus gyrinus Mitchill Tadpole Madtom 0.17 Intermediate Insectivore
Noturus insignis Richardson Margined Madtom 0.75 Intermediate Insectivore
Esocidae
Esox americanus Gmelin Redfin Pickerel 0.69 Intermediate Piscivore
Esox niger Lesueur Chain Pickerel 0.75 Intermediate Piscivore
Umbridae
Umbra pygmaea DeKay Eastern Mudminnow 0.06 Intermediate Insectivore
2012 E.F. Hain, S.A.C. Nelson, B.H. Tracy, and H.I. Cakir 717
modified Anderson Level-II classification at a 30-m resolution (Lillesand and
Kiefer 1994). The value of using this dataset is that it was well suited for largearea
analyses and provided standardized classifications of land use/land cover
(LULC) across the entire United States. This dataset also allows for subsequent
land-cover-change analyses and spatial-prediction models, incorporating future
Table 1, continued.
Pollution Feeding
Family/species Common name Freq. tolerance type
Aphredoderidae
Aphredoderus sayanus Gilliams Pirate Perch 0.83 Intermediate Insectivore
Amblyopsidae
Chologaster cornuta Agassiz Swampfish 0.06 Intermediate Insectivore
Atherinidae
Labidesthes sicculus Cope Brook Silverside 0.03 Intermediate Insectivore
Fundulidae
Fundulus lineolatus Agassiz Lined Topminnow 0.06 Intermediate Insectivore
Fundulus rathbuni Jordan & Meek Speckled Killifish N/A Intermediate Insectivore
Poecilidae
Gambusia holbrooki Girard Eastern Mosquitofish 0.14 Tolerant Insectivore
Centrarchidae
Acantharchus pomotis Baird Mud Sunfish 0.39 Intermediate Insectivore
Centrarchus macropterus Lacépède Flier 0.08 Intermediate Insectivore
Enneacanthus chaetodon Baird Blackbanded Sunfish 0.06 Intermediate Insectivore
Enneacanthus gloriosus Holbrook Bluespotted Sunfish 0.42 Intermediate Insectivore
Enneacanthus obesus Girard Banded Sunfish N/A Intermediate Insectivore
Lepomis auritus L. Redbreast Sunfish 0.81 Tolerant Insectivore
Lepomis cyanellus Rafinesque Green Sunfish 0.00 Tolerant Insectivore
Lepomis gibbosus L. Pumpkinseed 0.28 Intermediate Insectivore
Lepomis gulosus Cuvier Warmouth 0.61 Intermediate Insectivore
Lepomis macrochirus Rafinesque Bluegill 0.61 Intermediate Insectivore
Lepomis marginatus Holbrook Dollar Sunfish 0.53 Intermediate Insectivore
Lepomis microlophus Günther Redear Sunfish 0.11 Intermediate Insectivore
Lepomis punctatus Valenciennes Spotted Sunfish 0.06 Intermediate Insectivore
Micropterus punctulatus Rafinesque Spotted Bass 0.06 Intermediate Piscivore
Micropterus salmoides Lacepède Largemouth Bass 0.39 Intermediate Piscivore
Pomoxis nigromaculatus Lesueur Black Crappie 0.03 Intermediate Piscivore
Percidae
Etheostoma flabellare Rafinesque Fantail Darter N/A Intermediate Insectivore
Etheostoma fusiforme Girard Swamp Dater N/A Intermediate Insectivore
Etheostoma mariae Fowler Pinewoods Darter 0.25 Intolerant Insectivore
Etheostoma olmstedi Storer Tessellated Darter 0.75 Intermediate Insectivore
Etheostoma serrifer Hubbs & Cannon Sawcheek Darter 0.36 Intolerant Insectivore
Perca flavescens Mitchill Yellow Perch 0.11 Intermediate Piscivore
Percina crassa Jordan and Brayton Piedmont Darter 0.17 Intolerant Insectivore
Elassomatidae
Elassoma evergladei Jordan Everglades Pygmy N/A Intermediate Insectivore
Sunfish
Elassoma zonatum Jordan Banded Pygmy 0.17 Intermediate Insectivore
Sunfish
718 Southeastern Naturalist Vol. 11, No. 4
changes, to be based on similar datasets. Resulting models can be updated as future
NLCD datasets become available. Light detection and ranging (LiDAR) data
were downloaded from the NC Floodplain Mapping Program (NC Floodmaps
2012), as well as from the NC Department of Transportation (NCDOT 2012).
Elevation data derived from LiDAR have been used in hydrologic modeling and
to produce highly accurate hydrologic maps (Colson 2006, Wehr and Lohr 1999).
The high-resolution digital elevation models (DEM) produced from LiDAR data
were ideal for topography-based watershed delineations (Thompson et al. 2001).
Python scripting language was used to organize the geoprocessing model.
Generally, Python called functions from ArcGIS (ESRI 2006) and looped the functions
in a specified order on each sample site. Python was also used to organize and
search through the ArcGIS personal geodatabase and Microsoft Windows folder
structure. The advantage of Python was that it did not require specialized computer
programming skills to use, and allowed us to repeat the model as needed, and to adjust
the details of the functions (Karssenberg et al. 2007).
The geoproccessing model delineated contributing watersheds for each
sample site, extracted the NLCD land-use/land-cover data for each watershed,
and identified any discharge-permit sites that may have been within the watershed.
The watershed delineations were produced using the hydrology tools in the
spatial analyst toolbox of ArcToolbox 9.2 and 6-m resolution LiDAR data. The
results of the geoprocessing model determined whether a sample site met reference
criteria or not.
The NCDWQ considered sites to meet reference conditions if they met each
of 7 criteria (Table 2). Because portions of the Sandhills are still heavily forested,
we used professional judgment to increase the land-use criteria to ≥75% forested.
The NC NLCD data contained 16 land-use classes; 15 of these occurred in the
Table 2. List of criteria for identifying reference streams in the North Carolina Sandhills (NCDENR
2006b).
Criterion Qualification
Habitat Total habitat score ≥ 65.
NPDES dischargers No NPDES dischargers ≥ 0.01 MGD above the site or if there are
small dischargers (≈≤0.01 MGD), the dischargers are more than
one mile upstream.
Percent urbanization less than 10% of the watershed is urban or residential areas.
Percent forested ≥70% of the watershed is forested or in natural vegetation.
Channel incision At the site, the stream is not incised beyond natural condition s.
Riparian zone integrity No breaks in the riparian zones or, if there are breaks, the breaks are
rare.
Riparian zone width Coastal Plain/Sandhills stream’s width of the riparian zone along both
banks is ≥18 m.
Exception 1 If the site satisfied Criteria 1–6, except one of the two riparian widths
was less than one unit optimal, then the site still qualified as a reference
site.
Exception 2 If the site satisfied Criteria 1–3 and 5–7, but the percentage of the
watershed in forest or natural vegetations was ≥60% (rather than
≥70%), then the site still qualified as a reference site.
2012 E.F. Hain, S.A.C. Nelson, B.H. Tracy, and H.I. Cakir 719
Sandhills. Forested area was calculated by combining the deciduous forest, evergreen
forest, mixed forest, shrub/scrub, grassland/herbaceous, woody wetland,
and emergent herbaceous wetlands classes. Urbanized area was calculated by
combining the developed open space, developed low intensity, developed medium
intensity, and developed high intensity classes.
Forty-three candidate fish metrics were calculated for each sample site. Candidate
metrics were chosen based on their inclusion in Karr’s original IBI (Karr
1981), the North Carolina IBI currently used by NCDENR (2006b), Paller’s et al.
(1996) South Carolina Coastal Plain IBI, or found in a survey of the IBI literature
(Breine et al. 2004, Hughes et al. 2004, Karr 1991, McCormick et al. 2001, Paller
et al. 1996, Pirhalla 2004, Whittier et al. 2007, Zampell and Bunnell 1998).
All statistical analyses were performed using SAS 9.1 (SAS 2010). Summary
statistics of IBI metrics, including mean, standard deviation, median, and the 5th,
10th, 25th, 75th, and 90th percentiles were produced for the entire dataset, as well
as for only reference and non-reference sites. To identify fish community metrics,
chemical variables, and individual fish species that differed between reference
and non-reference sites, we used the Kruskal-Wallis test, a non-parametric analogue
to the one-way analysis of variance test performed on ranked data (Paller
et al. 1996, Sokal and Rohlf 1995; Appendix 1).
The IBI scale ranged from 0–100 to follow the more familiar decimal system
and provide easier comparison to other biologic and habitat evaluations, as opposed
to Karr’s original 12–60 scale (Hughes et al. 1998, Karr 1981, Minns et al.
1994). Scores for the individual metrics were produced following McCormick et
al. (2001). Metrics were either positively (positive scoring), or negatively (negative
scoring) correlated with reference conditions. For positive-scoring metrics,
a given site received a score of 0 if its value was less than the 5th percentile of
non-reference sites. A site received a score of 10 if its value was above the 50th
percentile of reference sites. Negative-scoring metrics received a 0 if its value
was greater than the 90th percentile of non-reference sites and a 10 if less than
the 50th percentile of reference sites (Hughes et al. 1998, McCormick et al.
2001, Minns et al. 1994, Whittier et al. 2007). For positive and negative-scoring
metrics, the values between 0 and 10 were linearly interpolated for each metric.
This provided a scale of metric values that corresponded to each whole number
between 0 and 10 (Table 3). Scores for each metric were then assigned based on
each sample’s metric values.
Classes for the IBI were established by summarizing the final scores of all
samples (n = 55). Any site with a final score greater than the 90th percentile of
all sites was rated “excellent”, scores between the 50th– 90th percentile of all sites
were rated as “good”, scores between the 10th–50th percentiles of all sites were rated
“good-fair”, scores between the 5th and 10th percentiles of all sites were rated “fair”,
and all final scores less than the 5th percentile were rated “poor.” Final IBI scores
were regressed against watershed land-use classes derived from the geoprocessing
model, using the Akaike information criterion (AIC) model selection method
(Akaike 1974).
720 Southeastern Naturalist Vol. 11, No. 4
Table 3. Proposed Index of Biotic Integrity scoring criteria for the North Carolina Sandhills. Individual metrics receive scores between 1–10. These scores
are multiplied by the coefficient 0.667 and then summed to produ ce a final score ranging from 0–100.
Score
0 if greater than 1 2 3 4 5 6 7 8 9 10 if less than
Negative metrics
Total no. of fish in sample 250.50 228.67 206.83 185.00 163.17 141.33 119.50 97.67 75.83 54.00 54.00
Total species 18.00 17.11 16.22 15.33 14.44 13.56 12.67 11.78 10.89 10.00 10.00
No. of tolerant individuals 45.00 40.33 35.67 31.00 26.33 21.67 17.00 12.33 7.67 3.00 3.00
No. of tolerant species 3.50 3.22 2.94 2.67 2.39 2.11 1.83 1.56 1.28 1.00 1.00
No. of Cyprinidae species 4.00 3.67 3.33 3.00 2.67 2.33 2.00 1.67 1.33 1.00 1.00
No. of Cyprinidae individuals 96.00 86.44 76.89 67.33 57.78 48.22 38.67 29.11 19.56 10.00 10.00
Percent of individuals as tolerant 34.17 31.02 27.88 24.74 21.60 18.45 15.31 12.17 9.03 5.88 5.88
No. of Centrarchidae individuals 84.00 75.44 66.89 58.33 49.78 41.22 32.67 24.11 15.56 7.00 7.00
No. of insectivore individuals 223.50 204.11 184.72 165.33 145.94 126.56 107.17 87.78 68.39 49.00 49.00
No. of insectivorous Cyprinidae individuals 89.00 80.22 71.44 62.67 53.89 45.11 36.33 27.56 18.78 10.00 10.00
Specific conductance (μS/cm) 59.50 55.22 50.94 46.67 42.39 38.11 33.83 29.56 25.28 21.00 21.00
pH (s.u.) 6.70 6.56 6.41 6.27 6.12 5.98 5.83 5.69 5.54 5.40 5.40
Positive metrics
Proportion of individuals as intolerant 0.00 0.68 1.37 2.05 2.74 3.42 4.10 4.79 5.47 6.15 6.15
Aphredoderus sayanus Gilliams 0.00 0.44 0.89 1.33 1.78 2.22 2.67 3.11 3.56 4.00 4.00
Etheostoma serrifer Hubbs and Cannon 0* - - - - - - - - - 0
*Score = 0 if E .serrifer absent from population, 10 if present.
2012 E.F. Hain, S.A.C. Nelson, B.H. Tracy, and H.I. Cakir 721
Results
The geoprocessing model identified 11 out of 36 sample sites (15 out of 55
samples) as meeting reference conditions. We identified 11 fish-community
metrics, 2 water-quality variables (pH and specific conductance) and 9 fish species’
counts that were significantly different (P < 0.05) between reference and
non-reference sites (Appendix 1). The significant fish-community metrics were
related to species richness and composition (n = 8), trophic composition (n = 2),
and fish abundance (n = 1) (Appendix 1). Of these11 metrics, only the proportion
of individuals as intolerant was found to be positively correlated with reference
conditions (positive scoring). No other community metric tested as statistically
significant (Appendix 1).
The species with significantly different abundances between reference and
non-reference sites included Anguilla rostrata Lesueur (American Eel), Aphredoderus
sayanus Gilliams (Pirate Perch), Lepomis auritus L. (Redbreast Sunfish),
Etheostoma olmstedi Storer (Tessellated Darter), Etheostoma serrifer Hubbs and
Cannon (Sawcheek Darter), Minytrema melanops Rafinesque (Spotted Sucker),
Ameiurus platycephalus Girard (Flat Bullhead), Lepomis macrochirus Rafinesque
(Bluegill) and Enneacanthus gloriosus Holbrook (Bluespotted Sunfish).
Of these species, only Pirate Perch and Sawcheek Darter were found to be positive
scoring. In order for the model development to remain consistent with IBI
procedures, which have traditionally focused on community metrics rather than
individual species, we included only positive-scoring species in the final IBI
(Karr 1981). Our resulting model included all 11 community, 2 water-quality, and
2 positive-scoring species metrics (Table 3). Of these metrics, 3 were positivescoring
and 12 were negative-scoring.
The final IBI contained 15 metrics. Final scores for each metric were multiplied
by a coefficient of 0.667, so that the final IBI score for each site is within
a range of 0–100. Sample sites in the Sandhills received final IBI scores ranging
from 15.3 to 99.3. The median score was 68 and the mean score was 65.7
with a standard deviation of 20.0. Sites were further classified as either “excellent”,
“good”, “good-fair”, “fair”, or “poor” based on the distribution of IBI
scores for all samples. Previous IBIs have used only reference sites for final
classes (McCormick 2001, NCDENR 2006a). However, because the model
produced a small number of reference samples (n = 15), the entire dataset was
used. This system resulted in 6 “excellent” sites, 22 “good” sites, 21 “goodfair”
sites, 3 “fair” sites, and 3 “poor” sites (Fig. 2). All “poor”, “fair”, and
“excellent” sites were located in either the Yadkin or Cape Fear River basins.
No “poor,” “fair,” or “excellent” rated sites were located in the Lumber River
basin (Fig. 3).
The top regression model selected by AIC, using watershed land-use classes,
was highly correlated with the final IBI scores (R2 = 0.7762, adjusted-R2 =
0.7189). The model selected 11 of the 15 NLCD land-use classes as variables, of
which 8 were significant: “low-intensity developed”, “barren land”, “deciduous
forest”, “evergreen forest”, “mixed forest”, “shrub/scrub”, “cultivated crops”,
and “emergent herbaceous wetlands.”
722 Southeastern Naturalist Vol. 11, No. 4
Crane Creek in Moore County (Cape Fear River basin) scored consistently
low at 4 sample sites and 5 total samples (Fig. 3). This watershed borders the Triassic
Basin in Lee, Harnett, and Moore counties, and it is possible that it should
Figure 3. Fish community sample sites by IBI classification.
Figure 2. Histogram of sample sites’ IBI classification grouped by reference/non-reference.
2012 E.F. Hain, S.A.C. Nelson, B.H. Tracy, and H.I. Cakir 723
be rated with NCDWQ’s Cape Fear Basin Piedmont criteria. Buffalo Creek, also
in Moore County and the Cape Fear River basin, rated “excellent” in 1998 and
in 2003. These 2 samples were the highest rated sites in the dataset (99.33 and
95.33, respectively). Marks Creek in Richmond County in the Yadkin basin received
the lowest rating (15.33) in 2006.
Discussion
Using 15 fish metrics that tested significantly (P < 0.05) between reference
and non-reference sites, this study produced IBI scores for 55 samples on a scale
from 0–100. There was no indication that any of the 3 river basins in Sandhills
consistently rated high or low, although the Lumber River basin did not receive
exceptionally high or low ratings. There was no individual stream whose ratings
fluctuated drastically between different sample sites along the stream or repeated
samples at the same location. Regression analysis indicates that the IBI scoring
technique is highly correlated with watershed land-use conditio ns.
The results of this study demonstrate that the Sandhills region of North
Carolina exhibits a lower abundance of fish and species in undisturbed streams
than in disturbed streams. Streams in the Sandhills that are impacted by anthropogenic
activities also have increased fish abundances and modified fish
assemblages. Low natural species richness and resource availability may have
played a role in preventing large numbers of colonizing species from establishing
populations in the region’s undisturbed streams (Levine 2000, Maron
and Marler 2008, Tilman 2004). Alternatively, faunal homogenization resulting
from intentional and non-intentional introductions could be driving the
increase in species richness at impacted sites (Rahel 2000). Twelve of the 15
significant (P < 0.05) metrics presented in this study were negative scoring,
meaning we would expect to find lower numbers in less-disturbed streams (Table
4; McCormick et al. 2001). Thus, a Sandhills fish assemblage exhibiting
low abundance and richness is an indication of high biological integrity. This
result is contrary to Karr’s original IBI (Karr 1981), and supports the NCDWQ’s
assertion that the Piedmont-derived IBI is not appropriate for evaluating
Sandhills fish communities. Streams with high IBI scores in the Sandhills
may require further evaluation to distinguish between high-quality streams and
those with low abundance and diversity due to habitat degradation or waterquality
problems. This follow-up may be accomplished by comparing fish data
with macroinvertebrate, land-use, and habitat-assessment data.
The South Carolina Sandhills IBI (Paller 1996) and the NCDWQ Piedmont
IBI (NCDENR 2006a) gave higher scores to streams with greater fish abundance
and species richness. For both of these IBI’s, “% tolerant fish” and “% diseased
fish” were considered negative-scoring metrics. The South Carolina Sandhills
IBI also considered “% sunfish” and “% generalized insectivores” as positivescoring
metrics. However, the majority of metrics for both of these IBI’s were
considered positive scoring (higher values in undisturbed sites). Neither IBI
indicates the pattern shown in this study of higher fish abundance and species
richness in disturbed sites.
724 Southeastern Naturalist Vol. 11, No. 4
Further validation of this research may include repeating the Kruskal-Wallis
test on additional datasets as they become available (Paller et al. 1996). Numerous
studies have shown that fish IBIs are most useful when used in conjunction
with ratings based on other taxonomic groups (Johnson et al. 2006, O’Connor et
al. 2000). The NCDWQ also monitors benthic macroinvertebrates, often at the
same fish-community sites. A detailed comparison of fish and benthic macroinvertebrate
communities may assist in further refinements to both rating systems,
as well as provide insights into particular environmental stressors affecting the
Sandhills (O’Connor et al. 2000, Paller 2001).
Other future work should include quantitative analysis of metric responsiveness
across a gradient of anthropogenic disturbance, as opposed to the categorical
disturbance used in this study (Hughes et al. 2004, McCormick et al. 2001, Whittier
et al. 2007). Disturbance gradients can then be used to test correlation of
each metric to disturbance (Teels and Adamus 2002). This type of analysis can
help eliminate metrics strongly correlated with natural gradients by testing them
against watershed and in-stream variables such as pH, specific conductance,
substrate type, and canopy (Hughes et al. 2004, McCormick et al. 2001). Finally,
increasing reference sites will improve all future analyses. This study’s dataset
contained 55 samples at 36 sample sites, of which only 15 samples were considered
reference samples (11 out of 36 sample sites). As the NCDWQ will continue
to sample streams in the Sandhills on a 5-year rotation (NCDENR 2006a), increasing
the number of reference sites should be prioritized. Additional data from
undisturbed sites will allow for stronger statistical analyses to be performed, as
described above, as well as increase our understanding of disturbance responses
specific to the Sandhills.
This study utilized a geoprocessing model, incorporating python scripting
and ArcGIS, that uses sample sites, land-use data, digital elevation models, and
other spatial data such as pollution-discharge permits, and in-stream habitat assessments
to categorize sample streams as either disturbed or undisturbed. The
geoprocessing model streamlines the reference-stream identification process, and
provides an increased opportunity for monitoring agencies, such as the NCDWQ,
to select reference sites based on larger datasets in the future. This feature is
valuable because the ability to identify reference sites from larger datasets helps
ensure that future area-specific statistical analyses are based on comprehensive
representative samples. The availability of a semi-automated model allows the
NCDWQ to choose whether to rate streams based on the results from the original
55 samples, or to fully analyze larger datasets once additional sampling has
occurred. This flexibility provides an opportunity to track changes in reference
conditions, such as increased or decreased homogeneity between reference and
non-reference sites, or the disappearance of reference sites due to land conversions.
Additionally, by updating land-use datasets as they become available, any
changes in the fish assemblages can be recorded through time.
Conclusion
Using a standardized and partially automated index of biotic integrity model,
we were able to classify NCDWQ fish-community-assemblage samples on a
2012 E.F. Hain, S.A.C. Nelson, B.H. Tracy, and H.I. Cakir 725
scale of 0–100 and as either “excellent”, “good”, “good-fair”, “fair”, or “poor”.
Although this study did not distinguish between natural and anthropogenic disturbance
gradients, significant metrics were identified that are relevant in the
assessment of water quality in the Sandhills region of North Carolina based on
the resident fish species. In addition to the more stringent data analysis described
above, we recommend that validation be repeated on additional samples as they
become available. The model approach taken here may also be valuable in developing
additional indices across the ecoregions of North Carolina as well as with
other taxonomic groups. The results of this study should be used in addition to
other water-quality indices to achieve the most valuable assessment of the state’s
flowing waters.
Acknowledgments
We thank the Center for Earth Observation at North Carolina State University for
providing computational resources and James F. Gilliam of the Department of Biology
for his valuable comments. This work is not a product of the United States Government
or the United States Environmental Protection Agency, and H.I. Cakir has not performed
this work in any governmental capacity. The views expressed are those of the authors
only and do not necessarily represent those of the United State s or the US EPA.
Literature Cited
Akaike, H. 1974. New look at statistical-model identification. IEEE Transactions on
Automatic Control Ac19:716–723.
Bozzetti, M., and U.H. Schulz. 2004. An index of biotic integrity based on fish assemblages
for subtropical streams in southern Brazil. Hydrobiologi a 529:133–44.
Breine, J., I. Simoens, P. Goethals, P. Quataert, D. Ercken, C. Van Liefferinghe, and C.
Belpaire. 2004. A fish-based index of biotic integrity for upstream brooks in Flanders
(Belgium). Hydrobiologia 522:133–48.
Colson, T.P. 2006. Stream network delineation from high-resolution digital elevation
models. Ph.D Dissertation. North Carolina State University, Raleigh. NC. 241 pp.
ESRI 2006. ArcGIS Desktop: Release 9.1. Environmental Systems Research Institute,
Redlands, CA.
Griffith, G., J. Omernik, and J. Comstock. 2002. Ecoregions of North Carolina regional
descriptions. EPA GR-3-02. US Environmental Protection Agency, National Health
and Environmental Effects Research Laboratory, Corvallis, OR.
Hawkins, C.P., R.H. Norris, J.N. Hogue, and J.W. Feminella. 2000. Development and
evaluation of predictive models for measuring the biological integrity of streams.
Ecological Applications 10:1456–1477.
Heiskary, S., J. Lindbloom, and C.B. Wilson. 1994. Detecting water-quality trends with
citizen volunteer data. Journal of Lake and Reservoir Managemen t 9:4–9.
Hughes, R.M., P.R. Kaufmann, A.T. Herlihy, T.M. Kincaid, L. Reynolds, and D.P. Larsen.
1998. A process for developing and evaluating indices of fish assemblage integrity.
Canadian Journal of Fisheries and Aquatic Sciences 55:1618–1631.
Hughes, R.M., S. Howlin, and P.R. Kaufmann. 2004. A biointegrity index (IBI) for
coldwater streams of Western Oregon and Washington. Transactions of the American
Fisheries Society 133:1497–1515.
International Union for Conservation of Nature and Natural Resources (IUCN). 2011.
Red List of Threatened Species, 2011.2. Available online at http://www.iucnredlist.
org/. Accessed 4 June 2012.
726 Southeastern Naturalist Vol. 11, No. 4
Jacqmain, E.I., R.H. Jones, and R.J. Mitchell. 1999. Influences of frequent cool-season
burning across a soil moisture gradient on oak community structure in Longleaf Pine
ecosystems. The American Midland Naturalist 141:85–100.
Jennings, D.B., and S.T. Jarnagin. 2002. Changes in anthropogenic impervious surfaces,
precipitation, and daily streamflow discharge: A historical perspective in a mid-
Atlantic subwatershed. Landscape Ecology 17:471–489.
Johnson, R.K., D. Hering, M.T. Furse, and R.T. Clarke. 2006. Detection of ecological
change using multiple organism groups: Metrics and uncertainty. Hydrobiologia
566:115–137.
Karr, J.R. 1981. Assessment of biotic integrity using fish communities. Fisheries 6:21–27.
Karr, J.R. 1991. Biological integrity: A long-neglected aspect of water resource management.
Ecological Applications 1:66–84.
Karr, J.R., and Chu E.W. 1997. Biological monitoring: Essential foundation for ecological
risk assessment. Human and Ecological Risk Assessment 3:993–1004.
Karssenberg, D., K. De Jong, and J. Van Der Kwast. 2007. Modelling landscape dynamics
with Python. International Journal of Geographical Information Science 21:483–95.
Kerans, B.L., and J.R. Karr. 1994. A benthic index of biotic integrity (B-IBI) for rivers
of the Tennessee Valley. Ecological Applications 4:768–85.
Kerr, M., E. Ely, V. Lee, and A. Mayio. 1994. A profile of volunteer environmental monitoring:
National survey results. Journal of Lake and Reservoir Management 9:1–4.
Landers, J.L., D.H. Van Lear, and W.D. Boyer. 1995. The Longleaf Pine forests of the
Southeast: Requiem or renaissance? Journal of Forestry 93:39–44 .
Levine, J.M. 2000. Species diversity and biological invasions: Relating local process to
community pattern. Science 288:852–854.
Lillesand, T.M., and R.W. Kiefer. 1994. Remote Sensing and Image Interpretation. John
Wiley and Sons, Inc., New York, NY. 768 pp.
Lougheed, V.L., and P. Chow-Fraser. 2002. Development and use of a zooplankton index
of wetland quality in the Laurentian Great Lakes basin. Ecological Applications
12:474–486.
Maron, J.L., and M. Marler. 2008. Effects of native species diversity and resource additions
on invader impact. American Naturalist 172:S18–S33.
McCormick, F.H., R.M. Hughes, P.R. Kaufmann, D.V. Peck, J.L. Stoddard, and A.T.
Herlihy. 2001. Development of an index of biotic integrity for the Mid-Atlantic Highlands
Region. Transactions of the American Fisheries Society 130:857–877.
Minns, C.K., V.W. Cairns, R.G. Randall, and J.E. Moore. 1994. An index of biotic integrity
(IBI) for fish assemblages in the littoral zone of Great Lakes’ areas of concern.
Canadian Journal of Fisheries and Aquatic Sciences 51:1804–1822.
Multi-Resolution Land Characteristics Consortium (MRLC). 2012. National Land Cover
Database 2001 (NLCD2001). Available online at http://www.mrlc.gov/nlcd01_data.
php. Accessed 4 June 2012.
North Carolina Department of Environment and Natural Resources (NCDENR). 2002.
Basinwide assessment report, Lumber River Basin. Division of Water Quality, Water
Quality Section, Environmental Sciences Branch, Raleigh, NC.
NCDENR. 2003. Intensive Survey Unit standard operating procedures. Division of Water
Quality, Water Quality Section, Environmental Sciences Branch, Raleigh, NC. 29
August 2003.
NCDENR. 2004. Basinwide assessment report, Cape Fear River Basin. Division of Water
Quality, Water Quality Section, Environmental Sciences Branch, Raleigh, N C.
2012 E.F. Hain, S.A.C. Nelson, B.H. Tracy, and H.I. Cakir 727
NCDENR. 2006a. Standard operating procedure biological monitoring, stream fish
community assessment program. Environmental Sciences Section, Division of Water
Quality, Raleigh, NC.
NCDENR. 2006b. Basinwide assessment report, Neuse River Basin. Environmental Sciences
Section, Division of Water Quality, Raleigh, NC.
North Carolina Department of Transportation (NCDOT). 2012. GIS contour and elevation
data. North Carolina Department of Transportation. Available online at http://www.ncdot.
gov/it/gis/DataDistribution/ContourElevationData/. Accessed 4 June 2012.
North Carolina Floodplain Mapping Program (NC Floodmaps). 2012. LiDAR DEM
20. Available online at http://floodmaps.nc.gov/fmis/Download.aspx. Accessed 4
June 2012.
Obrecht, D.V., M. Milanick, B.D. Perkins, D. Ready, and J.R. Jones. 1998. Evaluation
of data generated from lake samples collected by volunteers. Journal of Lake and
Reservoir Management 14:21–27.
O’Connell, T.J., L.E. Jackson, and R.P. Brooks. 2000. Bird guilds as indicators of ecological
condition in the central Appalachians. Ecological Applications 10:1706–1721.
O’Connor, R.J., T.E. Walls, and R.M. Hughes. 2000. Using multiple taxonomic groups
to index the ecological condition of lakes. Environmental Monitoring and Assessment
61:207–228.
Paller, M.H. 1994. Relationships between fish assemblage structure and stream order in
South Carolina Coastal Plain streams. Transactions of the American Fisheries Society
123:150–161.
Paller, M.H. 2001. Comparison of fish and macroinvertebrate bioassessments from
South Carolina coastal plain streams. Aquatic Ecosystem Health and Management
4:175–186.
Paller, M.H., M.J.M. Reichert, and J.M. Dean. 1996. Use of fish communities to assess
environmental impacts in South Carolina Coastal Plain streams. Transactions of the
American Fisheries Society 125:633–644.
Paul, M.J., and J.L. Meyer. 2001. Streams in the urban landscape. Annual Review of
Ecology and Systematics 32:333–365.
Pirhalla, D.E. 2004. Evaluating fish-habitat relationships for refining regional indexes of
biotic integrity: Development of a tolerance index of habitat degradation for Maryland
stream fishes. Transactions of the American Fisheries Society 133:144–159.
Rahel, F.J. 2000. Homogenization of fish faunas across the United States. Science
288:854–856.
SAS Institute (2010) Version 9.1 of the SAS system for windows. Cary , NC.
Schueler, T.R., 1994. The importance of imperviousness. Watershed Protection Techniques
1:100–111.
Schueler, T. and R. Clayton. 1997. Impervious cover as an urban stream indicator and
a watershed management tool. Pp. 513–529, In L.A. Roesner, E. Shaver, and R.R.
Horner (Eds). Effects of Watershed Development and Management on Aquatic Ecosystems,
Proceedings of an Engineering Foundation Conference. American Society of
Civil Engineers, New York, NY. 608 pp.
Skeen, J.N., P.D. Doerr, and D.H. van Lear. 1993. Oak-hickory-pine forest. In W.H. Martin,
S.G. Boyce, and A.C. Echternacht (Eds.). Biodiversity of the Southeastern United
States: Upland Terrestrial Communities. John Wiley and Sons, Inc., New York, NY.
502 pp.
728 Southeastern Naturalist Vol. 11, No. 4
Sokal, R.R., and F.J. Rohlf. 1995. Biometry: The Principles and Practice of Statistics in
Biological Research. 3rd Edition. W.H. Freeman, New York, NY. 880 pp.
Stoddard, J.L., D.P. Larsen, C.P. Hawkins, R.K. Johnson, and R.H. Norris. 2006. Setting
expectations for the ecological condition of streams: The concept of reference condition.
Freshwater Bioassessment 16:1267–1276.
Teels, B.M., and P. Adamus. 2002. Methods for evaluating wetland condition: Developing
metrics and indices of biological integrity. EPA-822-R-02-016, Office of Water,
US Environmental Protection Agency, Washington, DC.
Thompson, J.A., J.C. Bell, and C.A. Butler. 2001. Digital elevation model resolution:
Effects on terrain attribute calculation and quantitative soil-landscape modeling.
Geoderma 100:67–89.
Tilman, D. 2004. Niche tradeoffs, neutrality, and community structure: A stochastic
theory of resource competition, invasion, and community assembly. Proceedings of
the National Academy of Sciences 101:10854–10861.
US Environmental Protection Agency (US EPA). 1996. Biological criteria. Technical
guidance for streams and small rivers. EPA 822-B-96-001. Office of Science and
Technology, Office of Water, Washington, DC. 162 pp.
US EPA. 1999. Rapid bioassessment protocols for use in wadeable streams and rivers.
Second Edition. EPA 841-B-99-002. Office of Water, Washington, DC. Unpaginated.
Wallace, J.B., J.W. Grubaugh, and M.R. Whiles. 1996. Biotic indices and stream ecosystem
processes: Results from an experimental study. Ecological Applications
6:140–151.
Wang, L., J. Lyons, P. Kanehl, and R. Bannerman. 2001. Impacts of urbanization on
stream habitat and fish across multiple spatial scales. Environmental Management
28:255–266.
Ware, S., C. Frost, and P.D. Doerr. 1993. Southern mixed hardwood forest: The former
Longleaf Pine forest. In W.H. Martin, S.G. Boyce, and A.C. Echternacht (Eds.). Biodiversity
of the Southeastern United States: Lowland Terrestrial Communities. John
Wiley and Sons, Inc, New York, NY. 528 pp.
Wehr, A. and U. Lohr. 1999. Airborne laser scanning: Introduction and overview. ISPRS
Journal of Photogrammetry and Remote Sensing 54:68–82.
Whittier, T.R., R.M. Hughes, G.A. Lomnicky, and D.V. Peck. 2007. Fish and amphibian
tolerance values and an assemblage tolerance index for streams and rivers in the
western USA. Transactions of the American Fisheries Society 136:254–271.
Winner, M.D., Jr., and R.W. Coble. 1996. Hydrogeologic framework of the North Carolina
coastal plain. US Geological Survey Professional Paper 1404-I. Washington, DC.
Zampella, R.A., and J.F. Bunnell. 1998. Use of reference-site fish assemblages to assess
aquatic degradation in pinelands streams. Ecological Applications 8:645–658.
2012 E.F. Hain, S.A.C. Nelson, B.H. Tracy, and H.I. Cakir 729
Appendix 1. Fish-community metrics that are significantly different (P < 0.05) between reference and non-reference streams in the North Carolina Sandhills.
*Metric is significantly different (P < 0.05) between reference and non-reference sites, determined by Kruskal-Wallis test.
Non-reference Reference
Metric Mean SD Min Max Mean SD Min Max
Abundance and condition
Total no. of fish* 111.68 97.02 13.00 489.00 58.27 33.89 14.00 118.00
Proportion of individuals as diseased 0.09 0.33 0.00 1.85 0.24 0.73 0.00 2.74
Reproductive function
Proportion of species with multiple age groups 40.93 14.00 13.00 71.00 39.67 15.61 14.00 63.00
Species richness and compositions
Total species* 13.43 3.54 7.00 21.00 10.53 3.54 6.00 17.00
No. of tolerant individuals* 17.58 26.36 0.00 130.00 4.13 5.07 0.00 19.00
No. of tolerant species* 2.05 1.20 0.00 5.00 1.13 0.74 0.00 2.00
Proportion of individuals as tolerant* 13.99 11.87 0.00 40.63 7.07 7.26 0.00 26.32
No. of intolerant individuals 3.25 3.75 0.00 15.00 4.87 5.13 0.00 21.00
No. of intolernt species 0.98 0.92 0.00 3.00 1.00 0.53 0.00 2.00
Proportion of Individuals as intolerant* 5.94 10.36 0.00 53.33 11.14 12.54 0.00 38.89
No. of intermediately tolerant individuals 90.85 82.42 6.00 457.00 49.27 32.10 10.00 109.00
No. of intermediately tolerant species 10.40 3.01 5.00 16.00 8.40 2.85 5.00 14.00
Proportion of individuals as intermediately tolerant 80.07 13.26 40.00 95.61 81.79 14.88 52.63 94.37
No. of Noturus individuals 8.10 13.78 0.00 80.00 4.80 8.45 0.00 33.00
No. of Noturus species 0.93 0.53 0.00 2.00 0.73 0.59 0.00 2.00
Proportion of individuals as Noturus 8.38 10.23 0.00 48.48 6.70 11.33 0.00 45.21
No. of Cyprinidae individuals* 44.23 55.21 0.00 242.00 17.73 20.94 0.00 65.00
No. of Cyprinidae species* 2.05 1.18 0.00 5.00 1.07 1.03 0.00 4.00
Proporton of individuals as Cyprinidae 34.66 23.13 0.00 92.02 29.20 24.10 0.00 65.00
No. of Centrarchidae individuals* 34.30 63.12 0.00 377.00 13.07 20.99 2.00 87.00
No. of Centrarchidae species 3.53 1.72 0.00 8.00 2.73 1.28 1.00 5.00
Proportion of individuals as Centrarchidae 26.46 22.07 0.00 77.10 19.43 17.51 5.00 73.73
No. of Percidae individuals 9.43 8.73 0.00 39.00 6.33 6.68 0.00 22.00
No. of Percidae species 1.58 0.87 0.00 3.00 1.27 0.80 0.00 3.00
730 Southeastern Naturalist Vol. 11, No. 4
Non-reference Reference
Metric Mean SD Min Max Mean SD Min Max
Proportion of individuals as Percidae 12.56 13.13 0.00 60.00 11.58 11.61 0.00 40.74
No. of Catostomidae individuals 3.38 4.93 0.00 20.00 2.53 6.31 0.00 25.00
No. of Catostomidae species 1.03 0.77 0.00 2.00 0.67 0.62 0.00 2.00
Proportion of individuals as Catostomidae 3.96 5.46 0.00 24.14 4.41 7.63 0.00 30.12
Total no. of exotic individuals 0.35 0.53 0.00 2.00 0.07 0.26 0.00 1.00
Proportion of individuals as exotic 0.49 0.91 0.00 3.92 0.18 0.68 0.00 2.63
No. of native individuals 111.33 97.03 13.00 488.00 58.20 33.93 14.00 118.00
Proportion of individuals as native 99.51 0.91 96.08 100.00 99.82 0.68 97.37 100.00
Total no. of individuals from dominant species 50.05 65.24 4.00 353.00 26.07 19.60 4.00 71.00
Proportion of individuals as dominant species 40.21 15.95 16.91 90.87 43.51 13.40 21.82 65.00
Trophic composition
No. of omnivorous individuals 7.73 11.90 0.00 50.00 5.33 8.62 0.00 26.00
Proportion of individuals as omnivorous 6.31 8.22 0.00 47.54 11.37 17.30 0.00 64.71
No. of piscivorous individual 8.28 7.62 0.00 44.00 6.27 4.23 2.00 17.00
Proportion of individuals as piscivorous 11.00 11.08 0.00 59.46 15.45 15.03 1.82 60.71
No. of insectivorous individuals* 95.68 88.54 8.00 445.00 46.67 32.49 3.00 111.00
Proportion of individuals as insectivorous 82.73 13.58 32.00 98.00 73.13 22.31 18.00 96.00
Proportion of individuals as omnivorous or herbivorous 6.38 8.28 0.00 48.00 11.47 17.32 0.00 65.00
No. of insectivorous Cyprinidae individuals* 39.45 49.71 0.00 242.00 15.47 18.64 0.00 65.00
Proportion of individuals as insectivorous Cyprinidae 31.36 21.17 0.00 92.02 23.83 22.43 0.00 65.00
Fish species
Acantharchus pomotis Baird 0.40 0.90 0.00 4.00 0.53 0.92 0.00 3.00
Ameiurus brunneus Jordan 0.05 0.32 0.00 2.00 0.00 0.00 0.00 0.00
Ameiurus natalis Lesueur 1.00 2.74 0.00 16.00 0.67 0.90 0.00 3.00
Ameiurus nebulosus Lesueur 0.00 0.00 0.00 0.00 0.00 0.00 0.00 0.00
Ameiurus platycephalus Girard* 0.73 1.26 0.00 6.00 0.07 0.26 0.00 1.00
Amia calva L. 0.03 0.16 0.00 1.00 0.00 0.00 0.00 0.00
Anguilla rostrata Lesueur* 2.80 2.41 0.00 9.00 1.00 1.51 0.00 5.00
Aphredoderus sayanus Gilliams* 3.45 5.80 0.00 25.00 6.27 8.42 0.00 35.00
Centrarchus macropterus Lacépède 0.15 0.80 0.00 5.00 0.13 0.52 0.00 2.00
Chologaster cornuta Agassiz 0.08 0.35 0.00 2.00 0.00 0.00 0.00 0.00
Clinostomus funduloides Girard 0.00 0.00 0.00 0.00 0.20 0.77 0.00 3.00
2012 E.F. Hain, S.A.C. Nelson, B.H. Tracy, and H.I. Cakir 731
Non-reference Reference
Metric Mean SD Min Max Mean SD Min Max
Cyprinella analostana Girard 0.00 0.00 0.00 0.00 0.00 0.00 0.00 0.00
Elassoma zonatum Jordan 0.10 0.30 0.00 1.00 0.13 0.35 0.00 1.00
Enneacanthus chaetodon Baird 0.03 0.16 0.00 1.00 0.07 0.26 0.00 1.00
Enneacanthus gloriosus Holbrook* 1.50 5.31 0.00 32.00 1.07 1.39 0.00 5.00
Erimyzon oblongus Mitchill 1.95 3.73 0.00 16.00 2.40 6.32 0.00 25.00
Esox americanus Gmelin 1.43 1.89 0.00 9.00 1.93 1.44 0.00 5.00
Esox niger Lesueur 1.45 1.96 0.00 7.00 2.80 4.11 0.00 16.00
Etheostoma mariae Fowler 1.70 2.88 0.00 10.00 1.93 5.57 0.00 21.00
Etheostoma olmstedi Storer* 5.55 7.10 0.00 39.00 2.47 4.64 0.00 17.00
Etheostoma serrifer Hubbs and Cannon* 0.35 0.86 0.00 3.00 1.73 2.37 0.00 8.00
Fundulus lineolatus Agassiz 0.03 0.16 0.00 1.00 0.87 3.36 0.00 13.00
Gambusia holbrooki Girard 1.00 5.23 0.00 33.00 0.00 0.00 0.00 0.00
Labidesthes sicculus Cope 0.08 0.35 0.00 2.00 0.00 0.00 0.00 0.00
Lepomis auritus L.* 11.03 17.79 0.00 105.00 3.00 4.04 0.00 13.00
Lepomis cyanellus Rafinesque 0.00 0.00 0.00 0.00 0.00 0.00 0.00 0.00
Lepomis gibbosus L. 0.68 1.59 0.00 8.00 0.47 1.81 0.00 7.00
Lepomis gulosus Cuvier 1.33 2.53 0.00 11.00 0.47 0.74 0.00 2.00
Lepomis macrochirus Rafinesque* 15.93 56.63 0.00 353.00 5.60 18.27 0.00 71.00
Lepomis marginatus Holbrook 1.70 3.16 0.00 15.00 1.20 1.70 0.00 5.00
Lepomis microlophus Günther 0.28 1.13 0.00 7.00 0.00 0.00 0.00 0.00
Lepomis punctatus Valenciennes 0.15 0.70 0.00 4.00 0.00 0.00 0.00 0.00
Lepomis sp. 0.00 0.00 0.00 0.00 0.00 0.00 0.00 0.00
Luxilus albeolus Jordan 0.00 0.00 0.00 0.00 1.20 4.65 0.00 18.00
Micropterus punctulatus Rafinesque 0.15 0.95 0.00 6.00 0.13 0.52 0.00 2.00
Micropterus salmoides Lacepède 0.90 2.62 0.00 16.00 0.40 0.91 0.00 3.00
Minytrema melanops Rafinesque* 1.43 2.64 0.00 11.00 0.13 0.35 0.00 1.00
Moxostoma collapsum Cope 0.00 0.00 0.00 0.00 0.00 0.00 0.00 0.00
Nocomis leptocephalus Girard 3.70 9.58 0.00 50.00 2.27 6.54 0.00 24.00
Notemigonus crysoleucas Mitchill 1.08 3.80 0.00 22.00 0.00 0.00 0.00 0.00
Notropis altipinnis Cope 7.50 24.12 0.00 110.00 0.60 2.32 0.00 9.00
Notropis amoenus Abbott 0.00 0.00 0.00 0.00 0.00 0.00 0.00 0.00
732 Southeastern Naturalist Vol. 11, No. 4
Non-reference Reference
Metric Mean SD Min Max Mean SD Min Max
Notropis chiliticus Cope 0.45 2.11 0.00 13.00 0.00 0.00 0.00 0.00
Notropis cummingsae Myers 26.23 41.99 0.00 239.00 12.07 18.30 0.00 65.00
Notropis hudsonius Clinton 0.00 0.00 0.00 0.00 0.00 0.00 0.00 0.00
Notropis petersoni Fowler 1.78 6.18 0.00 37.00 0.00 0.00 0.00 0.00
Notropis scepticus Jordan & Gilbert 0.00 0.00 0.00 0.00 0.00 0.00 0.00 0.00
Noturus gyrinus Mitchill 0.40 1.65 0.00 10.00 0.07 0.26 0.00 1.00
Noturus insignis Richardson 7.70 13.61 0.00 80.00 4.73 8.48 0.00 33.00
Perca flavescens Mitchill 1.40 6.19 0.00 38.00 0.00 0.00 0.00 0.00
Percina crassa Jordan and Brayton 0.43 1.34 0.00 8.00 0.20 0.56 0.00 2.00
Pomoxis nigromaculatus Lesueur 0.10 0.63 0.00 4.00 0.00 0.00 0.00 0.00
Pylodictis olivaris Rafinesque 0.03 0.16 0.00 1.00 0.00 0.00 0.00 0.00
Semotilus atromaculatus Mitchill 2.73 12.73 0.00 77.00 0.40 1.55 0.00 6.00
Semotilus lumbee Snelson and Suttkus 0.78 1.90 0.00 10.00 1.00 2.30 0.00 8.00
Umbra pygmaea DeKay 0.03 0.16 0.00 1.00 0.07 0.26 0.00 1.00
Chemical variables
Temperature (°C) 18.76 3.73 10.00 24.50 19.05 2.86 14.00 23.00
Specific conductance (μS/cm)* 36.45 29.20 14.00 196.00 19.93 5.13 11.00 27.00
Dissolved oxygen (mg/L) 7.79 1.40 5.10 12.20 7.53 1.77 2.30 10.20
pH (s.u.)* 5.95 0.66 4.70 7.40 5.31 0.56 4.40 6.10


 The Southeastern Naturalist is a peer-reviewed journal that covers all aspects of natural history within the southeastern United States. We welcome research articles, summary review papers, and observational notes.